. 2017 May;10(3):743-756.
doi: 10.1038/mi.2016.83. Epub 2016 Oct 5.

Age-related spontaneous lacrimal keratoconjunctivitis is accompanied by dysfunctional T regulatory cells

Affiliations

Age-related spontaneous lacrimal keratoconjunctivitis is accompanied by dysfunctional T regulatory cells

T G Coursey et al. Mucosal Immunol. 2017 May.

Abstract

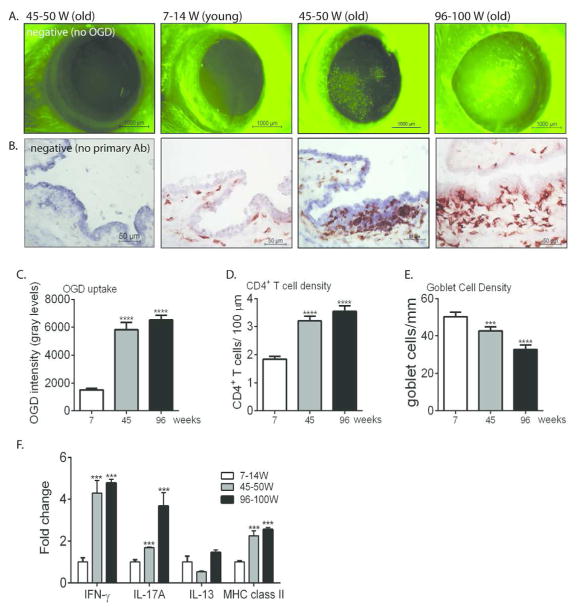
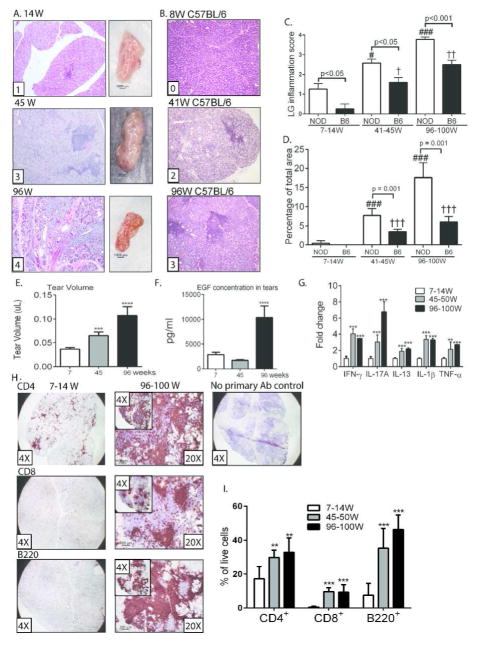
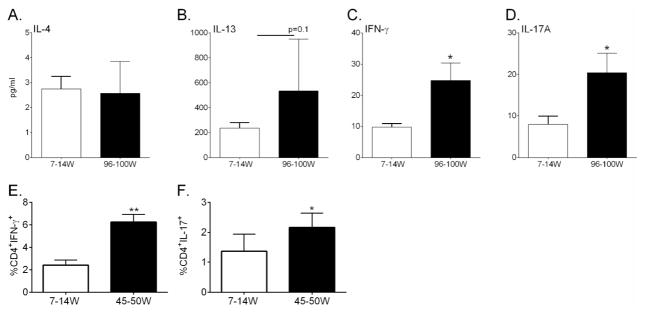
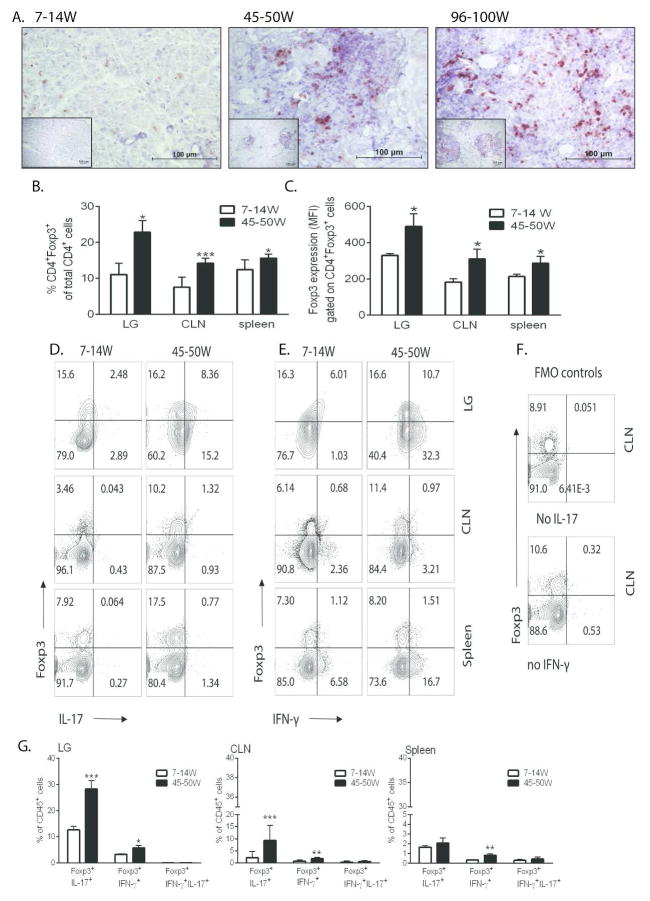
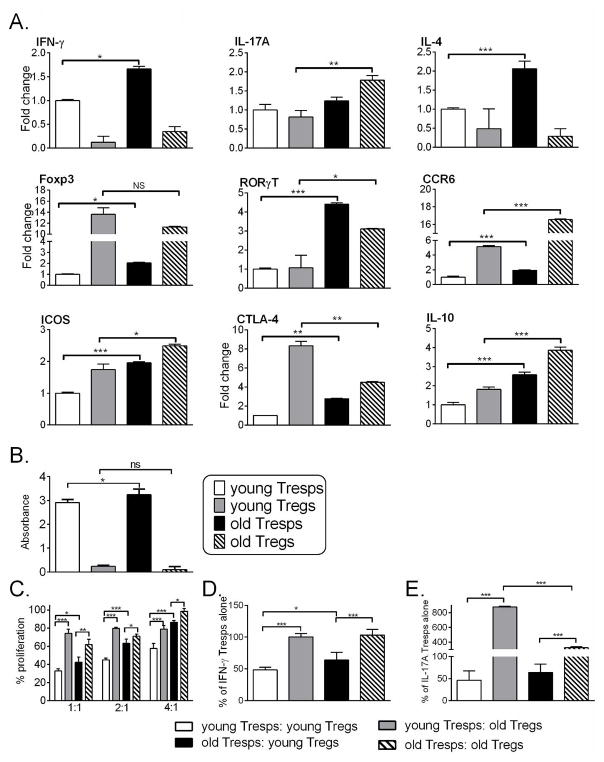
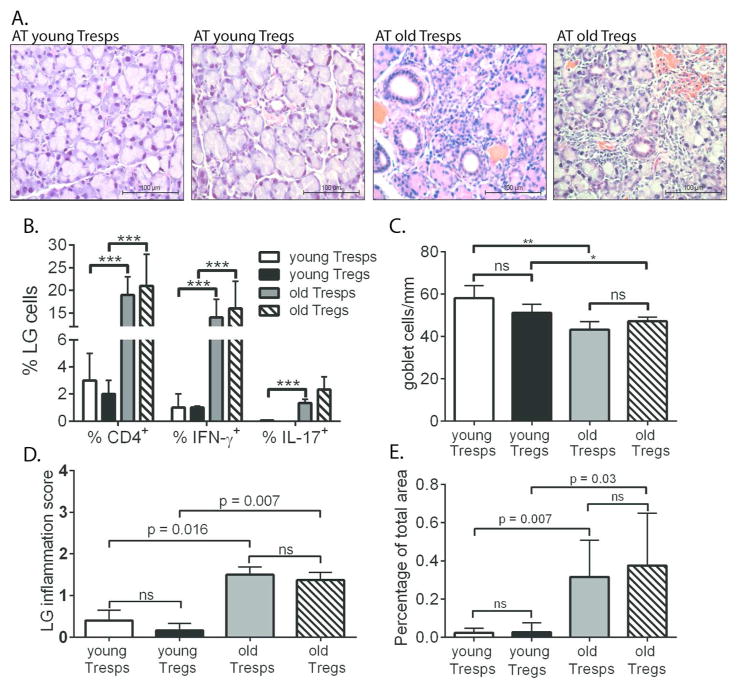
In both humans and animal models, the development of Sjögren syndrome (SS) and non-SS keratoconjunctivitis sicca (KCS) increases with age. Here, we investigated the ocular surface and lacrimal gland (LG) phenotype of NOD.B10.H2b mice at 7-14, 45-50, and 96-100 weeks. Aged mice develop increased corneal permeability, CD4+ T-cell infiltration, and conjunctival goblet cell loss. Aged mice have LG atrophy with increased lymphocyte infiltration and inflammatory cytokine levels. An increase in the frequency of CD4+Foxp3+ T regulatory cells (Tregs) was observed with age in the cervical lymph node (CLN), spleen, and LG. These CD4+CD25+ cells lose suppressive ability, while maintaining expression of Foxp3 (forkhead box P3) and producing interleukin-17 (IL-17) and interferon-γ (IFN-γ). An increase of Foxp3+IL-17+ or Foxp3+IFN-γ+ cells was observed in the LG and LG-draining CLN. In adoptive transfer experiments, recipients of either purified Tregs or purified T effector cells from aged donors developed lacrimal keratoconjunctivitis, whereas recipients of young Tregs or young T effector cells failed to develop disease. Overall, these results suggest inflammatory cytokine-producing CD4+Foxp3+ cells participate in the pathogenesis of age-related ocular surface disease.


Figures

Figure 1
Figure 1. Aged male NOD.B10.H2b mice have a spontaneous dry eye phenotype
A: Representative pictures of the corneas stained with Oregon-Green dextran of 7–14W, 45–50W and 96–100W mice. B: Representative images of conjunctiva frozen sections immunostained for CD4 (in red/brown) used to generate the bar graph in D. C: Corneal Oregon-Green dextran (OGD) fluorescence intensity score. Bar graphs show means ± SD of three independent experiments with five animals per experiment (10 eyes per experiment, yielding a final sample of 30 eyes per group). D: CD4+ T cells infiltrating the conjunctival epithelium. Bar graphs show means ± SD of two independent experiments with two to three animals per age, yielding a final sample of five left eyes for each group). E: Number of PAS+ conjunctival goblet cells counted in paraffin-embedded sections expressed as number per millimeter. Bar graphs show means ± SD of two independent experiments with two to three animals per group, yielding a final sample of five right eyes for each group). F: Relative fold expression changes of IFN-γ, IL-17A, IL-13 and MHC class II mRNA in the conjunctiva. Bar graphs show means ± SD of six samples per age (the experiment was repeated twice with similar results). Parametric t tests statistical tests were used to make comparisons between age groups. *P < 0.05, **P < 0.01, ***P < 0.001, ****P < 0.001 for comparison between age groups. W - weeks
Figure 2
Figure 2. Aged male NOD.B10.H2b mice have dacryoadenitis
A: Representative pictures of the LGs of 7–14W, 45–50W and 96–100W of H & E stained sections of LG (left) with picture of total LG (right). Inflammation scores of the representative images appear in the lower left inset. B. Representative images of the LGs of 8W, 41W and 96W of H & E stained sections of LG of C57BL/6 mice. Inflammation scores of the representative images appear in the lower left inset. C: Inflammation scores of LG pathology of NOD.B10.H2b mice. #P < 0.05, ###P < 0.001 for comparison between NOD.B10.H2b age groups. †P < 0.05, ††P < 0.01 for comparison between C57BL/6 age groups. Two-way Anova followed by Holm-Sidak’s comparison test was used to make comparisons of inflammation scores. D: Calculation of the foci area as a percentage of the total lacrimal gland area. #P < 0.05, ###P < 0.001 for comparison between NOD.B10.H2b age groups. †P < 0.05, ††P < 0.01 for comparison between C57BL/6 age groups. Two-way Anova followed by Holm-Sidak’s comparison test was used to make comparisons of inflammation scores. The data in C and D is the mean of at least five (range five to nine) LGs from different animals. E. Tear volumes were measured by phenol red threads tests. Bar graphs show the means ± SD of six to eight animals per group. F. Tear EGF concentrations from NOD.B10.H2b mice were measured by enzyme linked immunosorbent assay. Tear washings from both right and left eyes from one mouse per group were collected and pooled into a single tube, yielding a final sample of 12 individual samples per group divided into three independent experiments with four samples per experiment. G: Relative fold expression changes of IFN-γ, IL-17A, IL-13, IL-1β, and TNF-α mRNA in the LG. Bar graphs show means ± SEM of six samples per age (the experiment was repeated twice with similar results). H: Representative images of frozen lacrimal gland sections immunostained for CD4 (upper), CD8 (middle), and B220 (bottom) of 7-14W mice compared to 96–100W mice. As a negative control, 96–100 W LG section was stained without primary antibody (upper right). Insets are 4X and larger images are 20X in the 96–100W group. I: Flow cytometric analysis of LG in 7–14W, 45–50W and 96–100W. Right and left extraorbital LGs from one mouse per group were excised and pooled into a single tube, yielding a final sample of 12 individual LG samples per group and age divided into three independent experiments with four samples per experiment. Bar graphs show means ± SD Parametric t tests statistical tests were used to make comparisons between age groups. *P < 0.05, **P < 0.01, ***P < 0.001, ****P < 0.001 for comparison between age groups.
Figure 3
Figure 3. Increase production of cytokines in the serum and lymphoid tissue of aged mice
A–D: The concentration of IL-4 (A), IL-13 (B), IFN-γ (C), and IL-17A (D) were measured in the blood serum of 7–14W and 96–100W mice by Luminex assay. Serum was collected from five mice per group. E–F: The percentage of CD4+IFN-γ+ cells (E) and CD4+IL-17+ cells (F) in the spleens of 7–14W and 45–50W mice was determined by flow cytometry. Bar graphs show means ± SD of six to eight animals. Parametric t tests statistical tests were used to make comparisons between age groups. *P < 0.05, **P < 0.01 for comparison between age groups.
Figure 4
Figure 4. Aged NOD.B10.H2b mice have an increase in CD4+Foxp3+ Tregs that produce IL-17 and IFN-γ
A: Immunohistochemical staining for Foxp3 in the LG demonstrated an increase in Foxp3 with increasing age. Magnification is 20X; inset is 4X. B: Flow cytometric analysis showing the percentage of CD4+Foxp3+ in LG, SMG, CLN, and spleen of 7–14W and 45–50W mice. Lymphocytes were individually identified on the basis of forward scatter and side scatter properties, subsequently gated on the basis of forward scatter height versus forward scatter area (singlets 1), then gated on side scatter height versus side scatter area (singlets 2). Propidium iodide exclusion was used to discriminate live cells; CD4+ T cells were gated based on FSC-A properties C: Mean fluorescence intensity (MFI) of Foxp3 (MFI) in the LG, CLN and spleen of 7–14W and 45–50W mice. D–E: Flow cytometric analysis of LG, SMG, CLN, and spleen indicated an increase Foxp3+IL-17A+ cells (D) or Foxp3+IFN-γ+ cells (E) in 45–50W mice. Representative plots are shown for each age group. F: FMO controls are shown the right. G: Bar graphs show cumulative data presented in D and E. Graphs (B–E, G) show the means ± SD of four- six samples per age (the experiment was repeated three times with similar results).
Figure 5
Figure 5. Aged mice develop CD4+CD25+Foxp3+IL-17+ or CD4+Foxp3+IFN-γ+ cells that have an effector cell phenotype and are dysfunctional
A: Relative fold expression changes in Teffector and Treg marker mRNA of young Tresps (CD4+CD25), young Tregs (CD4+CD25+), old Tresps and old Tregs. Fold change was determined by comparison to young Tresp cells. Bar graphs show means ± SD of four to six samples per group. B: Cell proliferation was measured for young CD4+CD25 Tresps, young CD4+CD25+ Tregs, old CD4+CD25 Tresps, and old CD4+CD25+ Tregs with colorimetric Cell Proliferation WST-1 Reagent. C: Cell proliferation was measured in co-cultures of Tregs and effector T cell responders (CD4+CD25; Tresps) from young (7–14W) and old (45–50W) mice. Tregs and Tresps were cultured at a 1:1, 2:1, or 4:1 ratio (Tresps: Tregs) for 72 hrs. % proliferation was determined the by calculating proliferation compared to Tresps without Tregs. Bar graphs show means ± SD of the average of three independent experiments. D: The production of IFN-γ was determined by Luminex assay. Co-culture supernatants were collected in triplicate and the percentage of IFN-γ compared to Tresps alone was determined. Bar graphs show a representative experiment of three independent experiments with the same trend. E: The production of IL-17A was determined by Luminex assay. Co-culture supernatants were collected in triplicate and the percentage of IL-17A compared to Tresps alone was determined. Bar graphs show a representative experiment of three independent experiments with the same trend. Parametric t tests statistical tests were used to make comparisons between age groups. *P < 0.05, **P < 0.01, ***P < 0.001, ****P < 0.001 for comparison between age groups.
Figure 6
Figure 6. Adoptive transfer (AT) of aged Tregs mediates disease in recipient animals
A: H & E staining of LGs of AT recipients indicated CD4+ T cell infiltration in recipients receiving old Tresps or Tregs. Representative images (40X) are shown for each AT group. B: Flow cytometric analysis of recipient LGs indicated an increase CD4+ T cells, specifically CD4+IFN-γ+ and CD4+IL-17+ cells, in mice receiving Tresps or Tregs from 45–50W mice. Bar graphs show means ± SD of four-six samples per AT group. C. Number of PAS+ conjunctival goblet cells counted in paraffin-embedded sections expressed as number per millimeter. Bar graphs show means ± SD of four to six animals per AT group. Parametric t tests statistical tests were used to make comparisons between age groups. *P < 0.05, **P < 0.01, ***P < 0.001, ****P < 0.001. D: Inflammation scores of LG pathology of AT recipients. Non-parametric Mann-Whitney U statistical tests were used to make comparisons of inflammation scores. E: Calculation of the foci area as a percentage of the total lacrimal gland area. Non-parametric Mann-Whitney U statistical tests were used to make comparisons of inflammation scores. The data in C and D is the mean of four to six LGs from different animals.

Similar articles

Cited by

References

    1. Rocha EM, Alves M, Rios JD, Dartt DA. The Aging Lacrimal Gland: Changes in Structure and Function. Ocul Surf. 2008;6:162–174. - PMC - PubMed
    1. Sergiev PV, Dontsova OA, Berezkin GV. Theories of aging: an ever-evolving field. Acta Naturae. 2015;7:9–18. - PMC - PubMed
    1. Cohen AA. Complex systems dynamics in aging: new evidence, continuing questions. Biogerontology 2015 - PMC - PubMed
    1. Fulop T, Witkowski JM, Pawelec G, Alan C, Larbi A. On the immunological theory of aging. Interdiscip Top Gerontol. 2014;39:163–176. - PubMed
    1. Castelo-Branco C, Soveral I. The immune system and aging: a review. Gynecol Endocrinol. 2014;30:16–22. - PubMed

Publication types

MeSH terms