. 2016 Oct 13;538(7624):257-259.
doi: 10.1038/nature19793. Epub 2016 Oct 5.

Evidence for a limit to human lifespan

Affiliations

Evidence for a limit to human lifespan

Xiao Dong et al. Nature. .

Abstract

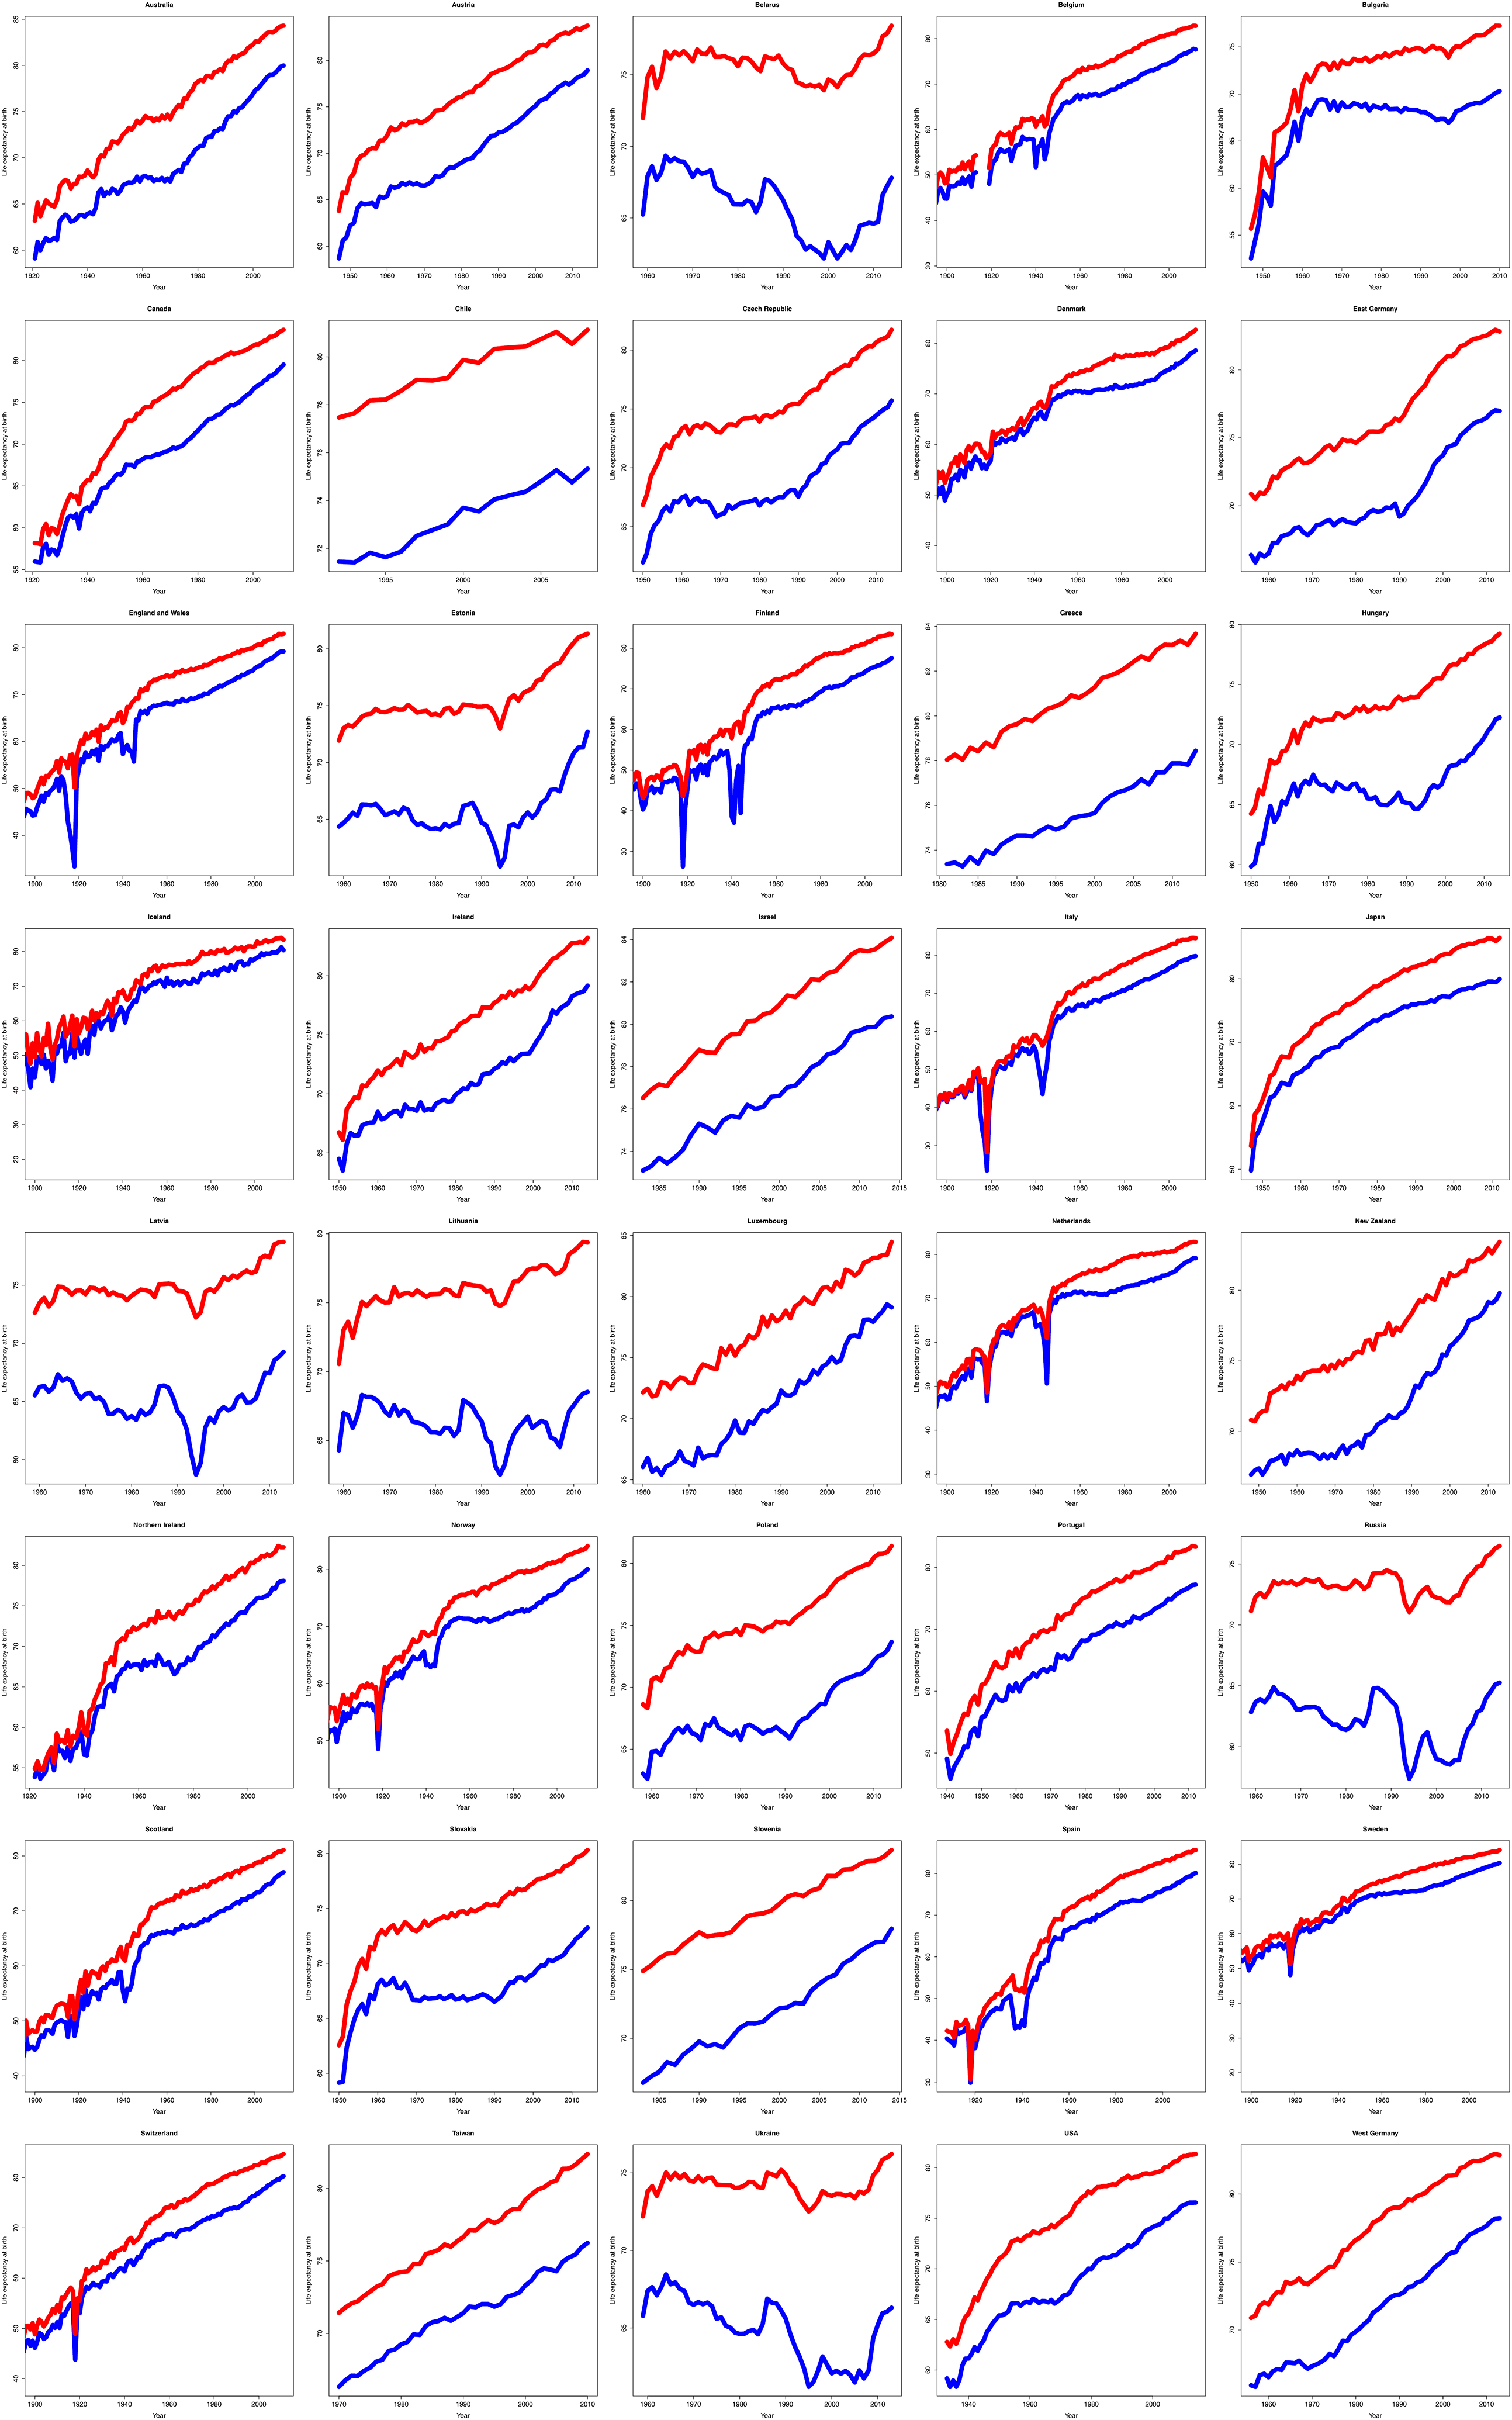
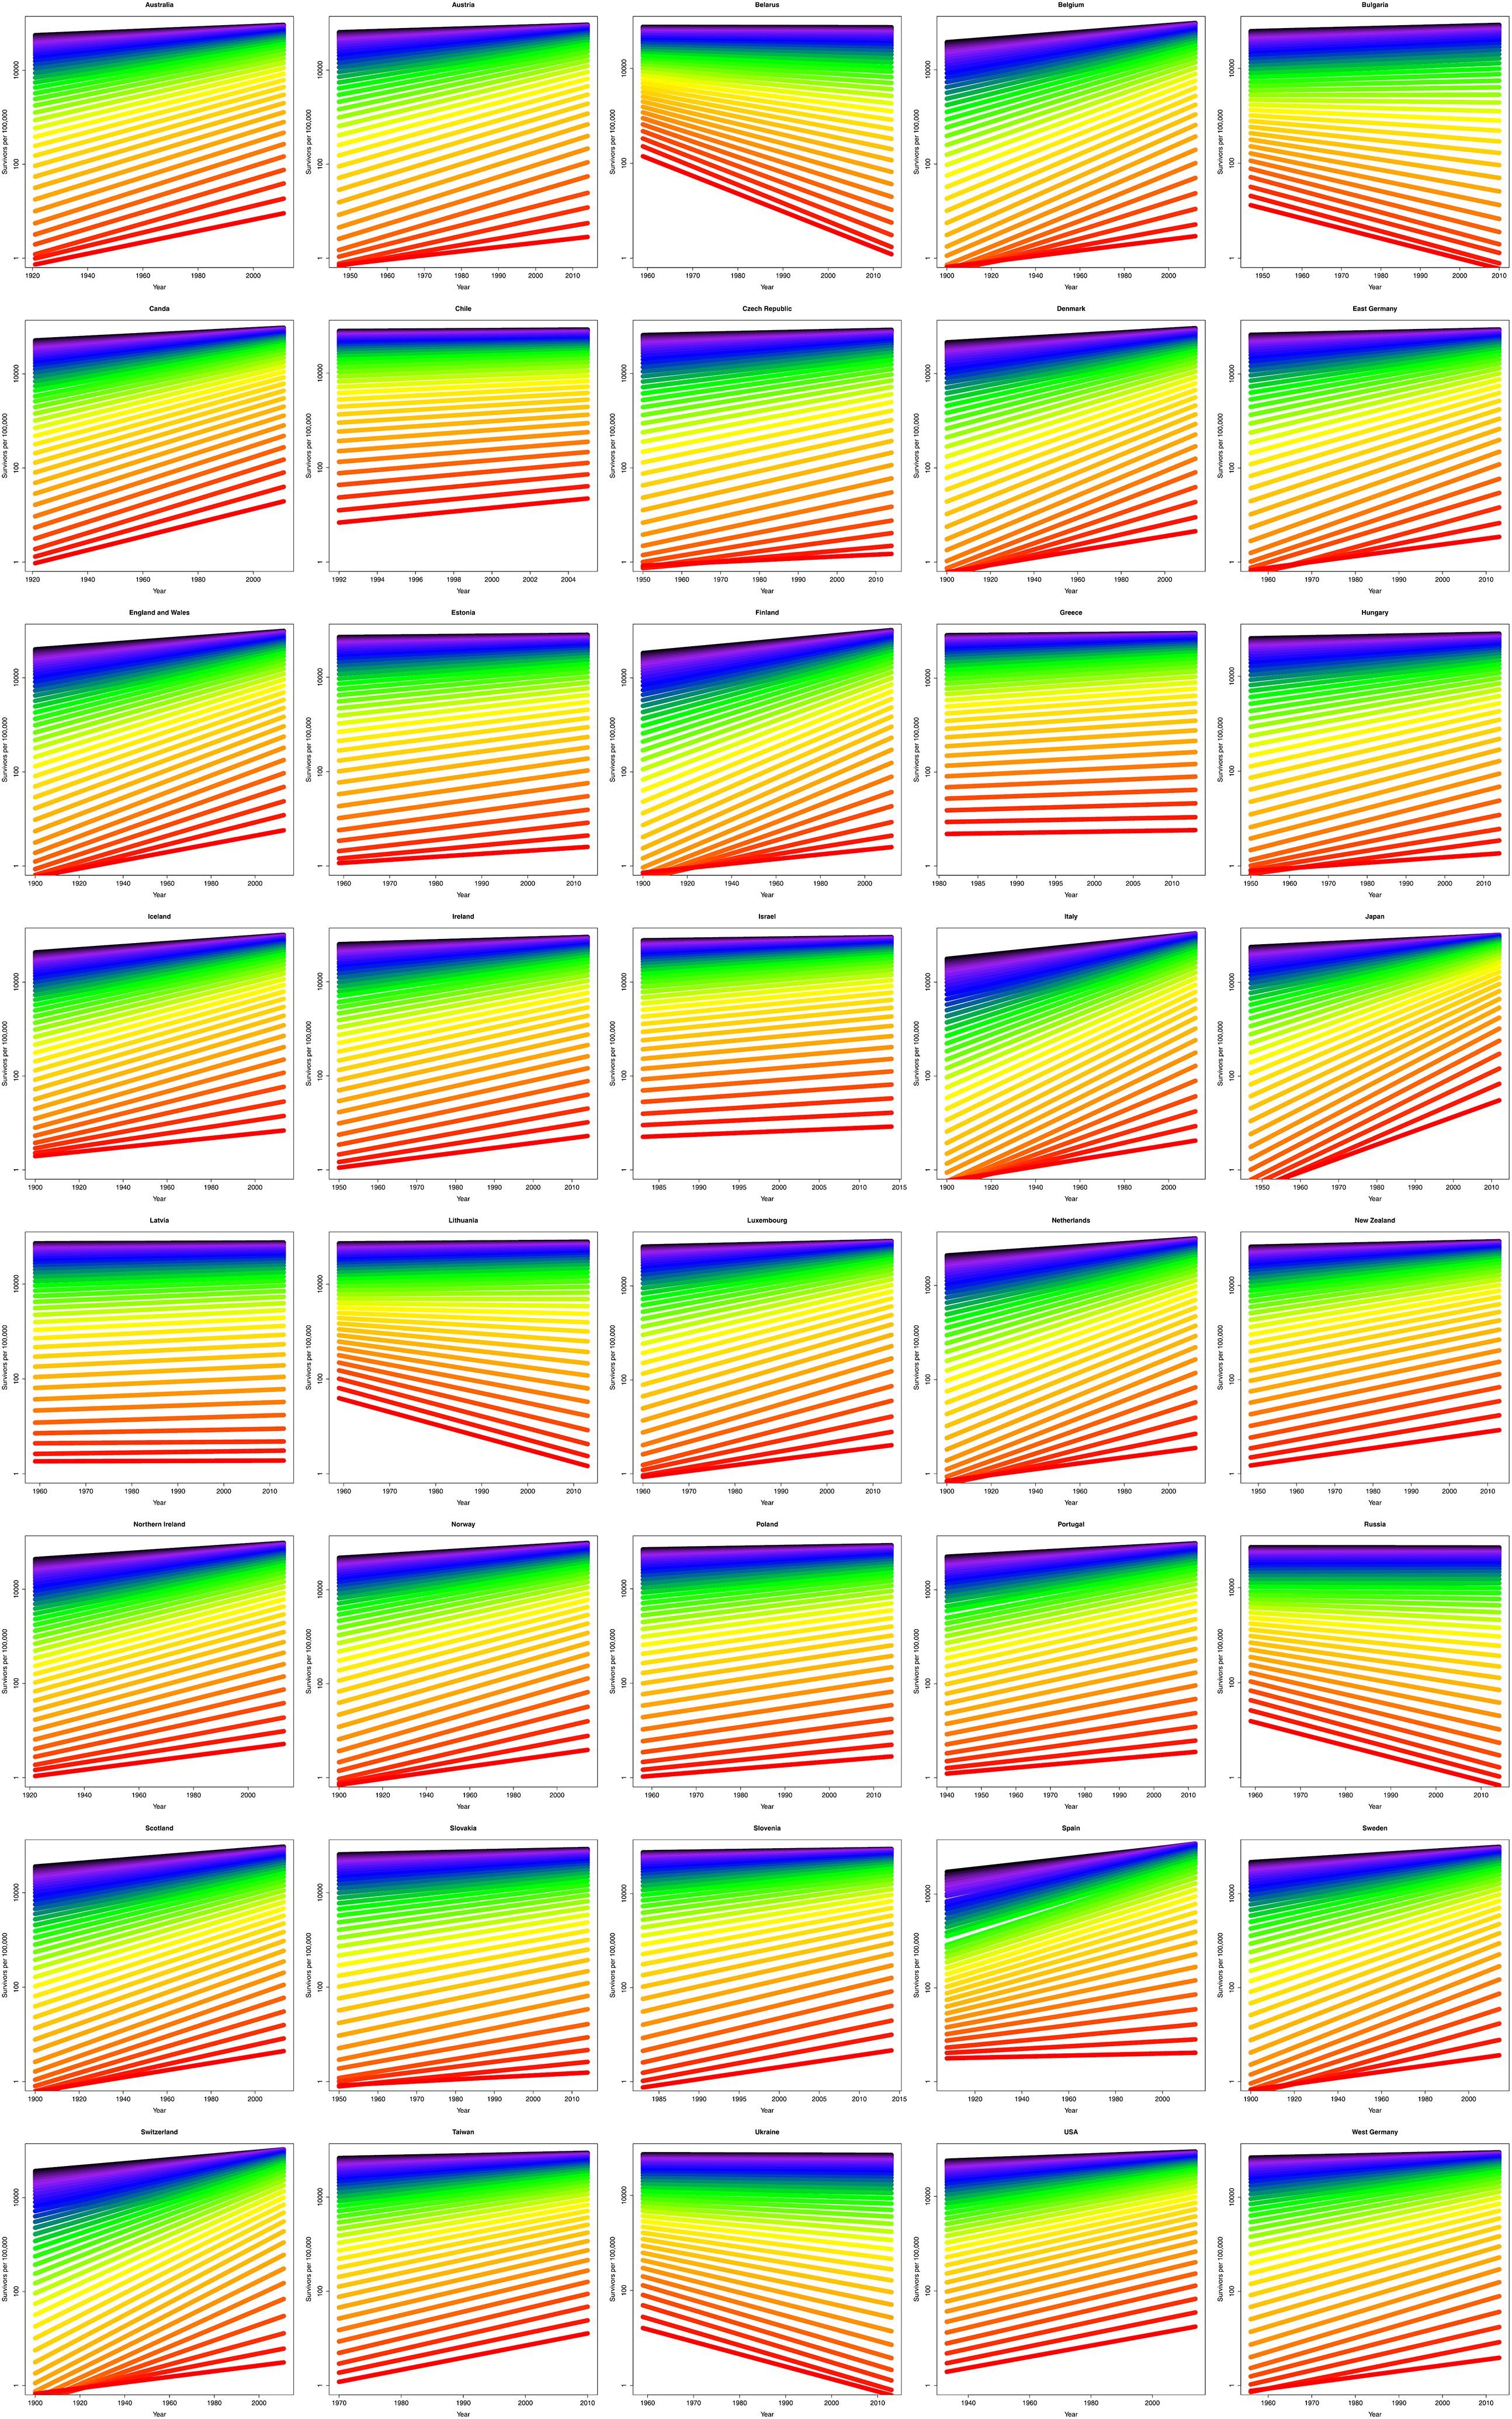
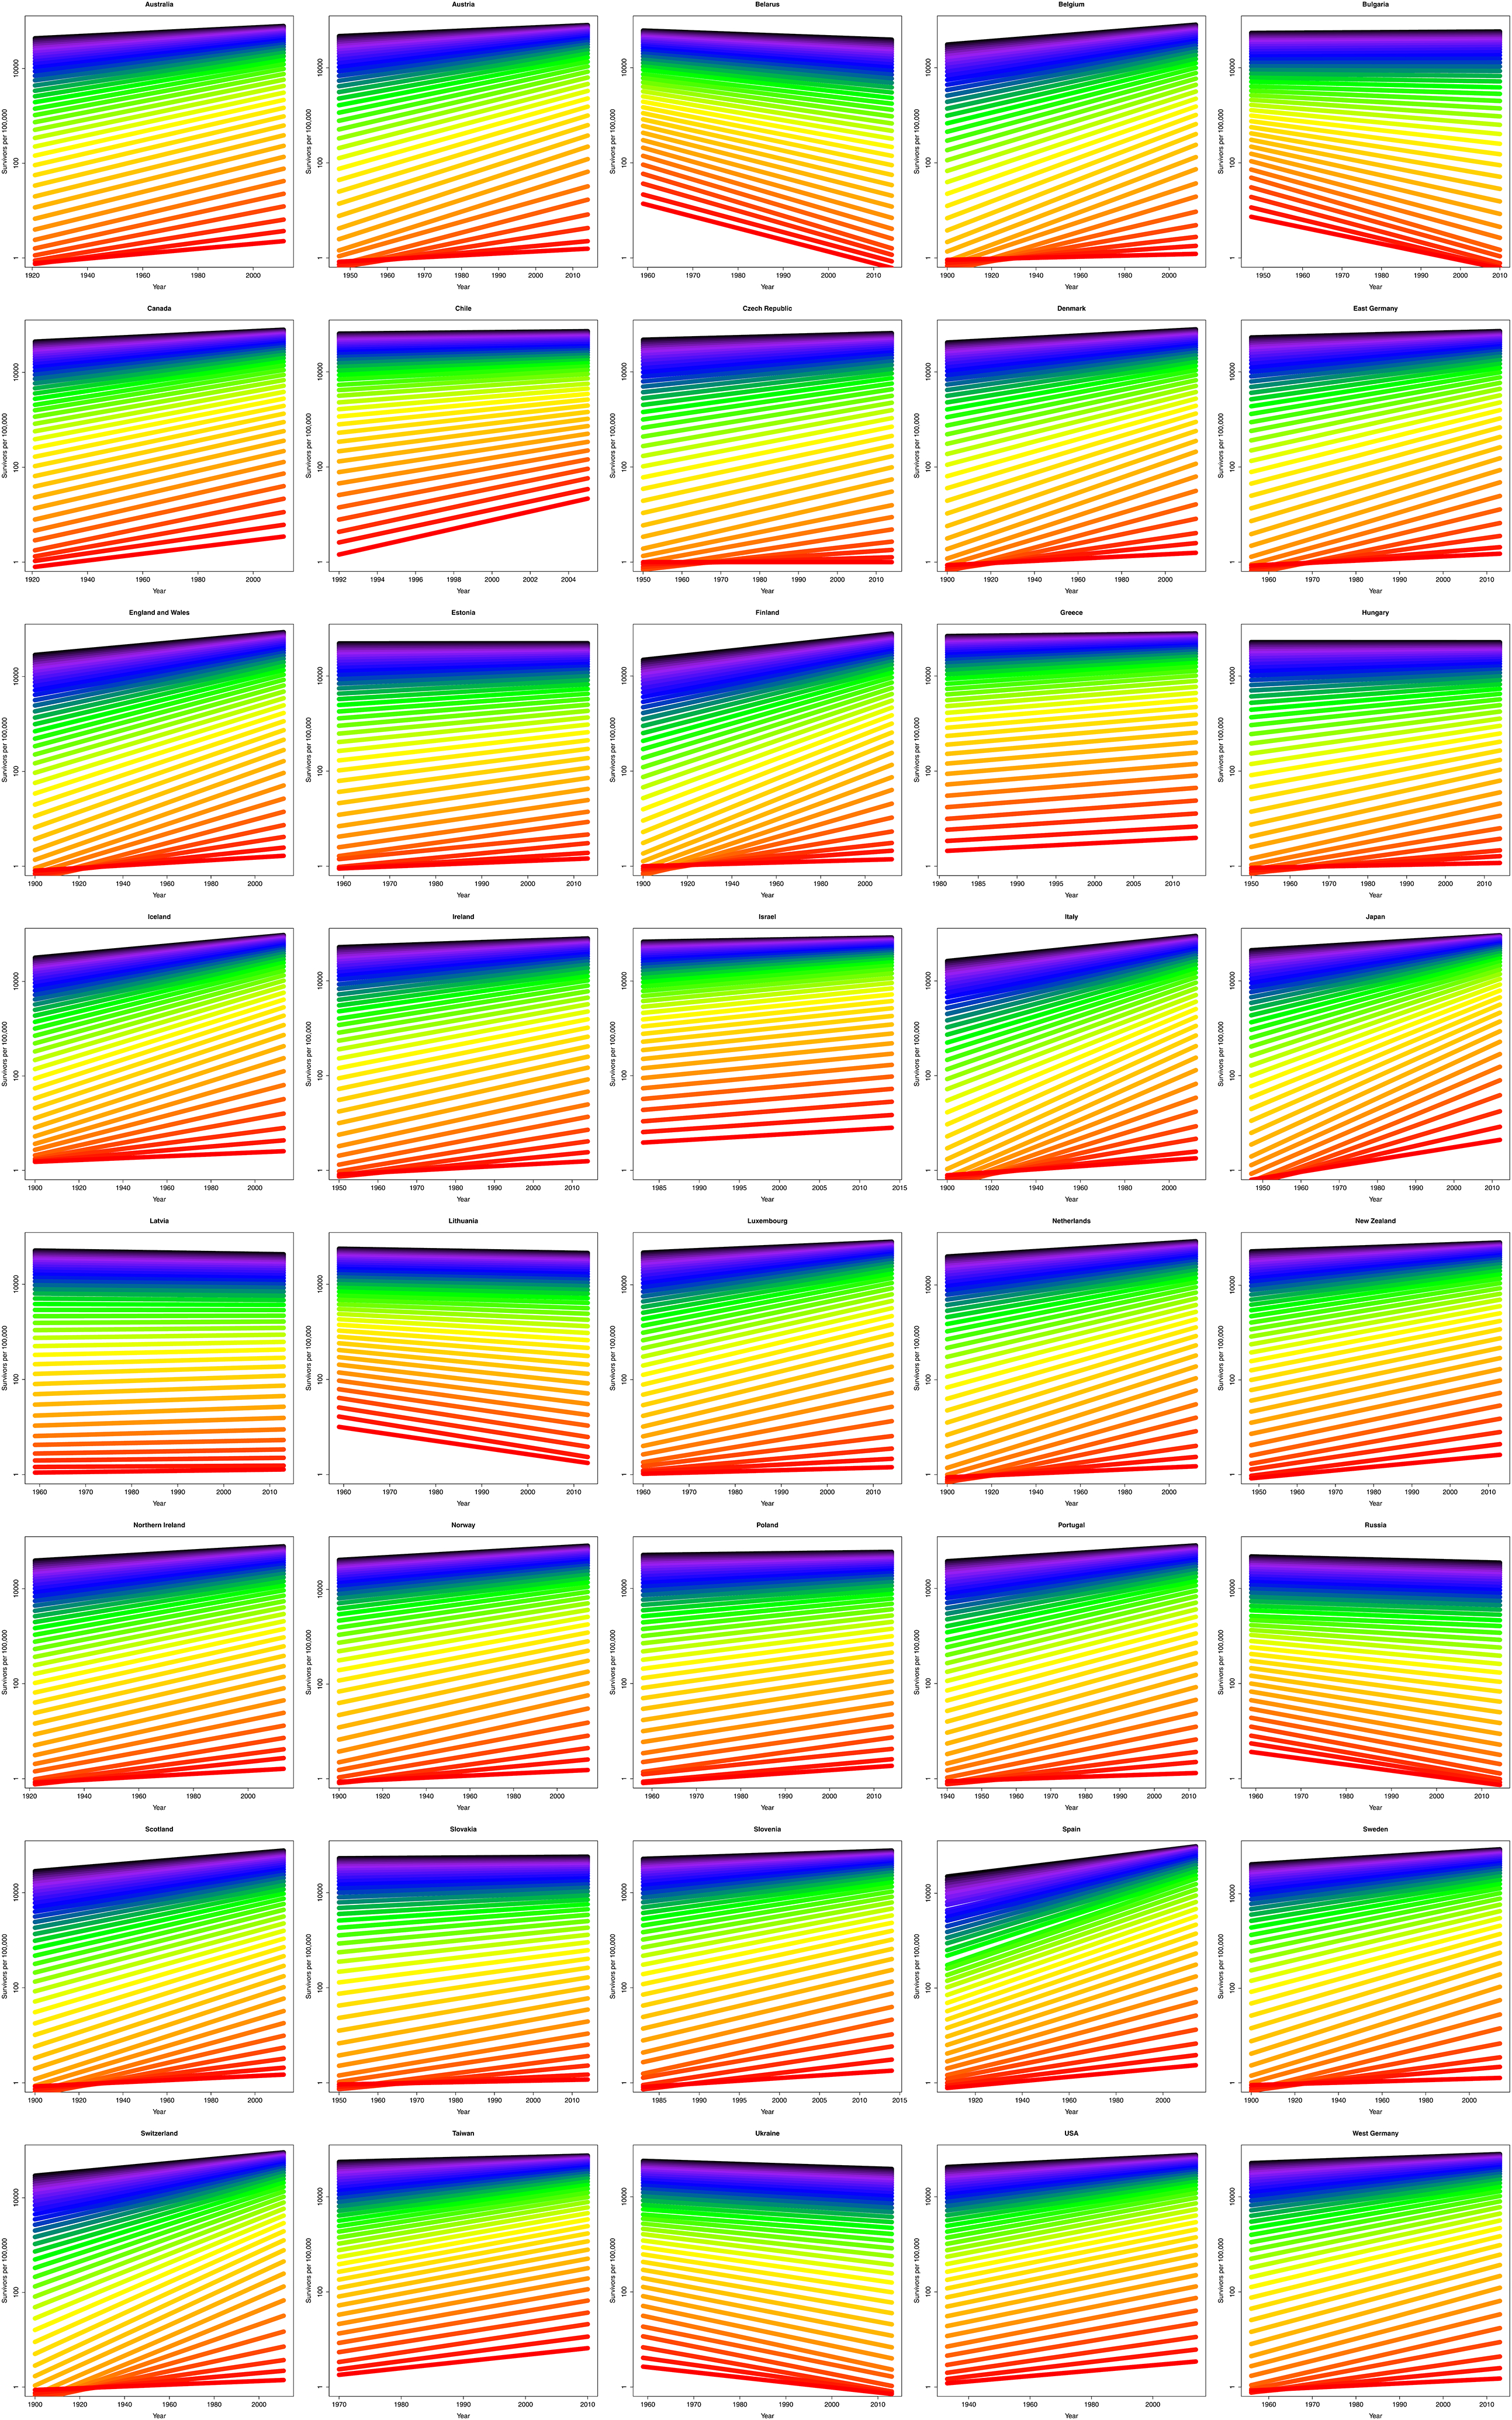
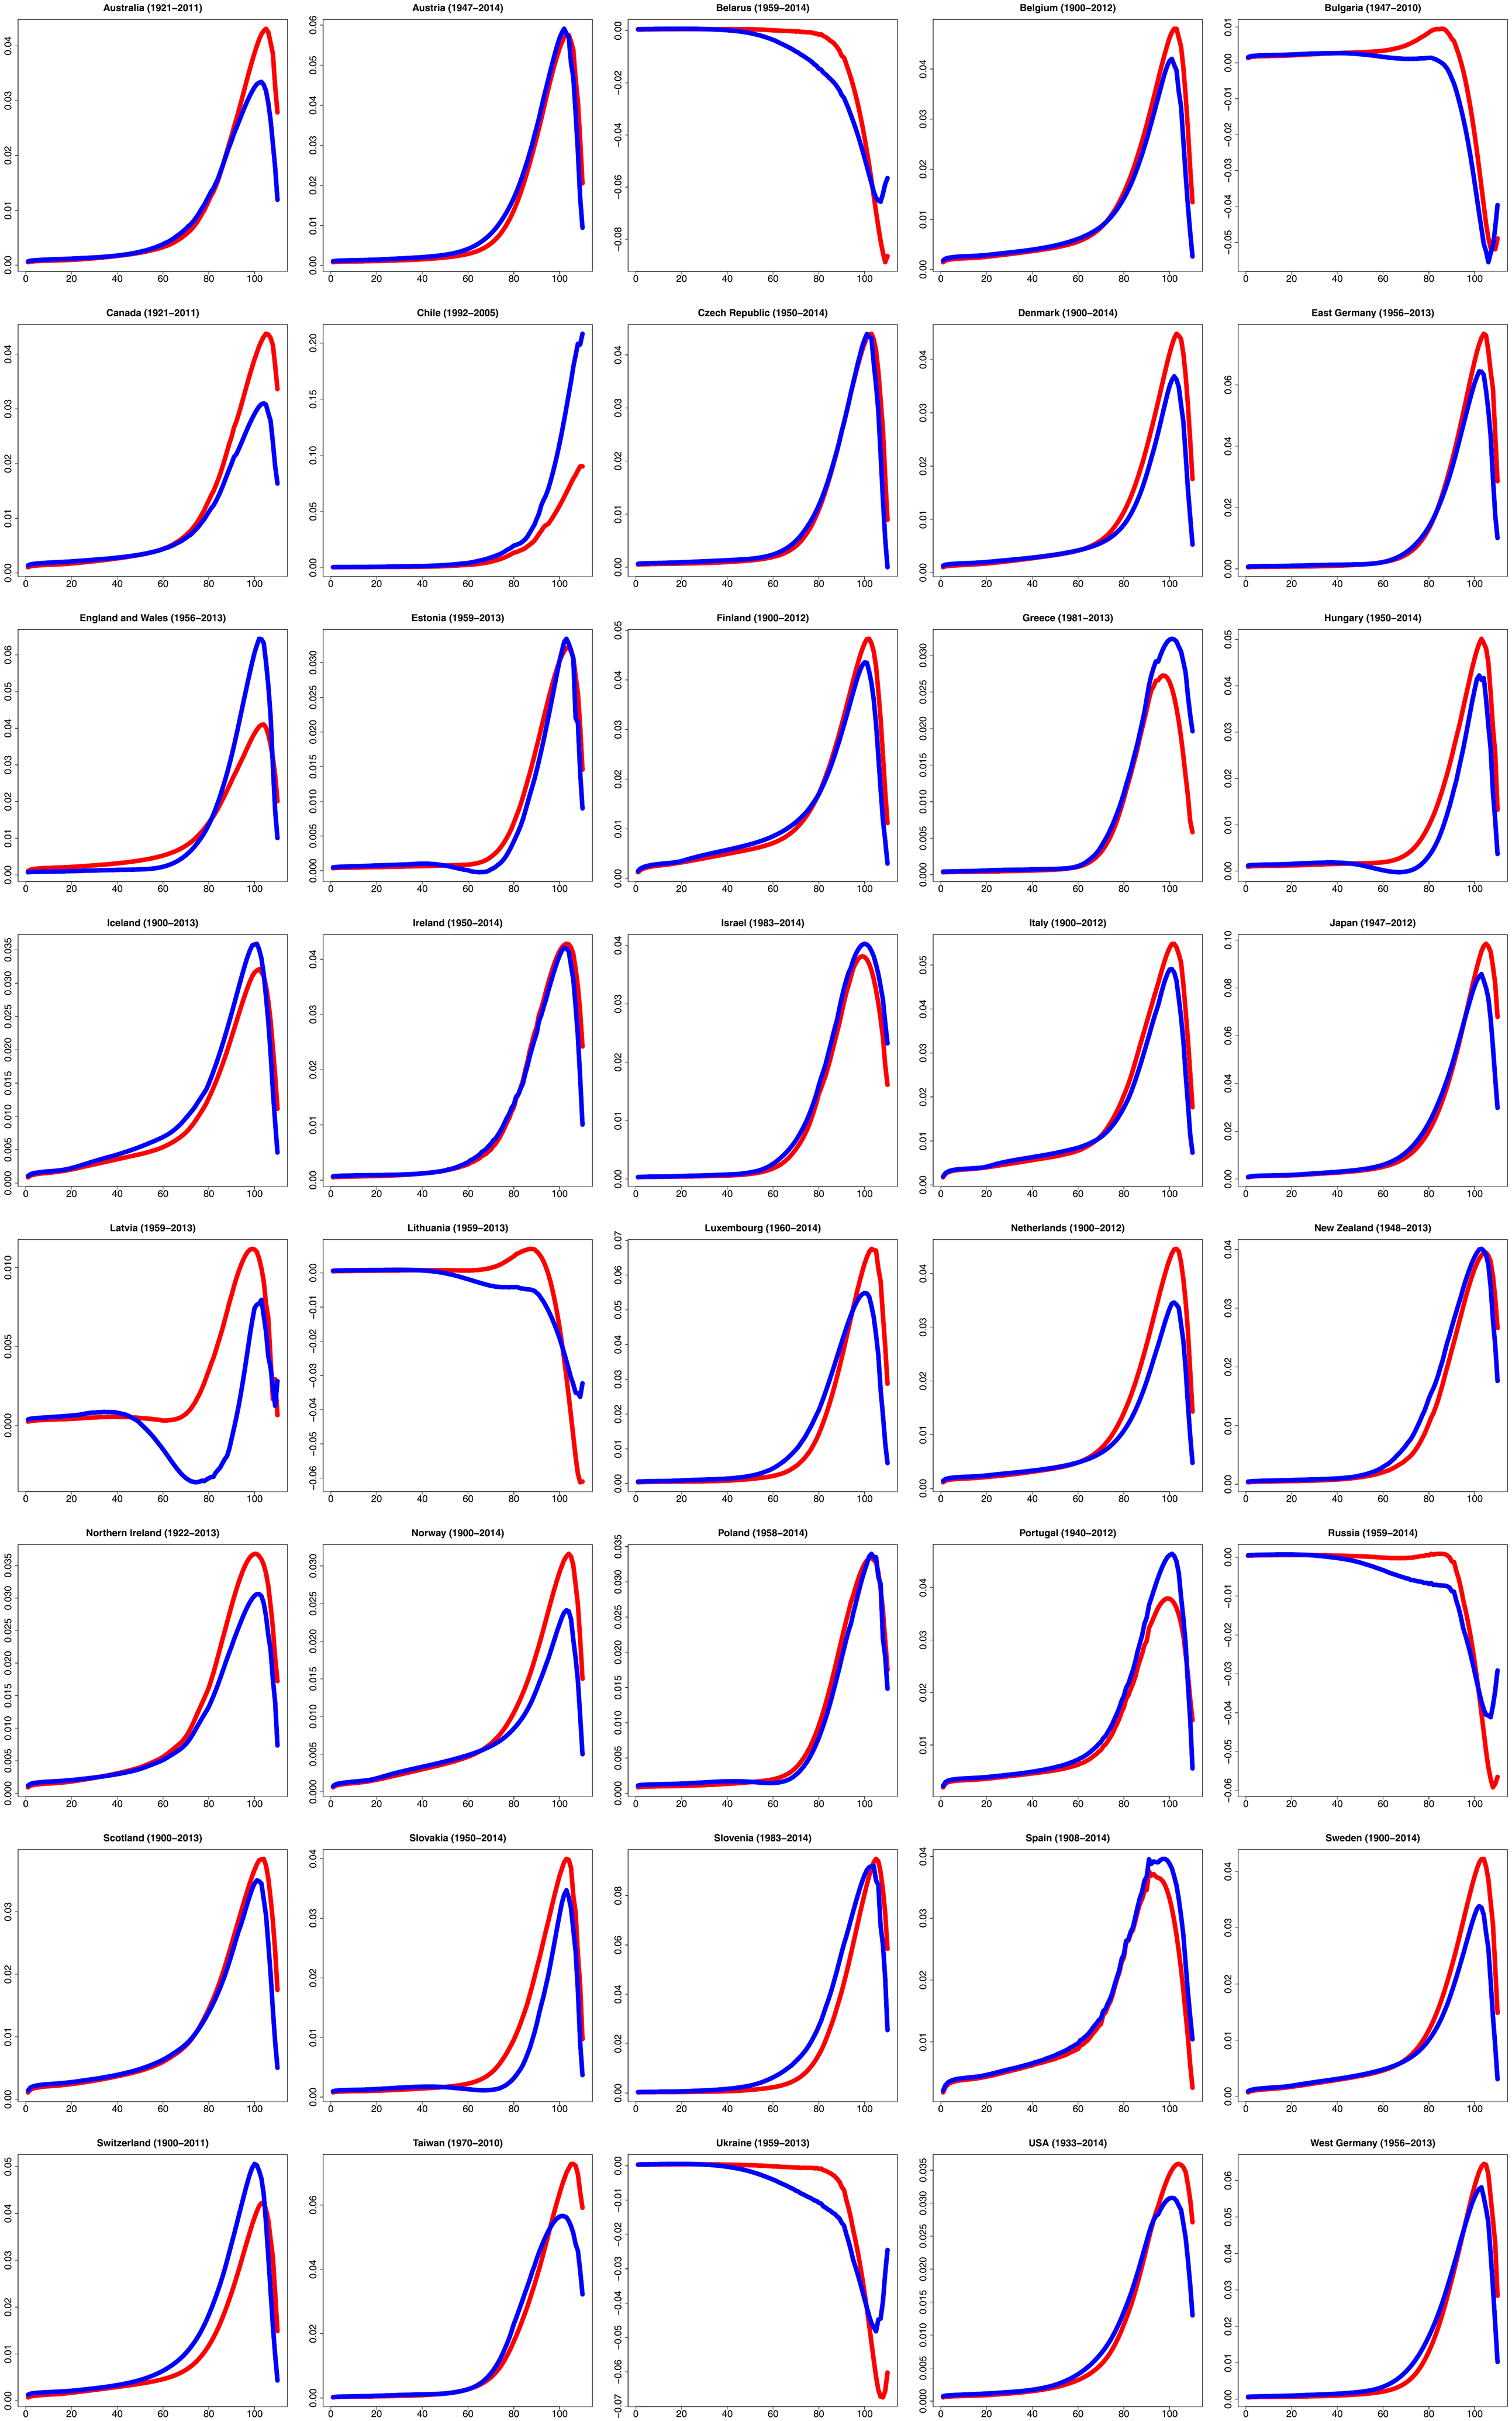
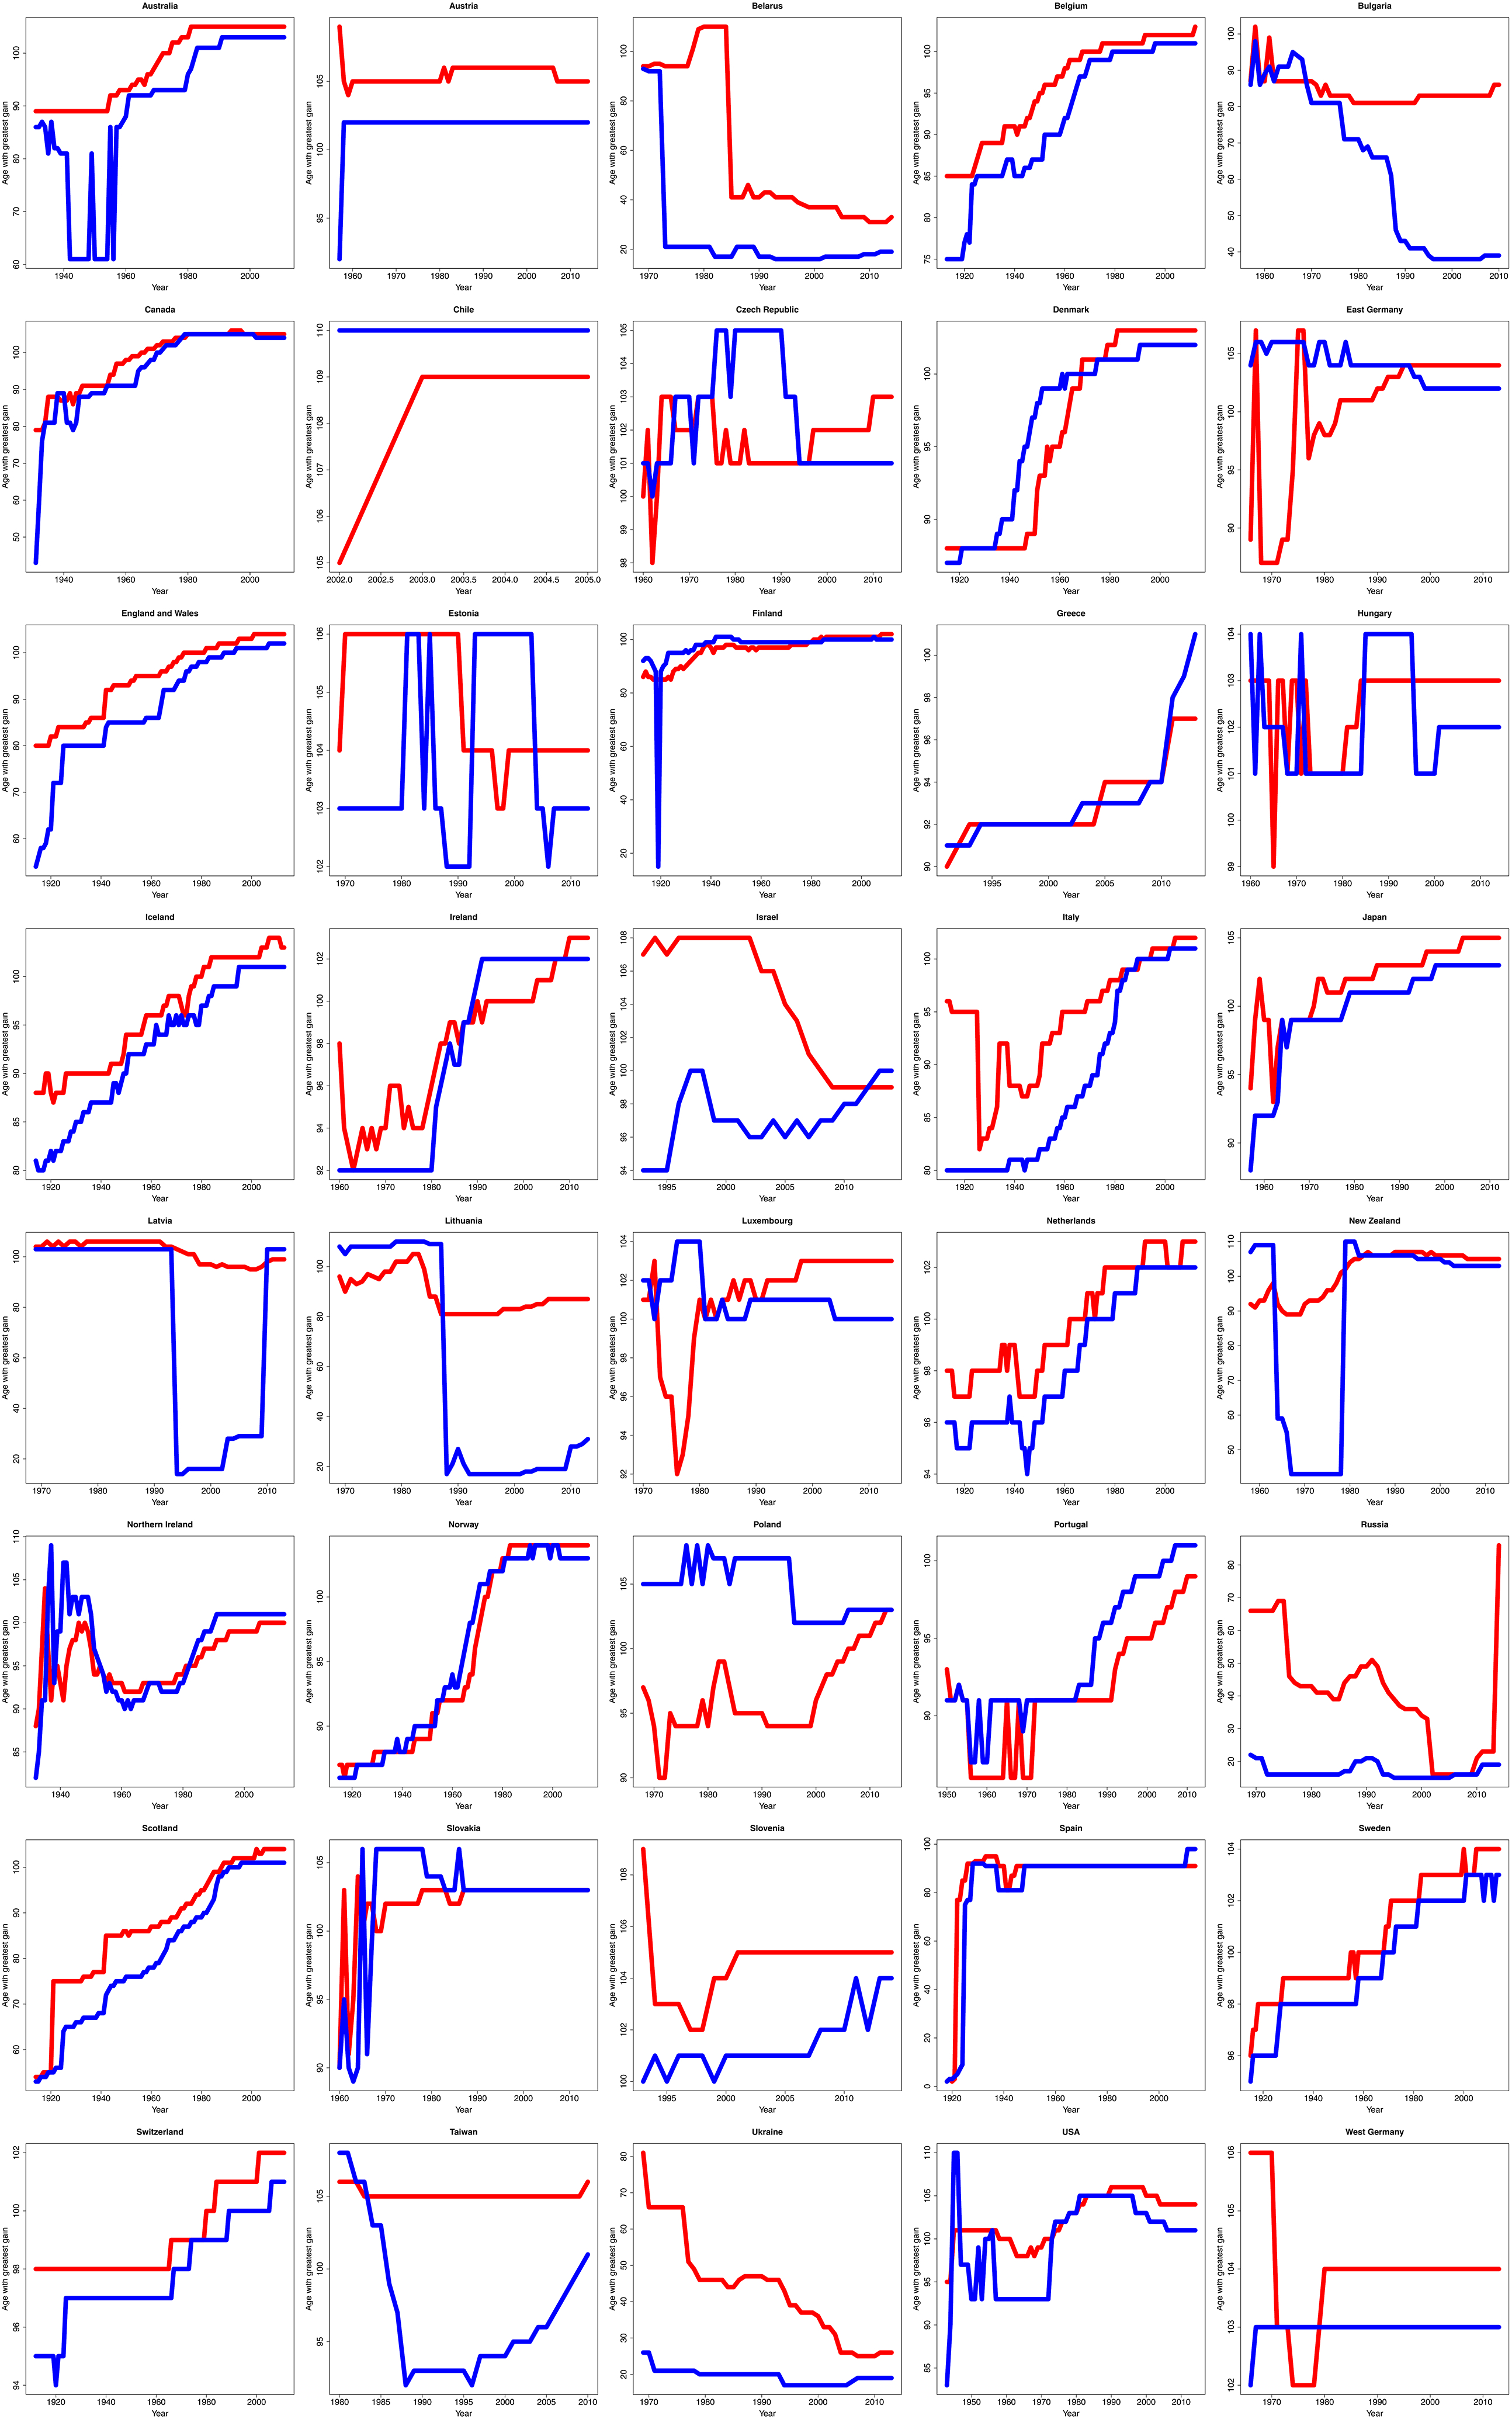
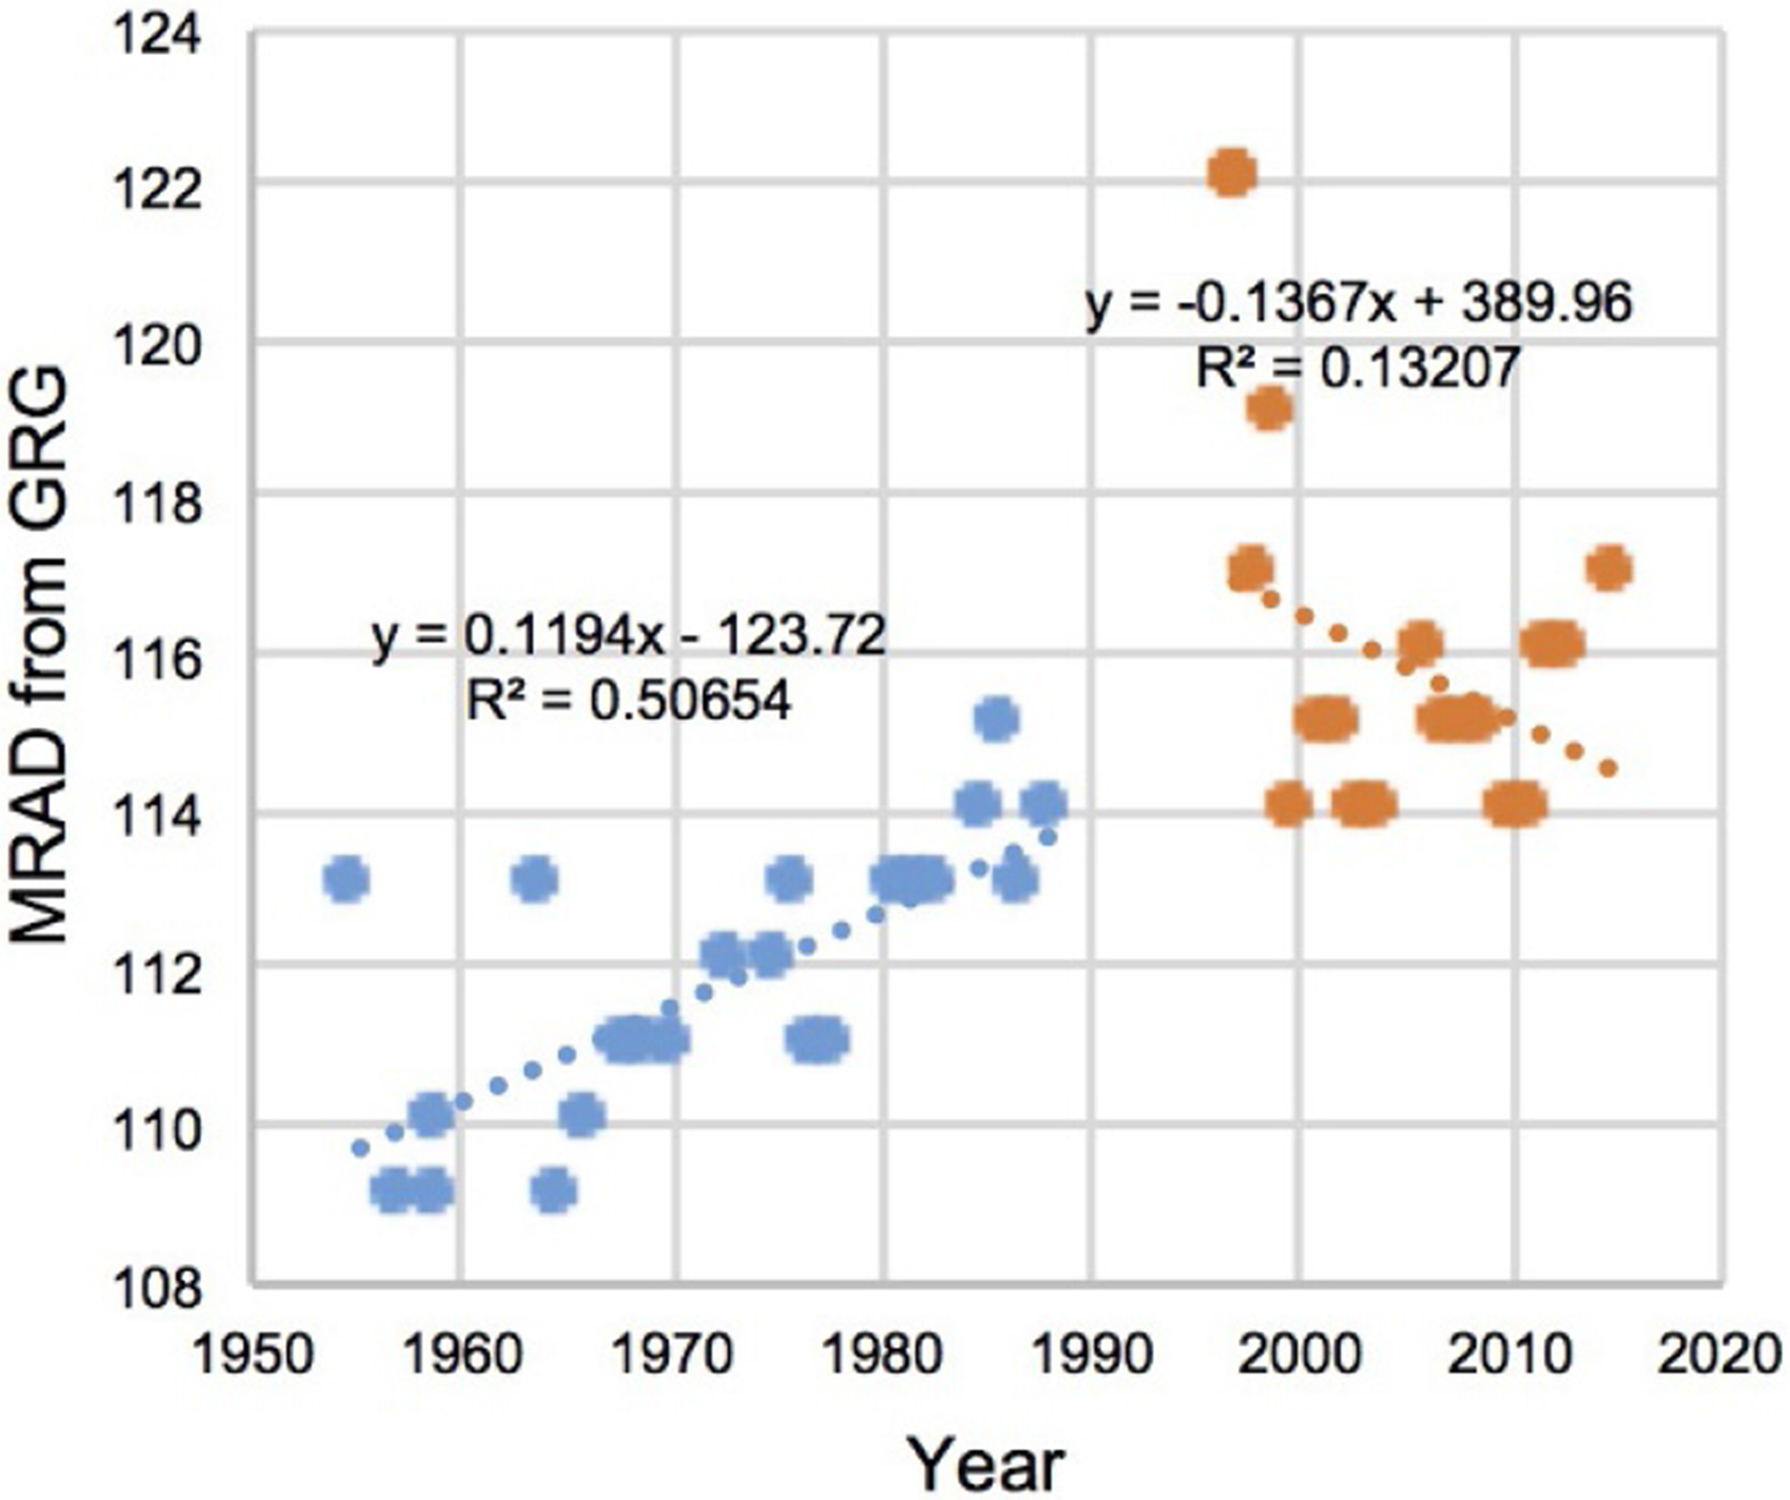
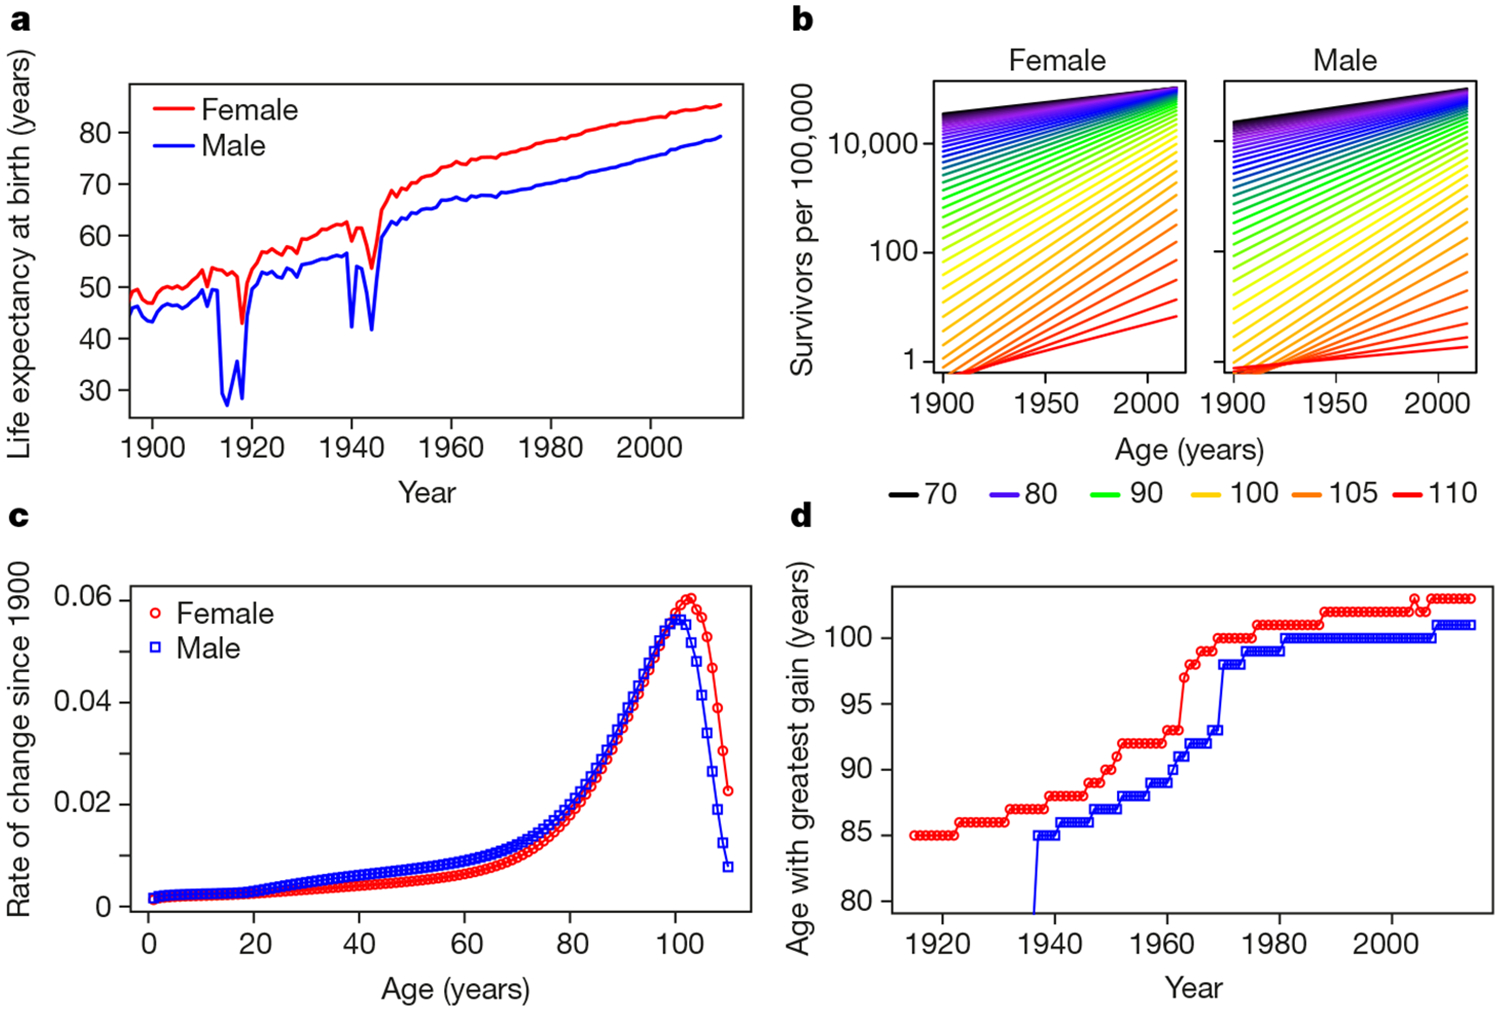
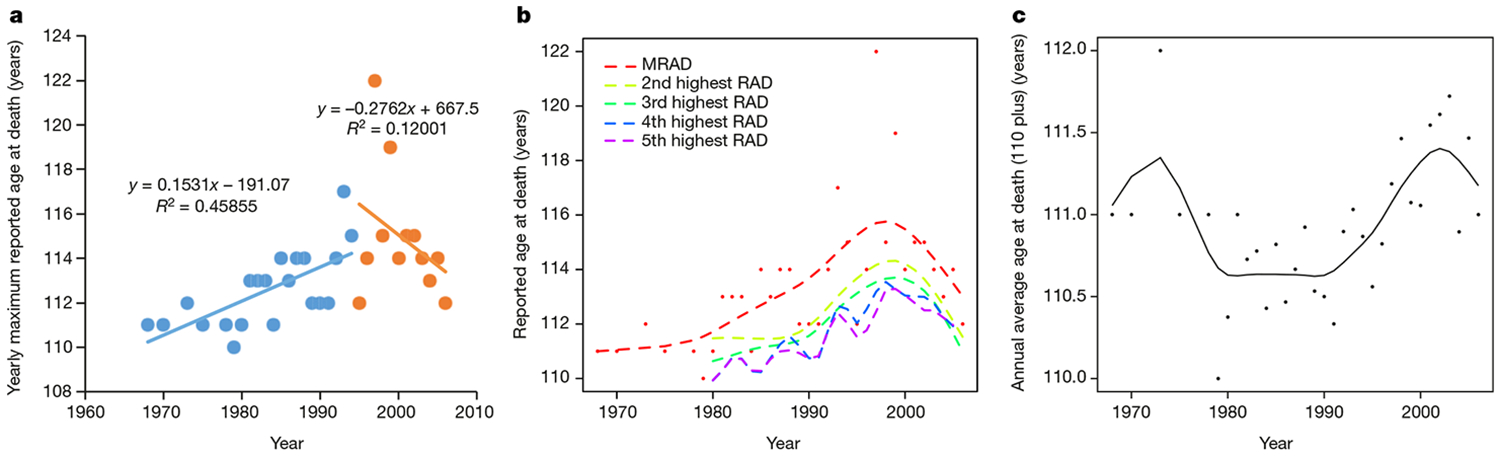
Driven by technological progress, human life expectancy has increased greatly since the nineteenth century. Demographic evidence has revealed an ongoing reduction in old-age mortality and a rise of the maximum age at death, which may gradually extend human longevity. Together with observations that lifespan in various animal species is flexible and can be increased by genetic or pharmaceutical intervention, these results have led to suggestions that longevity may not be subject to strict, species-specific genetic constraints. Here, by analysing global demographic data, we show that improvements in survival with age tend to decline after age 100, and that the age at death of the world's oldest person has not increased since the 1990s. Our results strongly suggest that the maximum lifespan of humans is fixed and subject to natural constraints.


Figures

Extended Data Figure 1 ∣
Extended Data Figure 1 ∣. Life expectancy over time since 1900 (or the earliest year for which data was available) in 40 countries and territories.
There is a generally positive trend over time; life expectancy in Japan appears to be reaching a plateau, but the increase looks unabated in many of the other countries. The data represent the entire population for each region, except Scotland, where it represents only the civilian population. The colour scheme is as in Fig. 1a.
Extended Data Figure 2 ∣
Extended Data Figure 2 ∣. Proportion of the population surviving to old age among females in 40 countries and territories.
The data represent the entire population for each region, except Scotland, where it represents only the civilian population. The colour scheme is as in Fig. 1b.
Extended Data Figure 3 ∣
Extended Data Figure 3 ∣. Proportion of the population surviving to old age among males in 40 countries and territories.
The data represent the entire population for each region, except Scotland, where it represents only the civilian population. The colour scheme is as in Fig. 1b.
Extended Data Figure 4 ∣
Extended Data Figure 4 ∣. Rate of change in survival since 1900 (or the earliest year for which data was available) to a given age as a function of that age in 40 countries and territories.
The rate of change is the slope of the line calculated by an exponential regression, that is, b in the equation y = a + bx, where x is age and y is the logarithm of the number of survivors to that age per 100,000. Including France, 90% (37/41) of the regions examined exhibited the pattern depicted in Fig. 1c.
Extended Data Figure 5 ∣
Extended Data Figure 5 ∣. Age with the greatest increase in survival as a function of calendar year in 40 countries and territories.
For each year, the age with the greatest increase in survival over the past 100 years (or since the earliest year for which data was available), that is, the peak of a graph like that from Extended Data Fig. 4, was determined. Including France (Fig. 1d), a total of 82 data sets were considered (males and females in each region); we used linear regressions of segments of the data to look for evidence of plateaus. A data set was considered to be plateauing if one of the following criteria applied: the second half of the data had a negative slope; the first half of the data had a negative slope (as an increase in the second half would likely reflect a return to some equilibrium after being negatively perturbed); the first half of the data had a slope greater than that of the second half of the data; or the final 10% of the data had a slope less than that of the preceding 40%. In 88% (72/82) of the data sets, there was evidence of a plateau.
Extended Data Figure 6 ∣
Extended Data Figure 6 ∣. The yearly maximum reported age at death from the GRG database (worldwide, 1972–2015).
The lines represent the functions of linear regressions.
Figure 1 ∣
Figure 1 ∣. Trends in life expectancy and late-life survival.
a, Life expectancy at birth for the population in each given year. Life expectancy in France has increased over the course of the 20th and early 21st centuries. b, Regressions of the fraction of people surviving to old age demonstrate that survival has increased since 1900, but the rate of increase appears to be slower for ages over 100. c, Plotting the rate of change (coefficients resulting from regression of log-transformed data) reveals that gains in survival peak around 100 years of age and then rapidly decline. d, Relationship between calendar year and the age that experiences the most rapid gains in survival over the past 100 years. The age with most rapid gains has increased over the century, but its rise has been slowing and it appears to have reached a plateau.
Figure 2 ∣
Figure 2 ∣. Reported age at death of supercentenarians.
All data were collected from the IDL database (France, Japan, UK and US, 1968–2006). a, The yearly maximum reported age at death (MRAD). The lines represent the functions of linear regressions. b, The annual 1st to 5th highest reported ages at death (RAD). The dashed lines are estimates of the RAD using cubic smoothing splines. The red dots represent the MRAD. c, Annual average age at death of supercentenarians (110 years plus, n = 534). The solid line is the estimate of the annual average age at death of supercentenarians, using a cubic smoothing spline.

Comment in

Similar articles

Cited by

  • The landscape of aging.
    Cai Y, Song W, Li J, Jing Y, Liang C, Zhang L, Zhang X, Zhang W, Liu B, An Y, Li J, Tang B, Pei S, Wu X, Liu Y, Zhuang CL, Ying Y, Dou X, Chen Y, Xiao FH, Li D, Yang R, Zhao Y, Wang Y, Wang L, Li Y, Ma S, Wang S, Song X, Ren J, Zhang L, Wang J, Zhang W, Xie Z, Qu J, Wang J, Xiao Y, Tian Y, Wang G, Hu P, Ye J, Sun Y, Mao Z, Kong QP, Liu Q, Zou W, Tian XL, Xiao ZX, Liu Y, Liu JP, Song M, Han JJ, Liu GH. Cai Y, et al. Sci China Life Sci. 2022 Dec;65(12):2354-2454. doi: 10.1007/s11427-022-2161-3. Epub 2022 Sep 2. Sci China Life Sci. 2022. PMID: 36066811 Free PMC article. Review.
  • Probabilistic population forecasting: Short to very long-term.
    Raftery AE, Ševčíková H. Raftery AE, et al. Int J Forecast. 2023 Jan-Mar;39(1):73-97. doi: 10.1016/j.ijforecast.2021.09.001. Epub 2021 Oct 7. Int J Forecast. 2023. PMID: 36568848 Free PMC article.
  • Dong et al. reply.
    Dong X, Milholland B, Vijg J. Dong X, et al. Nature. 2017 Jun 28;546(7660):E12. doi: 10.1038/nature22789. Nature. 2017. PMID: 28658233 No abstract available.
  • Implausibility of radical life extension in humans in the twenty-first century.
    Olshansky SJ, Willcox BJ, Demetrius L, Beltrán-Sánchez H. Olshansky SJ, et al. Nat Aging. 2024 Nov;4(11):1635-1642. doi: 10.1038/s43587-024-00702-3. Epub 2024 Oct 7. Nat Aging. 2024. PMID: 39375565 Free PMC article.
  • Astrocytes in aging.
    Labarta-Bajo L, Allen NJ. Labarta-Bajo L, et al. Neuron. 2025 Jan 8;113(1):109-126. doi: 10.1016/j.neuron.2024.12.010. Neuron. 2025. PMID: 39788083 Review.

References

    1. Oeppen J & Vaupel JW Demography. Broken limits to life expectancy. Science 296, 1029–1031 (2002). - PubMed
    1. Vaupel JW Biodemography of human ageing. Nature 464, 536–542 (2010). - PMC - PubMed
    1. Austad SN in Molecular and Cellular Biology of Aging (eds Vijg J, Campisi J & Lithgow G) Ch. 2 (The Gerontological Society of America, 2015).
    1. Jeune B. et al. in Supercentenarians (eds Maier H et al.). (Springer, 2010).
    1. Kenyon C. The plasticity of aging: insights from long-lived mutants. Cell 120, 449–460 (2005). - PubMed