. 2016 Oct 5;14(10):e1002567.
doi: 10.1371/journal.pbio.1002567. eCollection 2016 Oct.

Large Variations in HIV-1 Viral Load Explained by Shifting-Mosaic Metapopulation Dynamics

Affiliations

Large Variations in HIV-1 Viral Load Explained by Shifting-Mosaic Metapopulation Dynamics

Katrina A Lythgoe et al. PLoS Biol. .

Abstract

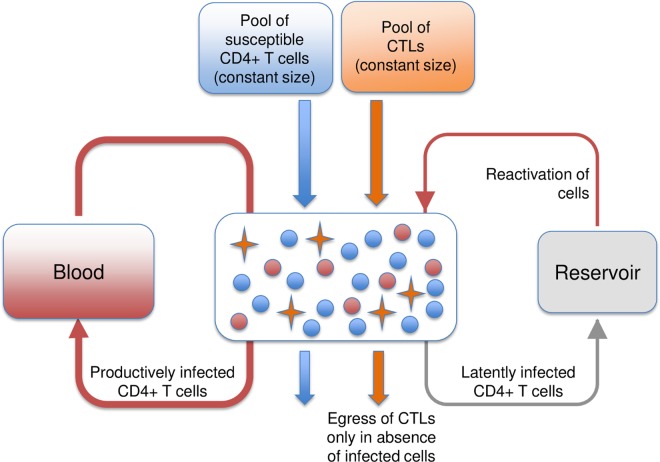
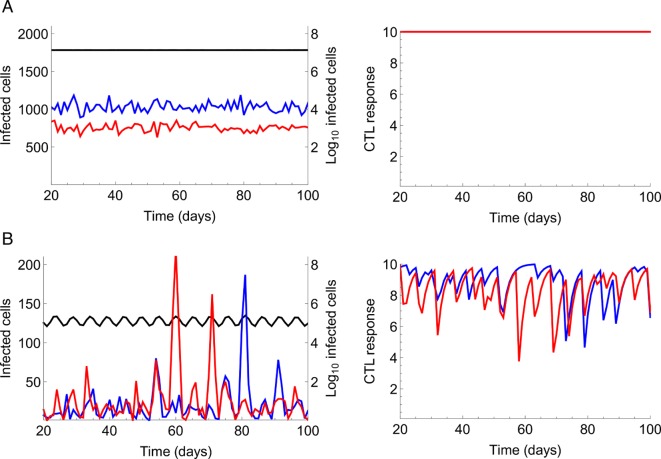
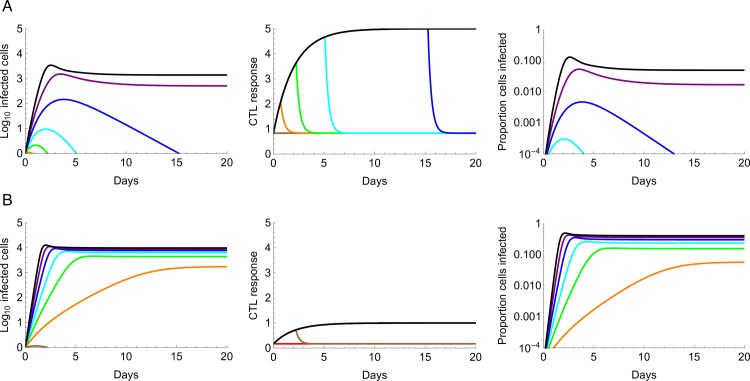
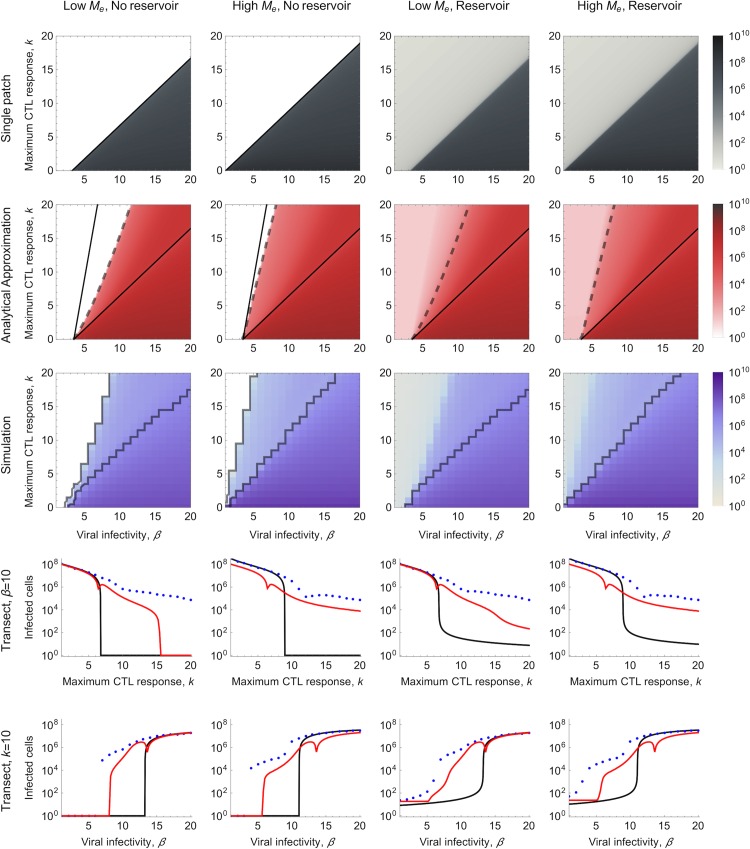
The viral population of HIV-1, like many pathogens that cause systemic infection, is structured and differentiated within the body. The dynamics of cellular immune trafficking through the blood and within compartments of the body has also received wide attention. Despite these advances, mathematical models, which are widely used to interpret and predict viral and immune dynamics in infection, typically treat the infected host as a well-mixed homogeneous environment. Here, we present mathematical, analytical, and computational results that demonstrate that consideration of the spatial structure of the viral population within the host radically alters predictions of previous models. We study the dynamics of virus replication and cytotoxic T lymphocytes (CTLs) within a metapopulation of spatially segregated patches, representing T cell areas connected by circulating blood and lymph. The dynamics of the system depend critically on the interaction between CTLs and infected cells at the within-patch level. We show that for a wide range of parameters, the system admits an unexpected outcome called the shifting-mosaic steady state. In this state, the whole body's viral population is stable over time, but the equilibrium results from an underlying, highly dynamic process of local infection and clearance within T-cell centers. Notably, and in contrast to previous models, this new model can explain the large differences in set-point viral load (SPVL) observed between patients and their distribution, as well as the relatively low proportion of cells infected at any one time, and alters the predicted determinants of viral load variation.


Conflict of interest statement

The authors have declared that no competing interests exist.

Figures

Fig 1
Fig 1. The trafficking of lymphocytes through a patch.
Susceptible CD4+ T cells, infected CD4+ T cells, and cytotoxic T lymphocyte (CTL) cells continually traffic through the patches in the metapopulation. We assume a constant input of susceptible cells and HIV-specific CTLs from the blood into the patches and therefore that CD4+ T cell production and CTL production are able to compensate for any losses. In contrast, the inflow of infected cells into a patch is directly proportional to the total number of infected cells in the blood plus, if present, the number of latently infected resting CD4+ T cells in the reservoir; immediately after being infected by the virus, a small proportion of CD4+ T cells enter into a resting state, thus becoming part of the reservoir, and reenter general circulation when reactivated [34,35]. Since little is known about the trafficking of latently infected resting CD4+ T cells, upon reactivation, we make the simplifying assumption that these cells directly enter patches. Infected and susceptible CD4+ T cells exit patches at the same per capita rate, as do CTLs in the absence of infected cells. However, if infected CD4+ T cells are present, egress of HIV-specific CTLs (but not other CTLs) is prevented, resulting in their gradual accumulation due to the continued immigration of CTLs from the blood. As HIV-specific CTLs accumulate, the rate at which infected cells are killed due to the CTL response increases, and if this rate of killing is sufficiently high, infected cells will eventually be eliminated from the patch and, subsequently, egress of HIV-specific CTLs from the patch will resume. Blue circles represent susceptible cells, orange stars represent HIV-specific CTLs, and red circles represent infected cells.
Fig 2
Fig 2. Examples of simulation dynamics.
(A) Full equilibrium (FE). (B) Shifting mosaic steady state (SMSS). A total of 10,000 patches were simulated, with the left panel showing the number of infected cells in two of these patches (red and blue lines, left-axis) and the total number of infected cells in the whole metapopulation, summed over all the patches and the blood, but not the reservoir (black line, right-axis; note this is on a Log10 scale). The right panel shows the CTL response, measured as the rate at which CTLs kill infected cells in each of these two patches, which is proportional to the number of CTLs in the patches. (A) Viral infectivity, β¯ = 13 per day, maximum strength of the CTL response, k = 10 per day. (B) β¯ = 8 per day, k = 10 per day. We assumed a high effective migration rate (Me = 2.4 per day). The simulation was initiated with 108 infected cells randomly distributed among the patches and no reservoir. See Table 1 for all other parameters.
Fig 3
Fig 3. Examples of within-patch dynamics for a single colonization event used for the analytical approximation.
(A) Maximum strength of the CTL response, k = 5 per day. For high levels of viral infectivity β = 9, 10 per day (purple and black lines, respectively), an initial burst of infection is followed by a long-term endemic state. The CTL response is the rate at which CTLs kill infected cells, which is proportional to the number of HIV-specific CTLs in the patch. This increases due to the prevention of egress of HIV-specific CTLs, but even when the maximum rate of CTL killing, k, is reached, this is not sufficient to clear the infected cells from the patch. Even though levels of viral infectivity are high, only a small proportion of cells are infected. For moderate levels of infectivity, β = 5, 6, 7, 8 per day (orange, green, cyan, and blue lines, respectively), an initial burst of infection also occurs, accompanied by an increase in the strength of the CTL response. Eventually, the rate of CTL killing becomes sufficiently high to eliminate the infected cells from the patch, and subsequently the HIV-specific CTLs egress from the patch. For lower levels of infectivity, bursts of infection fail to establish. (B) Maximum strength of the CTL response, k = 1 per day. For moderate and high levels of viral infectivity (β = 5, 6, 7, 8, 9, 10 per day), an endemic state is now reached, and a much higher proportion of cells are infected compared to when k = 5 per day. Equations describing the within-patch dynamics are found in S1 Text, and model parameters are as described in Table 1.
Fig 4
Fig 4. Total number of infected cells for varying viral infectivity, β, and maximum CTL response, k.
The density plots in the top three rows show the number of infected cells at stationary state for different β and k (note that in the simulations, mean viral infectivity varies across patches, and therefore mean viral infectivity β¯=β is plotted). Results are shown without and with a reservoir included in the model, and for a low effective migration rate (Me = 0.25 per day, δB = 432 per day) and a high effective migration rates (Me = 2.4 per day, δB = 1 per day). For the single patch model, the black line shows the extinction threshold above which the viral population cannot be sustained in the absence of a reservoir. For the analytical approximation, the area between the solid black lines shows where introduction of infection in an uncolonised patch is followed by a within-patch burst, and the dashed line indicates where the patch reproduction number RP = 1, thus distinguishing whether, in the absence of a reservoir, the virus goes extinct or an SMSS can be sustained. To the right of the SMSS region, a full equilibrium (FE) is predicted, and to the left, a trivial equilibrium exists. The areas in white are those where no infected cells are present. For the simulation, the area between the black solid lines shows where an SMSS is observed, defined as where both the viral population has not gone extinct and the mean CTL response across all patches is less than 99% of the maximum CTL response. The bottom two rows are transects across the density plots shown above them, with either viral infectivity held constant (β = 10 per day) or the maximum strength of the CTL response held constant (k = 10 per day). Single patch model, grey-scale gradient and back transect line; analytical approximation of the metapopulation model, red-scale gradient and red transect line; simulation of the metapopulation model, blue-scale gradient and blue transect dots. All other parameters are as described in Table 1.
Fig 5
Fig 5. Predicted distributions of set-point viral load (SPVL) among a cohort of patients.
(A) Histogram of the observed frequencies of SPVL among seroconverters in the Netherlands (S1 Table). Because of differences in the sensitivities of viral load tests, we pooled all individuals with a viral load less than 103 per ml. (B) Maximum log-likelihood distribution of SPVLs for the single patch model given the Netherlands seroconverter data, with log L(μβ=14,σβ=4,μk=15,σk=3|Data) = -5386. (C) Maximum log-likelihood distribution of SPVLs for the 10,000 patch metapopulation model given the Netherlands seroconverter data, with log L(μβ=14,σβ=4,μk=15,σk=3|Data) = -4,013. For (B) and (C), viral infectivity, β, and the maximum CTL immune response, k, are assumed to be distributed according to truncated normal distributions, with probability density functions f (β; μβ,σβ,βmin,βmax) and f (k; μk,σk,kmin,kmax), respectively, where βmin = 1.05 per day, kmin = 0 per day, and βmax = kmax = 20 per day (see S1 Text). For both the metapopulation and single patch models, a viral reservoir is assumed to be present and the effective migration rate is assumed to be high (Me = 2.4 per day). All other parameters are as described in Table 1.

Similar articles

Cited by

References

    1. Bormann FH, Likens GE. Pattern and process in a forested ecosystem: disturbance, development and the steady state based on the Hubbard Brook ecosystem NY Springer. New York: Springer-Verlag; 1979.
    1. Chambers JQ, Negron-Juarez RI, Marra DM, Di Vittorio A, Tews J, Roberts D, et al. The steady-state mosaic of disturbance and succession across an old-growth Central Amazon forest landscape. Proc Natl Acad Sci U S A. 2013;110: 3949–3954. 10.1073/pnas.1202894110 - DOI - PMC - PubMed
    1. Fraser C, Hollingsworth TD, Chapman R, de Wolf F, Hanage WP. Variation in HIV-1 set-point viral load: Epidemiological analysis and an evolutionary hypothesis. Proc Natl Acad Sci U S A. 2007;104: 17441–6. 10.1073/pnas.0708559104 - DOI - PMC - PubMed
    1. de Wolf F, Spijkerman I, Schellekens PT, Langendam M, Kuiken C, Bakker M, et al. AIDS prognosis based on HIV-1 RNA, CD4+ T-cell count and function: markers with reciprocal predictive value over time after seroconversion. AIDS. 1997;11: 1799–1806. - PubMed
    1. Mellors JW, Rinaldo CR, Gupta P, White RM, Todd JA, Kingsley LA. Prognosis in HIV-1 infection predicted by the quantity of virus in plasma. Science. 1996;272: 1167–1170. 10.1126/science.272.5265.1167 - DOI - PubMed