

A Citizen Science Approach: A Detailed Ecological Assessment of Subtropical Reefs at Point Lookout, Australia
- PMID: 27706182
- PMCID: PMC5051685
- DOI: 10.1371/journal.pone.0163407
A Citizen Science Approach: A Detailed Ecological Assessment of Subtropical Reefs at Point Lookout, Australia
Abstract
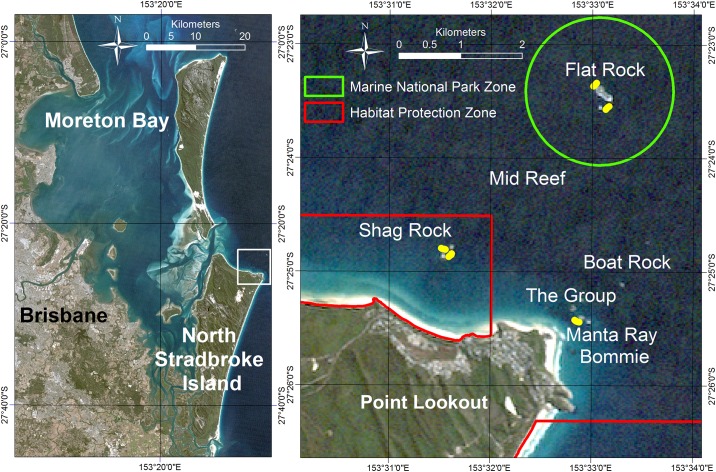
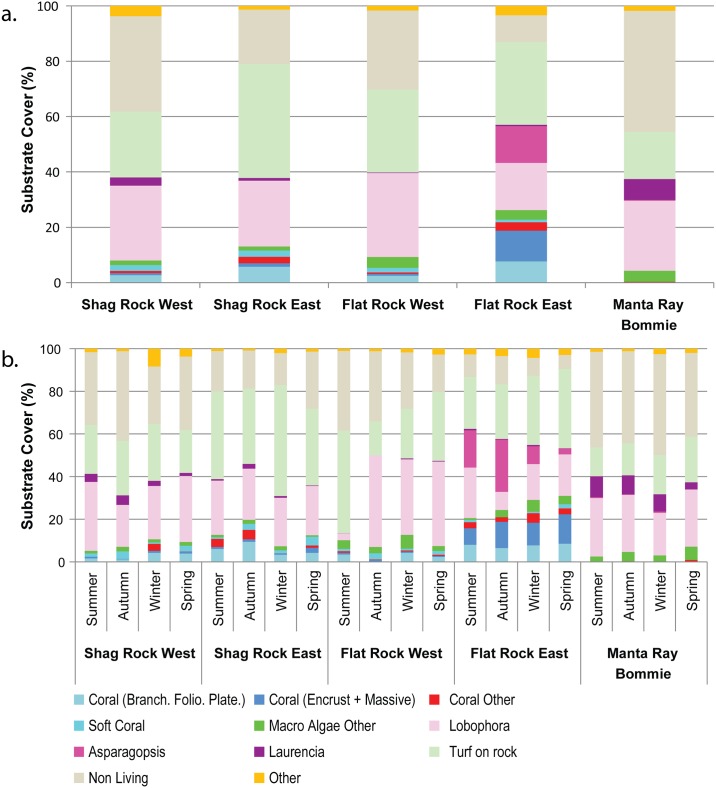
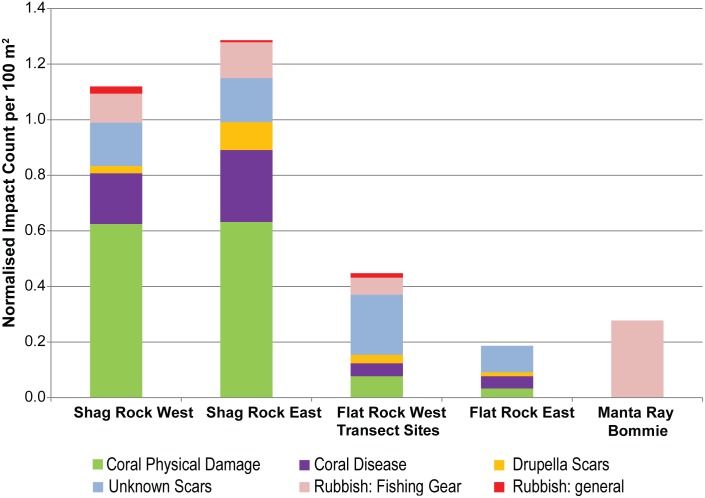
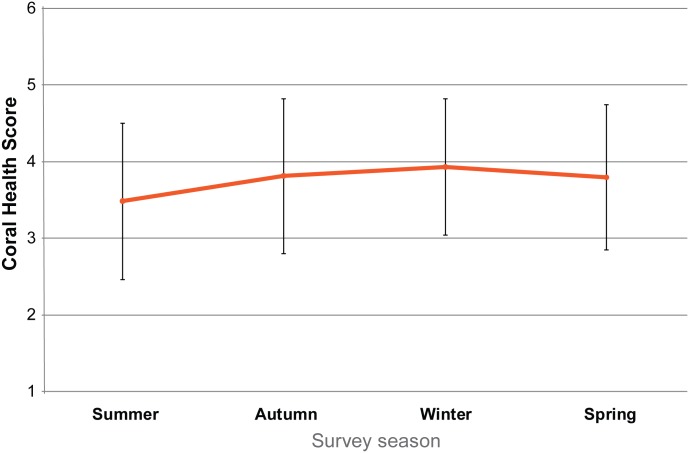
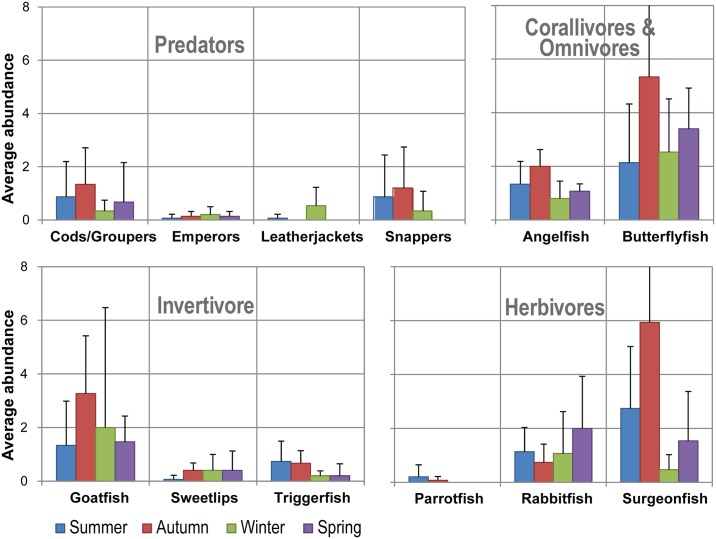
Subtropical reefs provide an important habitat for flora and fauna, and proper monitoring is required for conservation. Monitoring these exposed and submerged reefs is challenging and available resources are limited. Citizen science is increasing in momentum, as an applied research tool and in the variety of monitoring approaches adopted. This paper aims to demonstrate an ecological assessment and mapping approach that incorporates both top-down (volunteer marine scientists) and bottom-up (divers/community) engagement aspects of citizen science, applied at a subtropical reef at Point Lookout, Southeast Queensland, Australia. Marine scientists trained fifty citizen scientists in survey techniques that included mapping of habitat features, recording of substrate, fish and invertebrate composition, and quantifying impacts (e.g., occurrence of substrate damage, presence of litter). In 2014 these volunteers conducted four seasonal surveys along semi-permanent transects, at five sites, across three reefs. The project presented is a model on how citizen science can be conducted in a marine environment through collaboration of volunteer researchers, non-researchers and local marine authorities. Significant differences in coral and algal cover were observed among the three sites, while fluctuations in algal cover were also observed seasonally. Differences in fish assemblages were apparent among sites and seasons, with subtropical fish groups observed more commonly in colder seasons. The least physical damage occurred in the most exposed sites (Flat Rock) within the highly protected marine park zones. The broad range of data collected through this top-down/bottom-up approach to citizen science exemplifies the projects' value and application for identifying ecosystem trends or patterns. The results of the project support natural resource and marine park management, providing a valuable contribution to existing scientific knowledge and the conservation of local reefs.
Conflict of interest statement
The authors have declared that no competing interests exist.
Figures
References
-
- Beger M, Sommer B, Harrison PL, Smith SDA, Pandolfi JM. Conserving potential coral reef refuges at high latitudes. Divers Distrib. 2014;20(3):245–57. WOS:000331334100001.
-
- Pandolfi JM, Bradbury RH, Sala E, Hughes TP, Bjorndal KA, Cooke RG, et al. Global trajectories of the long-term decline of coral reef ecosystems. Science. 2003;301(5635):955–8. ISI:000184755900036. - PubMed
-
- Hill J, Wilkinson C. Methods for ecological monitoring of coral reefs Version 1: A resource for managers. 1 ed Townsville: Australian Institute of Marine Science and Reef Check; 2004. 117 p.
MeSH terms
LinkOut - more resources
Full Text Sources
Other Literature Sources
