

Thermal Preference Ranges Correlate with Stable Signals of Universal Stress Markers in Lake Baikal Endemic and Holarctic Amphipods
- PMID: 27706227
- PMCID: PMC5051968
- DOI: 10.1371/journal.pone.0164226
Thermal Preference Ranges Correlate with Stable Signals of Universal Stress Markers in Lake Baikal Endemic and Holarctic Amphipods
Abstract
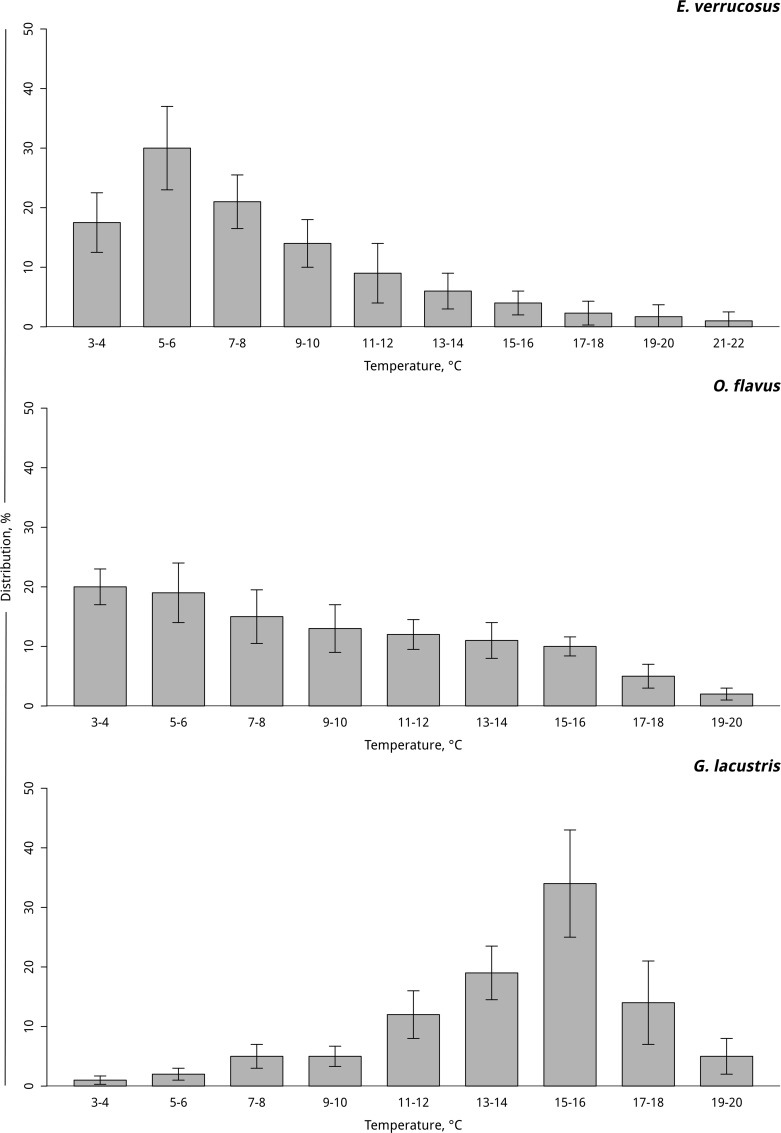
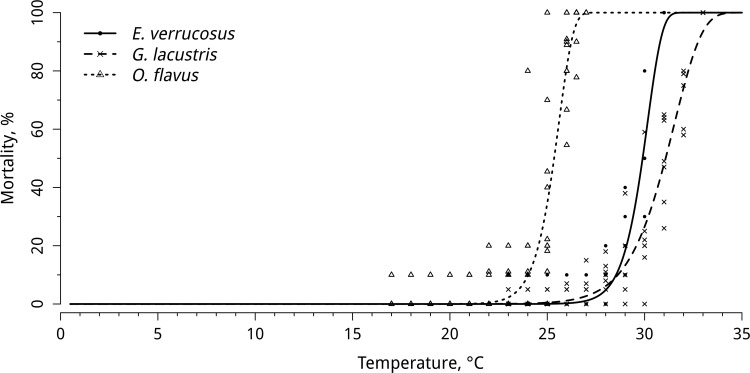
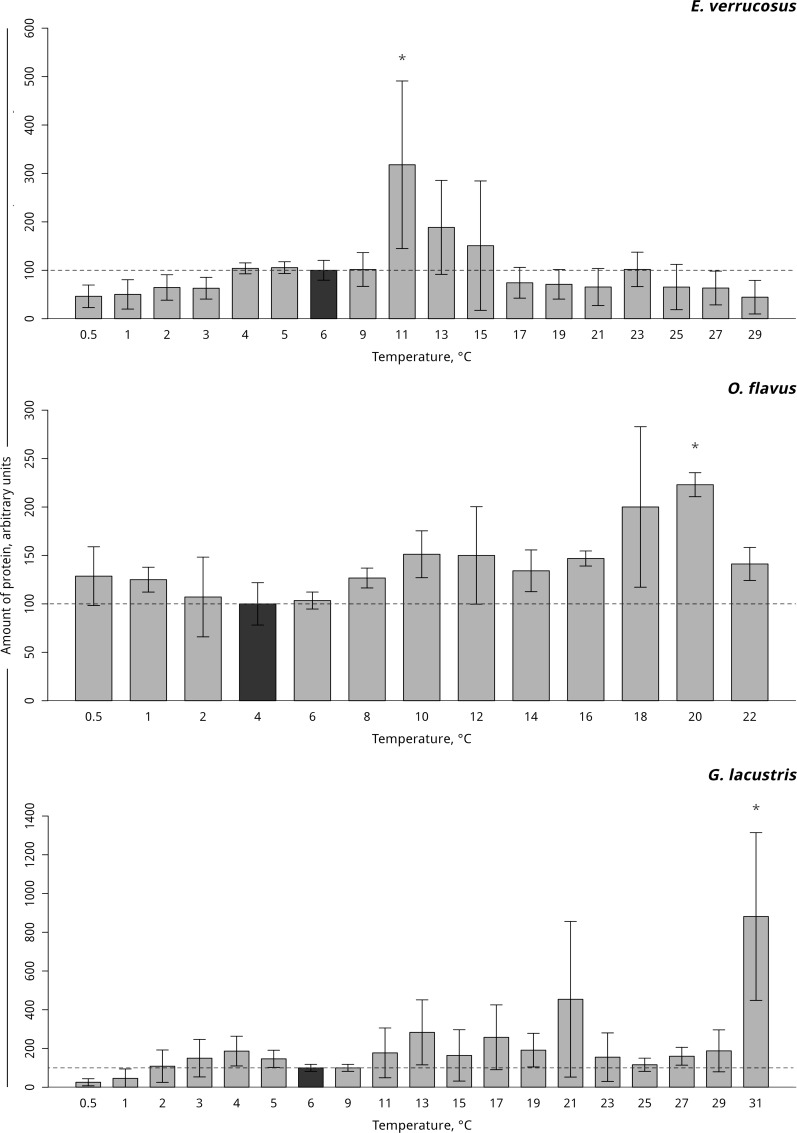
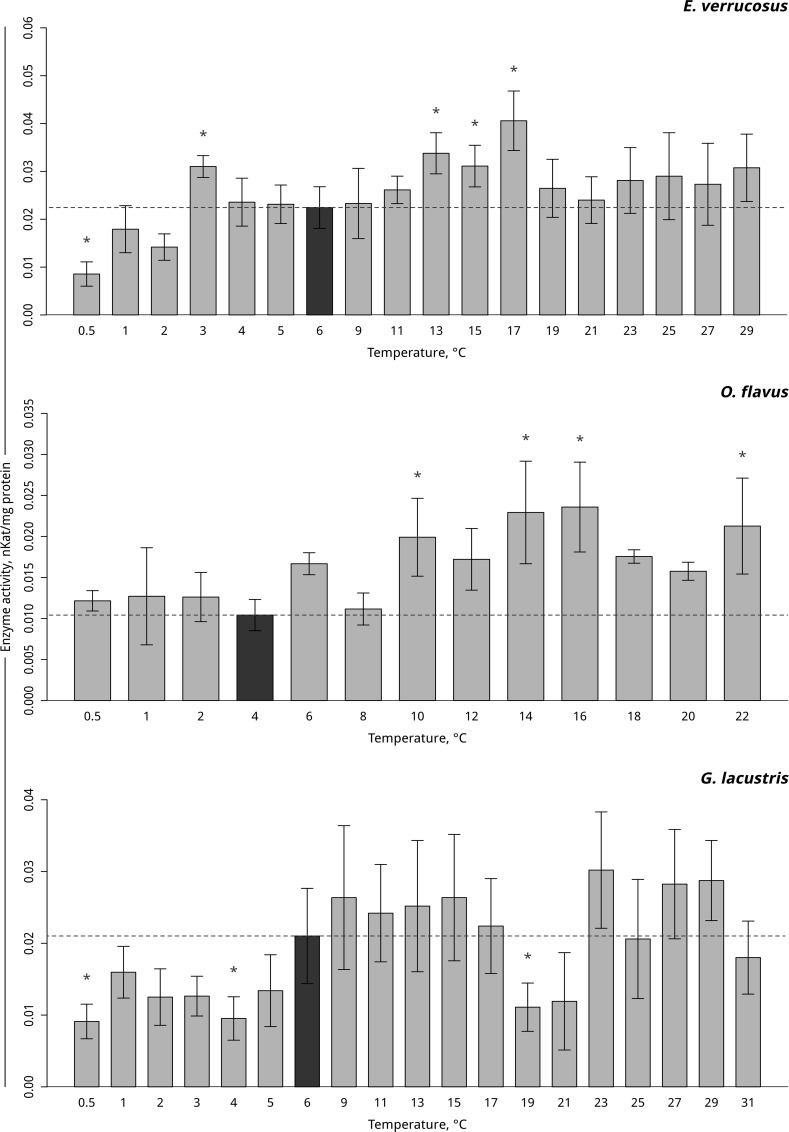
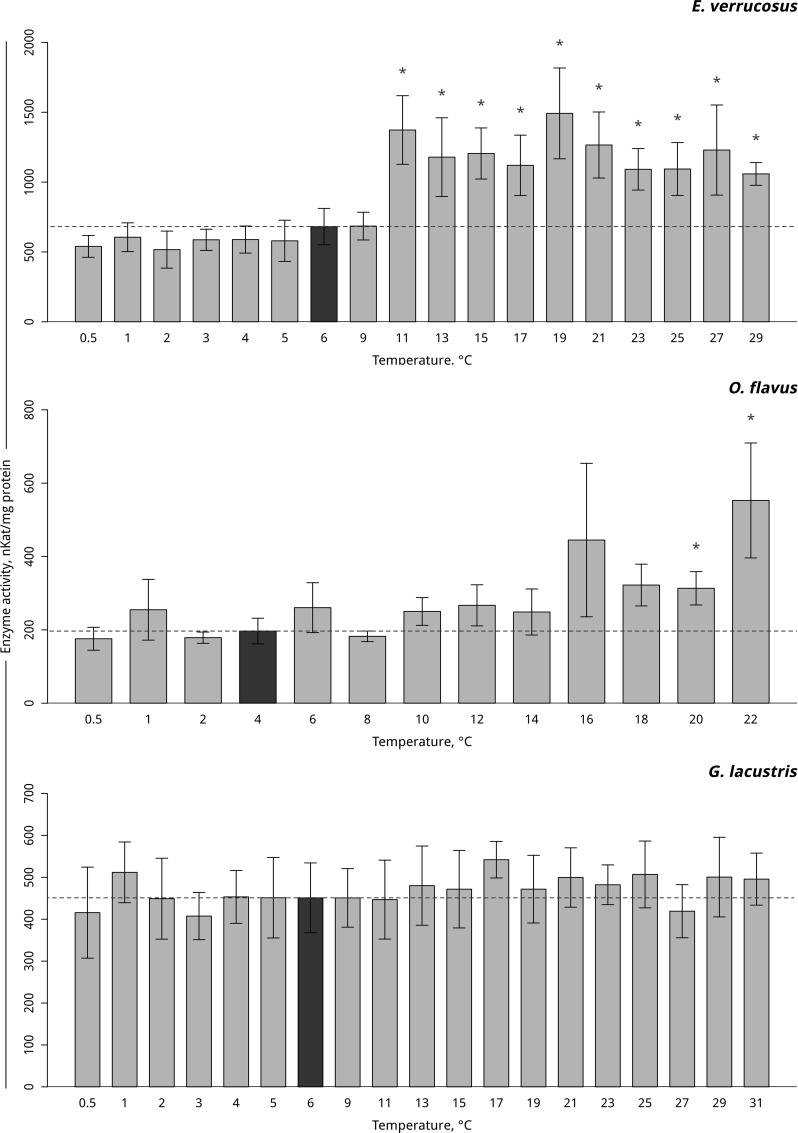
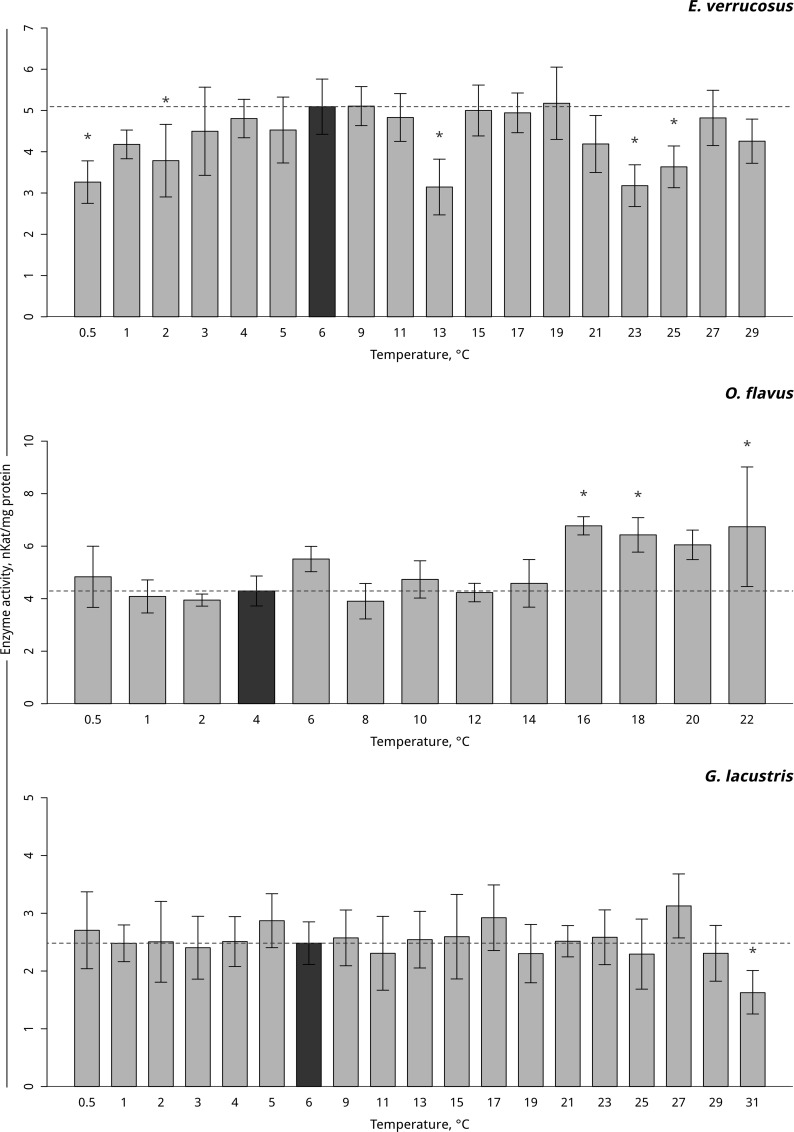
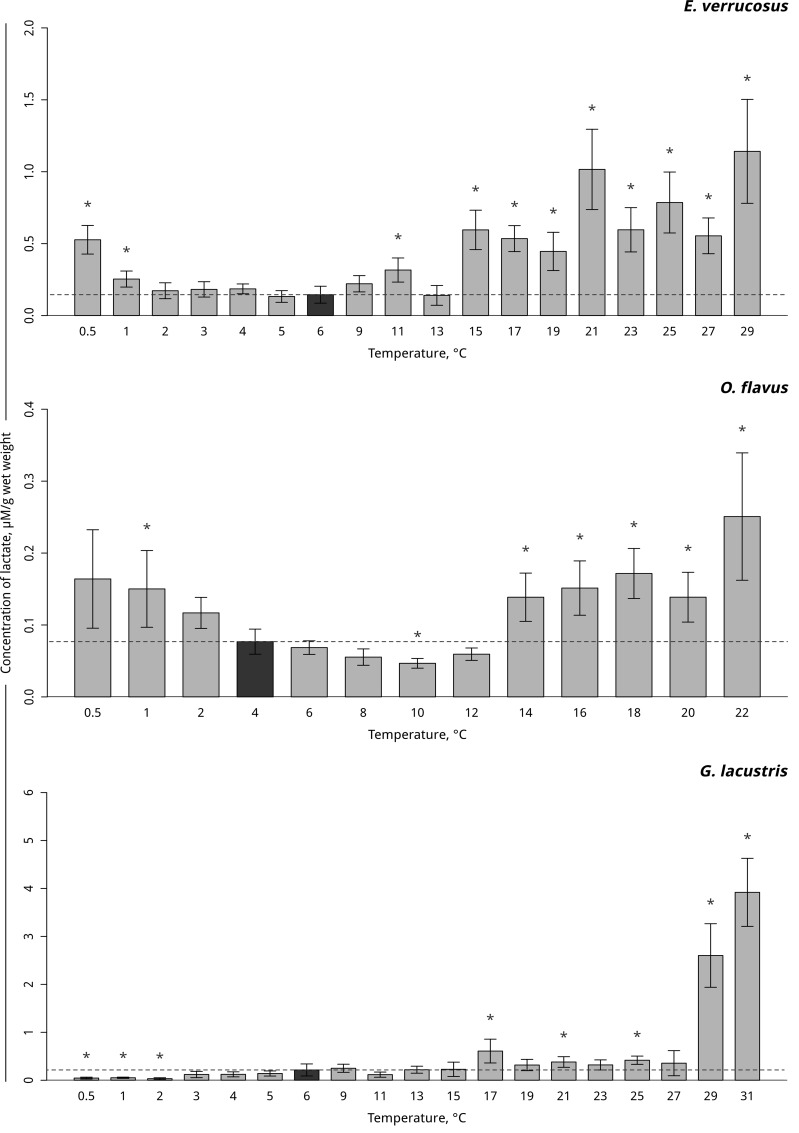
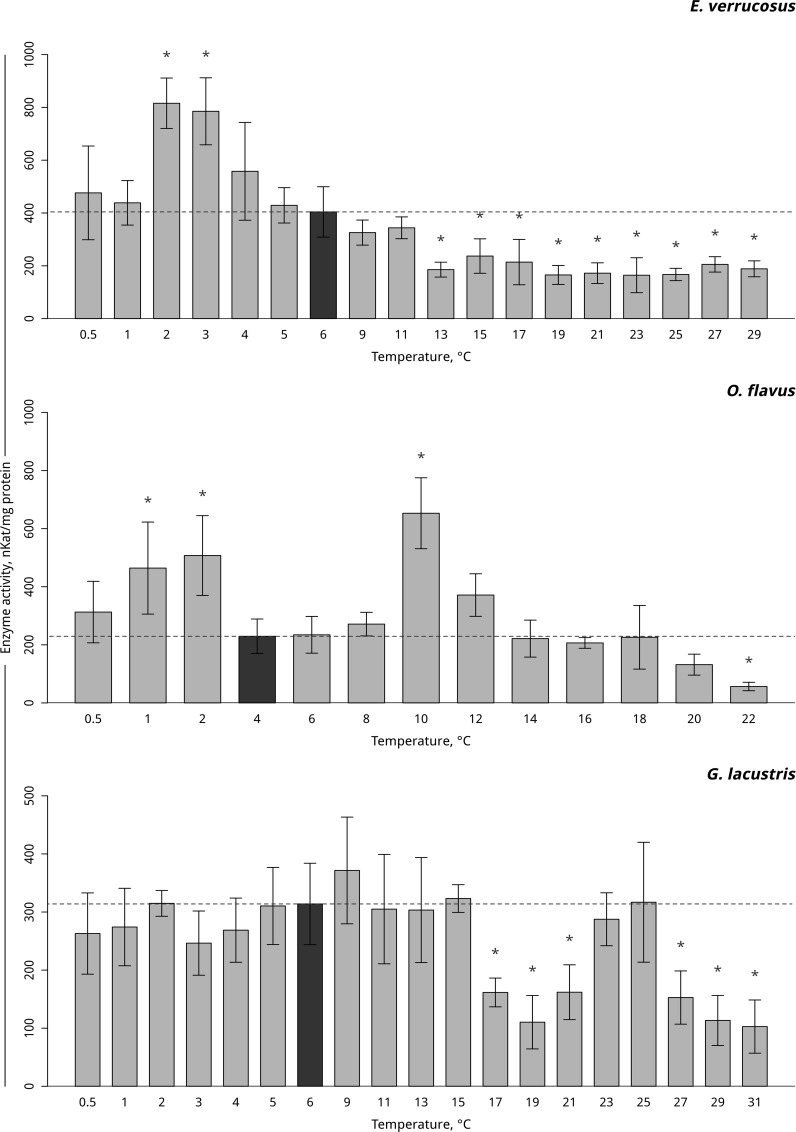
Temperature is the most pervasive abiotic environmental factor for aquatic organisms. Fluctuations in temperature range lead to changes in metabolic performance. Here, we aimed to identify whether surpassing the thermal preference zones is correlated with shifts in universal cellular stress markers of protein integrity, responses to oxidative stress and lactate content, as indicators of anaerobic metabolism. Exposure of the Lake Baikal endemic amphipod species Eulimnogammarus verrucosus (Gerstfeldt, 1858), Ommatogammarus flavus (Dybowski, 1874) and of the Holarctic amphipod Gammarus lacustris Sars 1863 (Amphipoda, Crustacea) to increasing temperatures resulted in elevated heat shock protein 70 (Hsp70) and lactate content, elevated antioxidant enzyme activities (i.e., catalase and peroxidase), and reduced lactate dehydrogenase and glutathione S-transferase activities. Thus, the zone of stability (absence of any significant changes) of the studied molecular and biochemical markers correlated with the behaviorally preferred temperatures. We conclude that the thermal behavioral responses of the studied amphipods are directly related to metabolic processes at the cellular level. Thus, the determined thermal ranges may possibly correspond to the thermal optima. This relationship between species-specific behavioral reactions and stress response metabolism may have significant ecological consequences that result in a thermal zone-specific distribution (i.e., depths, feed spectrum, etc.) of species. As a consequence, by separating species with different temperature preferences, interspecific competition is reduced, which, in turn, increases a species' Darwinian fitness in its environment.
Conflict of interest statement
The authors declare no competing financial interests.
Figures
Similar articles
-
Comparison between transcriptomic responses to short-term stress exposures of a common Holarctic and endemic Lake Baikal amphipods.BMC Genomics. 2019 Sep 13;20(1):712. doi: 10.1186/s12864-019-6024-3. BMC Genomics. 2019. PMID: 31519144 Free PMC article.
-
Low annual temperature likely prevents the Holarctic amphipod Gammarus lacustris from invading Lake Baikal.Sci Rep. 2021 May 18;11(1):10532. doi: 10.1038/s41598-021-89581-x. Sci Rep. 2021. PMID: 34006866 Free PMC article.
-
Identification of a putatively multixenobiotic resistance related Abcb1 transporter in amphipod species endemic to the highly pristine Lake Baikal.Environ Sci Pollut Res Int. 2015 Apr;22(7):5453-68. doi: 10.1007/s11356-014-3758-y. Epub 2014 Nov 5. Environ Sci Pollut Res Int. 2015. PMID: 25367643
-
Contrasting cellular stress responses of Baikalian and Palearctic amphipods upon exposure to humic substances: environmental implications.Environ Sci Pollut Res Int. 2014 Dec;21(24):14124-37. doi: 10.1007/s11356-014-3323-8. Epub 2014 Jul 23. Environ Sci Pollut Res Int. 2014. PMID: 25053285
-
Variation in the heat shock response and its implication for predicting the effect of global climate change on species' biogeographical distribution ranges and metabolic costs.J Exp Biol. 2010 Mar 15;213(6):971-9. doi: 10.1242/jeb.038034. J Exp Biol. 2010. PMID: 20190122 Review.
Cited by
-
Application of PEG-Covered Non-Biodegradable Polyelectrolyte Microcapsules in the Crustacean Circulatory System on the Example of the Amphipod Eulimnogammarus verrucosus.Polymers (Basel). 2019 Jul 27;11(8):1246. doi: 10.3390/polym11081246. Polymers (Basel). 2019. PMID: 31357585 Free PMC article.
-
Comparison between transcriptomic responses to short-term stress exposures of a common Holarctic and endemic Lake Baikal amphipods.BMC Genomics. 2019 Sep 13;20(1):712. doi: 10.1186/s12864-019-6024-3. BMC Genomics. 2019. PMID: 31519144 Free PMC article.
-
Thermal reaction norms of key metabolic enzymes reflect divergent physiological and behavioral adaptations of closely related amphipod species.Sci Rep. 2021 Feb 25;11(1):4562. doi: 10.1038/s41598-021-83748-2. Sci Rep. 2021. PMID: 33633174 Free PMC article.
-
Nonspecific stress response to temperature increase in Gammarus lacustris Sars with respect to oxygen-limited thermal tolerance concept.PeerJ. 2018 Sep 17;6:e5571. doi: 10.7717/peerj.5571. eCollection 2018. PeerJ. 2018. PMID: 30245929 Free PMC article.
-
Microencapsulated fluorescent pH probe as implantable sensor for monitoring the physiological state of fish embryos.PLoS One. 2017 Oct 18;12(10):e0186548. doi: 10.1371/journal.pone.0186548. eCollection 2017. PLoS One. 2017. PMID: 29045437 Free PMC article.
References
-
- Gonçalves RJ, Sol Souza M, Aigo J, Modenutti B, Balseiro E, Villafañe VE, et al. Responses of plankton and fish from temperate zones to UVR and temperature in a context of global change. Ecol Austral. 2010;20: 129–153.
-
- Alabaster JS, Lloyd. RS. Water quality criteria for freshwater fish Elsevier; 2013.
-
- Hochachka PW, Somero GN. Biochemical adaptation Princeton University Press; 2014.
MeSH terms
Substances
LinkOut - more resources
Full Text Sources
Other Literature Sources
Research Materials
Miscellaneous
