. 2016 Oct 5;11(10):e0164131.
doi: 10.1371/journal.pone.0164131. eCollection 2016.

Augmented Growth Hormone Secretion and Stat3 Phosphorylation in an Aryl Hydrocarbon Receptor Interacting Protein (AIP)-Disrupted Somatotroph Cell Line

Affiliations

Augmented Growth Hormone Secretion and Stat3 Phosphorylation in an Aryl Hydrocarbon Receptor Interacting Protein (AIP)-Disrupted Somatotroph Cell Line

Takashi Fukuda et al. PLoS One. .

Abstract

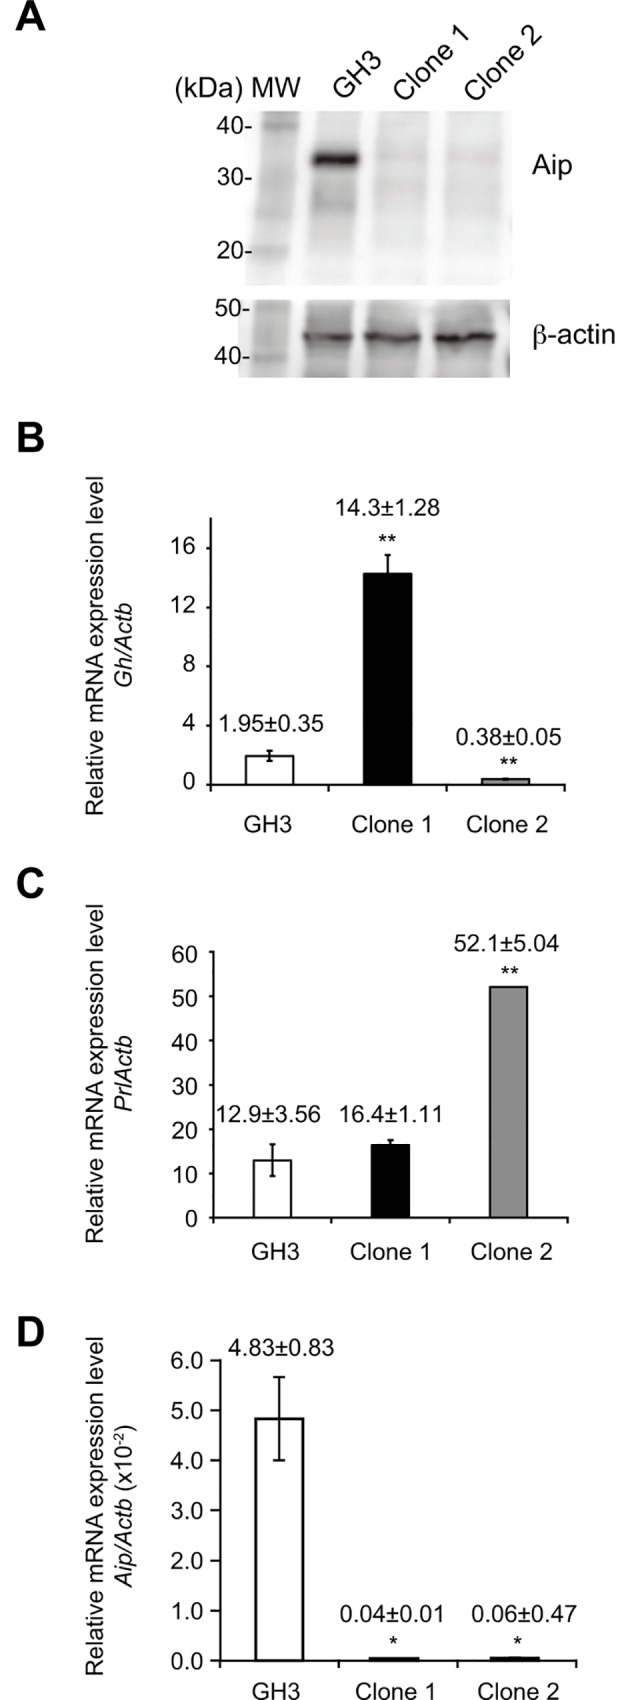
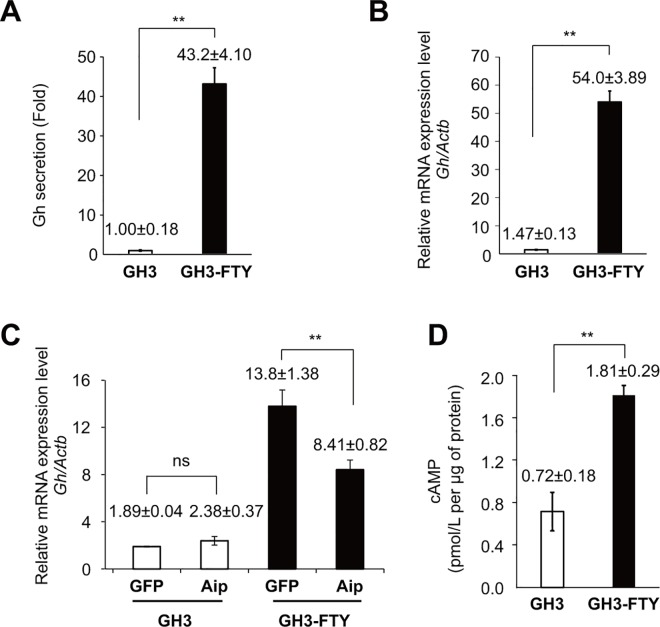
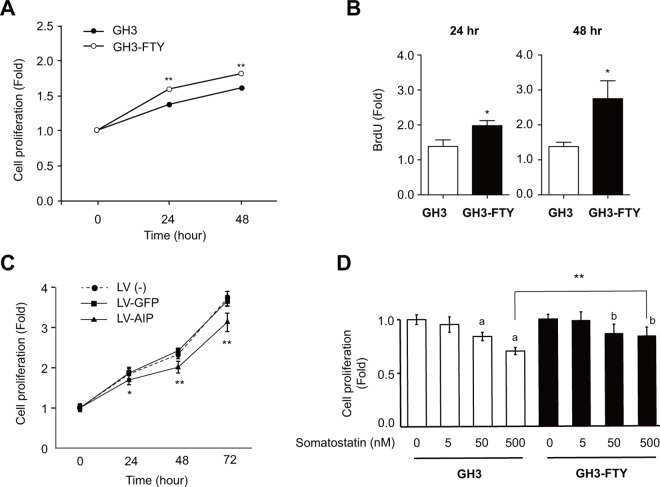
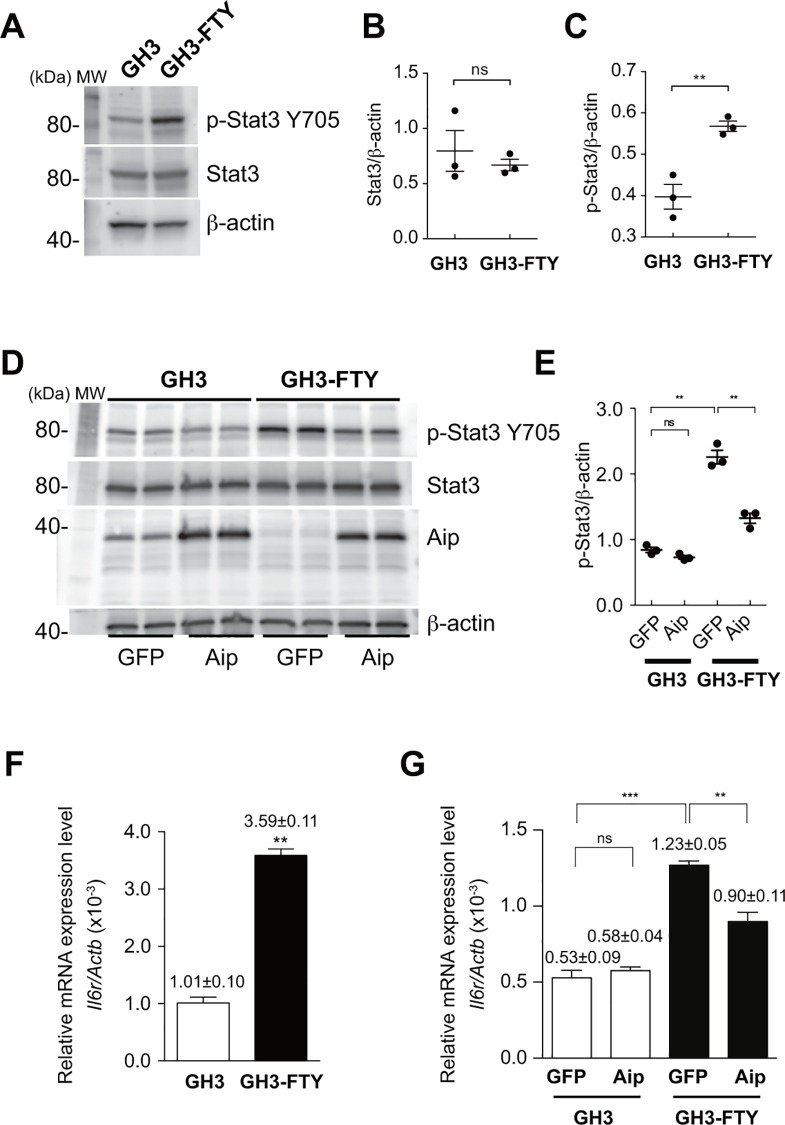
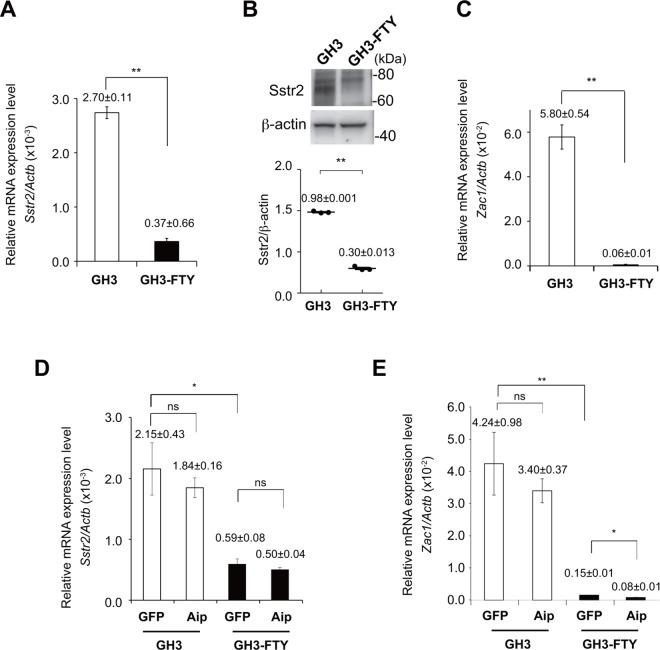
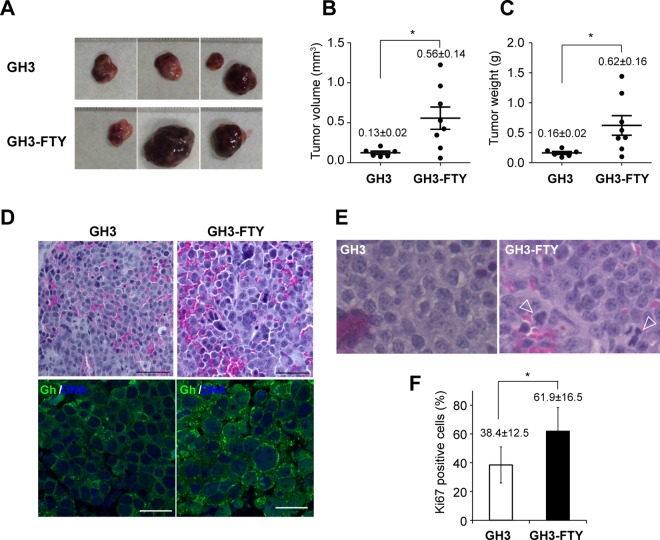
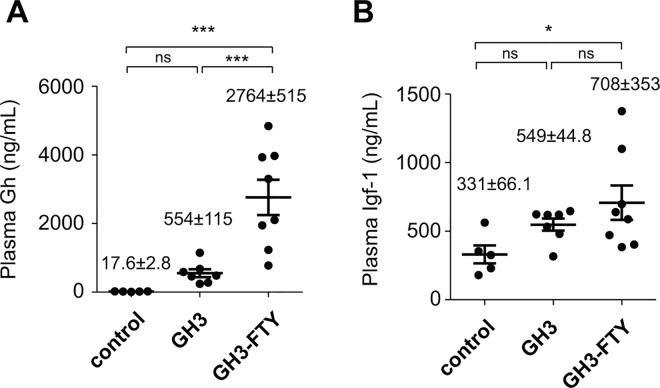
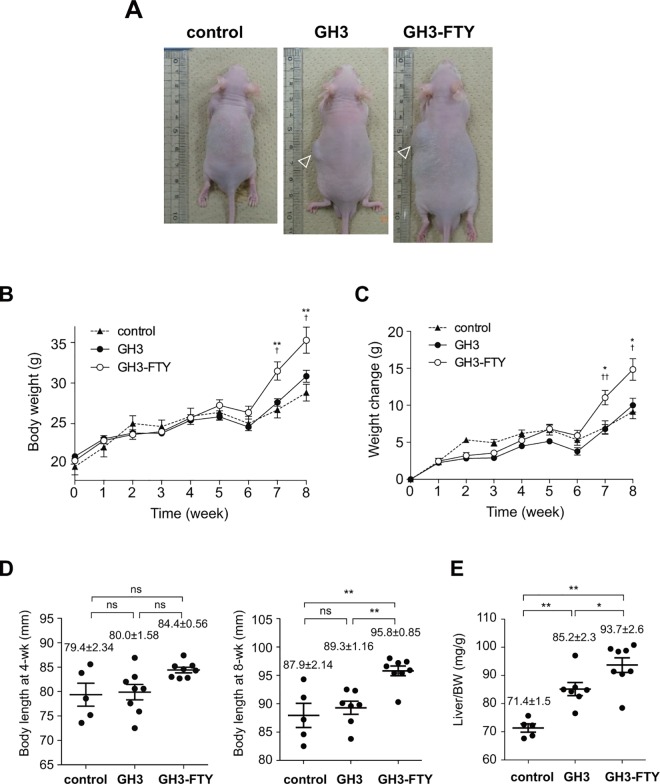
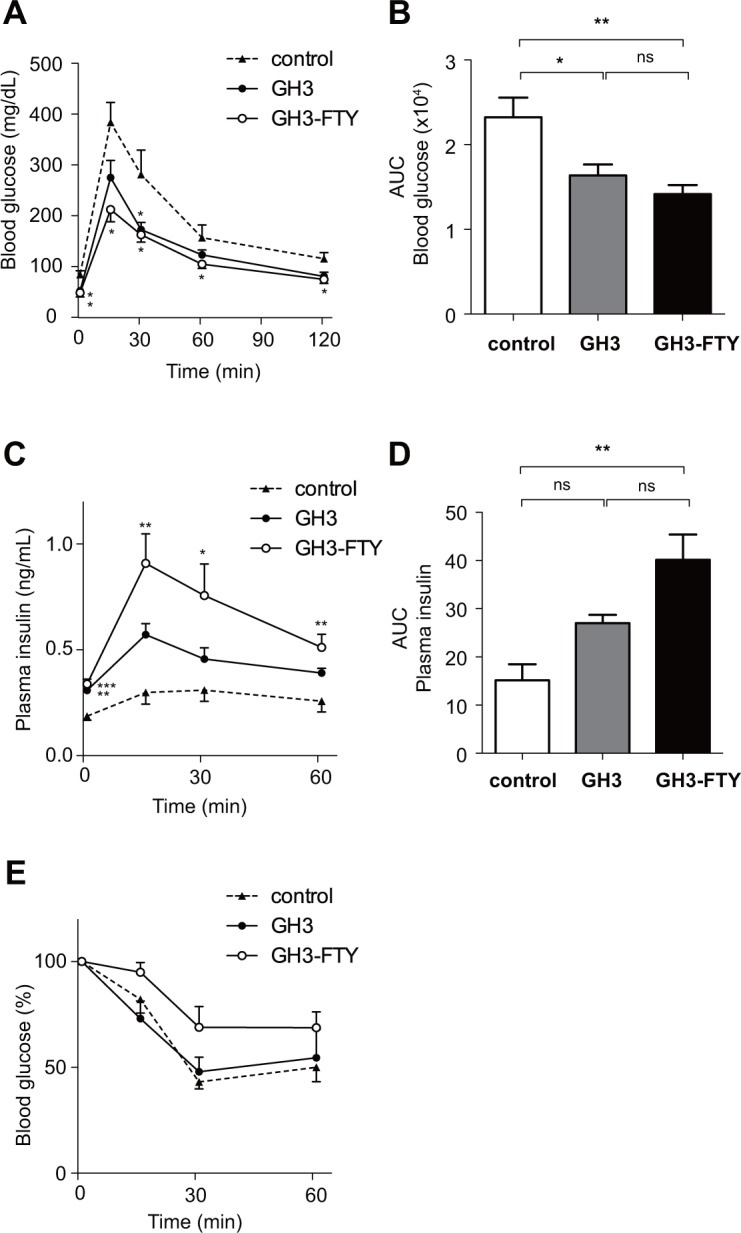
Aryl hydrocarbon receptor interacting protein (AIP) is thought to be a tumor suppressor gene, as indicated by a mutational analysis of pituitary somatotroph adenomas. However, the physiological significance of AIP inactivation in somatotroph cells remains unclear. Using CRISPR/Cas9, we identified a GH3 cell clone (termed GH3-FTY) in which Aip was genetically disrupted, and subsequently investigated its character with respect to growth hormone (Gh) synthesis and proliferation. Compared with GH3, GH3-FTY cells showed remarkably increased Gh production and a slight increase in cell proliferation. Gh-induced Stat3 phosphorylation is known to be a mechanism of Gh oversecretion in GH3. Interestingly, phosphorylated-Stat3 expression in GH3-FTY cells was increased more compared with GH3 cells, suggesting a stronger drive for this mechanism in GH3-FTY. The phenotypes of GH3-FTY concerning Gh overproduction, cell proliferation, and increased Stat3 phosphorylation were significantly reversed by the exogenous expression of Aip. GH3-FTY cells were less sensitive to somatostatin than GH3 cells in the suppression of cell proliferation, which might be associated with the reduced expression of somatostatin receptor type 2. GH3-FTY xenografts in BALB/c nude mice (GH3-FTY mice) formed more mitotic somatotroph tumors than GH3 xenografts (GH3 mice), as also evidenced by increased Ki67 scores. GH3-FTY mice were also much larger and had significantly higher plasma Gh levels than GH3 mice. Furthermore, GH3-FTY mice showed relative insulin resistance compared with GH3 mice. In conclusion, we established a somatotroph cell line, GH3-FTY, which possessed prominent Gh secretion and mitotic features associated with the disruption of Aip.


Conflict of interest statement

TT, TN and YT belonged to the Department of Bioregulatory Science of Life-related Diseases of Fukuoka University (Fukuoka, Japan) which was supported financially by a donation from MSD K. K. This does not alter our adherence to PLOS ONE policies on sharing data and materials.

Figures

Fig 1
Fig 1. Screening of Aip-disrupted GH3 clones generated by CRISPR/Cas9.
The detailed mutations of clones 1 and 2 are described in the Results section and S1 Fig. Clone 1 corresponds to GH3-FTY cells intensively investigated in the present study. (A) Western blot analysis of Aip protein in GH3 and mutant GH3 clones (clones 1 and 2). Fifteen μg of protein from cell lysates was subjected to SDS-PAGE and immunoblotted with antibodies against Aip and beta-actin. Each target protein was visualized using VersaDoc 5000 (BIO-RAD, Tokyo, Japan). (B, C) The relative expression of Gh mRNA and Prl mRNA to Actb mRNA is shown, respectively. Data were compared using the unpaired two-tailed t-test. **P<0.01 (clone 1 or 2) vs GH3. (D) The relative expression of Aip mRNA to Actb mRNA in cultured clone 1 (GH3-FTY cells) and clone 2 is shown. Data were compared using the unpaired two-tailed t-test. * P<0.05 (clone 1 or 2) vs GH3.
Fig 2
Fig 2. Gh secretion in the cultured medium, Gh mRNA levels before and after exogenous Aip expression, and intracellular cAMP content in cultured GH3 and GH3-FTY cells.
(A) Gh secretion in the media from cultured GH3 and GH3-FTY cells was measured and expressed as a fold increase. (B) Gh mRNA levels in cultured GH3 and GH3-GTY cells were calculated relative to Actb (internal control) using the ∆Ct method. (C) The effect of lentivirus (LV)-mediated forced expression of exogenous gfp as a control or Aip on Gh mRNA levels. GFP and Aip indicate LV-GFP and LV-Aip, respectively. (D) The intracellular cAMP content of both cultured cells was measured as described in the Methods. Data were compared using the unpaired two-tailed t-test. **P<0.01. ns, not significant.
Fig 3
Fig 3. Proliferation of GH3-FTY versus GH3 cells.
(A) The numbers of cultured GH3 and GH3-FTY cells at 24 h and 48 h were compared by the cell counting kit. The value at each time point was calibrated by the cell numbers at the start of the experiment (0 h). Data were compared using the unpaired two-tailed t-test. *P<0.05. ns, not significant. (B) BrdU assay at 24 h and 48 h. Data were compared using the unpaired two-tailed t-test. *P<0.05. (C) Effect of lentivirus (LV)-mediated forced expression of exogenous Aip (LV-AIP) or gfp (LV-GFP) as a control on the proliferation of cultured GH3-FTY cells. LV (-) indicates GH3-FTY cells uninfected with lentivirus. Statistical significance was observed only between LV-GFP and LV-Aip (*P<0.05; **P<0.01), but not between LV (-) and LV-GFP. ns, not significant. (D) Sensitivity to somatostatin (0–500 nM) was compared between cultured GH3 and GH3-FTY cells. Data were compared using the unpaired two-tailed t-test. **P<0.01, 500 nM somatostatin-treated GH3-FTY vs 500 nM somatostatin-treated GH3. a P<0.01 vs 0 nM somatostatin-treated GH3. bP<0.01 vs 0 nM somatostatin-treated GH3-FTY.
Fig 4
Fig 4. Western blot analysis of p-Stat3 (Tyr705) and Stat3 in cultured GH3 and GH3-FTY cells.
(A) Western blot analysis of p-Stat3 (Tyr705) and Stat3. Twenty μg protein from cell lysates was separated by SDS-PAGE and immunoblotted with antibodies against p-Stat3, Stat3, and beta-actin. (B) Statistical evaluation of Stat3/ beta-actin expression between cultured GH3 and GH3-FTY cells. Data were compared using the unpaired two-tailed t-test. ns, not significant. The intensity of each detected band was analyzed using the image analysis software Quantity One (BIO-RAD), and the Stat3/ beta-actin ratio was calculated. (C) Statistical evaluation of p-Stat3/ beta-actin expression between cultured GH3 and GH3-FTY cells. Data were compared using the unpaired two-tailed t-test. **P<0.01. (D) Western blot analysis of p-Stat3 and Stat3. The effect of lentivirus (LV)-mediated forced expression of exogenous Aip (LV-AIP) or gfp (LV-GFP) as a control on p-Stat3 expression was examined. Twenty μg protein from cell lysates was subjected to SDS-PAGE and immunoblotted with antibodies against p-Stat3 and beta-actin. (E) Statistical evaluation of p-Stat3. GFP and Aip indicate LV-GFP and LV-Aip, respectively. Data were compared using the unpaired two-tailed t-test. **P<0.01. ns, not significant. (F) Il6r mRNA levels relative to Actb mRNA levels as determined by qPCR. (G) Il6r mRNA levels relative to Actb mRNA levels as determined by qPCR before and after lentivirus (LV)-mediated exogenous expression of Aip (LV-Aip) or gfp (LV-GFP) as a control. GFP and Aip indicate LV-GFP and LV-Aip, respectively. Data were compared using the unpaired two-tailed t-test. *P<0.05, **P<0.01. ns, not significant.
Fig 5
Fig 5. Comparison of Sstr2, and Zac1 mRNA expression and Sstr2 expression levels by western blot in cultured GH3 and GH3-FTY cells.
(A) Sstr2 mRNA levels relative to Actb mRNA levels as determined by qPCR. (B) Western blot analysis of Sstr2 and beta-actin in cultured GH3 and GH3-FTY cells. Twenty μg protein from cell lysates was separated by SDS-PAGE and immunoblotted with antibodies against Sstr2 and beta-actin (upper panel). Statistical evaluation of Sstr2/ beta-actin expression between cultured GH3 cells and GH3-FTY cells (lower panel). (C) Zac1 mRNA levels relative to Actb mRNA levels as determined by qPCR. (D) Sstr2 mRNA levels relative to Actb mRNA levels as determined by qPCR after lentivirus (LV)-mediated exogenous expression of Aip (LV-Aip) or gfp (LV-GFP) as a control. GFP and Aip indicate LV-GFP and LV-Aip, respectively. (E) Zac1 mRNA levels relative to Actb mRNA levels as determined by qPCR after lentivirus (LV)-mediated exogenous expression of Aip (LV-Aip) or gfp (LV-GFP) as a control. GFP and Aip indicate LV-GFP and LV-Aip, respectively. Data were compared using the unpaired two-tailed t-test. *P<0.05, **P<0.01. ns, not significant.
Fig 6
Fig 6. Analysis of tumors in GH3 or GH3-FTY-xenografted mice.
(A) Actual appearance of tumors removed from control mice, GH3 mice, and GH3-FTY mice. (B) Tumor volume and (C) tumor weight 8 weeks after inoculation. Data were compared using the two-tailed unpaired t-test. *P<0.05. (D) Typical tissue histology of somatotroph cell tumors in GH3 or GH3-FTY mice by HE staining (upper two panels) and immunohistochemical analysis (lower two panels) at 4 weeks. Bar, 50 μm. Staining of Gh (green) and nucleus (DAPI, blue) was observed using confocal microscopy. A larger N/C ratio and anisonucleosis in GH3-FTY cells relative to GH3 cells were observed. More prominent Gh vesicles were observed in GH3-FTY compared with GH3 mice. Bar, 20 μm. (E) Typical tissue histology of tumors in GH3 and GH3-FTY mice by HE staining at 8 weeks. Arrowheads indicate abnormal mitotic cells. (F) Ki67 scores of both tumors were statistically compared. Data were compared using the two-tailed unpaired t-test. *P<0.05.
Fig 7
Fig 7. Plasma Gh and Igf-1 levels in GH3 and GH3-FTY mice.
BALB/c-nu mice were inoculated with GH3 or GH3-FTY cells. Control mice were inoculated by the medium only. Plasma levels of Gh (A) and Igf-1 (B) at 8 weeks after inoculation. Data were compared using the one-way ANOVA with Tukey’s post-hoc test. *P<0.05, ***P<0.001. ns, not significant.
Fig 8
Fig 8. Body weight, weight change, body length, and liver weight in GH3 and GH3-FTY mice.
(A) Actual appearance of control, GH3, and GH3-FTY mice. Arrowheads indicate xenograft tumor. (B) Time course of body weight changes. A significant difference between GH3-FTY and control mice was observed from 7 weeks after inoculation. No significant difference was observed between GH3 and control mice during the observation period. Statistical comparison of changes in body weight (C), body length (D), and liver weight (E) in control, GH3, and GH3-FTY mice. Data were compared using the one-way ANOVA with Tukey’s post-hoc test. *P<0.05, **P<0.01 vs control. †P<0.05, ††P<0.01 vs GH3. ns, not significant.
Fig 9
Fig 9. Glucose metabolism of control, GH3, and GH3-FTY mice after xenograft inoculation.
Six weeks after xenograft inoculation, GTT was performed. Changes in BG levels (A), AUC of blood glucose (B), plasma insulin levels (C), and AUC of plasma insulin levels (D). (E) Seven weeks after inoculation, ITT was performed. Data were compared using the one-way ANOVA with Tukey’s post-hoc test. *P<0.05, **P<0.01 between GH3 or GH3-FTY and control mice. ns, no significant change.

Similar articles

Cited by

References

    1. Vierimaa O, Georgitsi M, Lehtonen R, Vahteristo P, Kokko A, Raitila A, et al. Pituitary adenoma predisposition caused by germline mutations in the AIP gene. Science (New York, NY). 2006;312:1228–30. 10.1126/science.1126100 . - DOI - PubMed
    1. Daly AF, Vanbellinghen J-F, Khoo SK, Jaffrain-Rea M-L, Naves LA, Guitelman MA, et al. Aryl hydrocarbon receptor-interacting protein gene mutations in familial isolated pituitary adenomas: analysis in 73 families. The Journal of clinical endocrinology and metabolism. 2007;92:1891–6. 10.1210/jc.2006-2513 . - DOI - PubMed
    1. Leontiou Ca, Gueorguiev M, van der Spuy J, Quinton R, Lolli F, Hassan S, et al. The role of the aryl hydrocarbon receptor-interacting protein gene in familial and sporadic pituitary adenomas. The Journal of clinical endocrinology and metabolism. 2008;93:2390–401. 10.1210/jc.2007-2611 . - DOI - PubMed
    1. Chahal HS, Chapple JP, Frohman LA, Grossman AB, Korbonits M. Clinical, genetic and molecular characterization of patients with familial isolated pituitary adenomas (FIPA). Trends in endocrinology and metabolism: TEM. 2010;21:419–27. 10.1016/j.tem.2010.02.007 . - DOI - PubMed
    1. Cazabat L, Bouligand J, Salenave S, Bernier M, Gaillard S, Parker F, et al. Germline AIP mutations in apparently sporadic pituitary adenomas: prevalence in a prospective single-center cohort of 443 patients. The Journal of clinical endocrinology and metabolism. 2012;97:E663–70. 10.1210/jc.2011-2291 . - DOI - PubMed

MeSH terms

Substances