Gene-Activated Titanium Surfaces Promote In Vitro Osteogenesis
- PMID: 27706263
- PMCID: PMC5350041
- DOI: 10.11607/jomi.5026
Gene-Activated Titanium Surfaces Promote In Vitro Osteogenesis
Abstract
Purpose: Commercially pure titanium (CpTi) and its alloys possess favorable mechanical and biologic properties for use as implants in orthopedics and dentistry. However, failures in osseointegration still exist and are common in select individuals with risk factors such as smoking. Therefore, in this study, a proposal was made to enhance the potential for osseointegration of CpTi discs by coating their surfaces with nanoplexes comprising polyethylenimine (PEI) and plasmid DNA (pDNA) encoding bone morphogenetic protein-2 (pBMP-2).
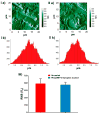
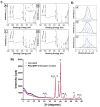
Materials and methods: The nanoplexes were characterized for size and surface charge with a range of N/P ratios (the molar ratio of amine groups of PEI to phosphate groups in pDNA backbone). CpTi discs were surface characterized for morphology and composition before and after nanoplex coating using scanning electron microscopy (SEM), atomic force microscopy (AFM), X-ray photoelectron spectroscopy (XPS), and X-ray powder diffraction (XRD). The cytotoxicity and transfection ability of CpTi discs coated with nanoplexes of varying N/P ratios in human bone marrow-derived mesenchymal stem cells (BMSCs) was measured via MTS assays and flow cytometry, respectively.
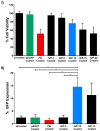
Results: The CpTi discs coated with nanoplexes prepared at an N/P ratio of 10 (N/P-10) were considered optimal, resulting in 75% cell viability and 14% transfection efficiency. Enzyme-linked immunosorbent assay results demonstrated a significant enhancement in BMP-2 protein secretion by BMSCs 7 days posttreatment with PEI/pBMP-2 nanoplexes (N/P-10) compared to the controls, and real-time PCR data demonstrated that the BMSCs treated with PEI/pBMP-2 nanoplex-coated CpTi discs resulted in an enhancement of Runx-2, alkaline phosphatase, and osteocalcin gene expressions on day 7 posttreatment. In addition, these BMSCs demonstrated enhanced calcium deposition on day 30 posttreatment as determined by qualitative (alizarin red staining) and quantitative (atomic absorption spectroscopy) assays.
Conclusion: It can be concluded that PEI/pBMP-2 nanoplex (N/P-10)-coated CpTi discs have the potential to induce osteogenesis and enhance osseointegration.
Figures


Similar articles
-
Nanoplex-Mediated Codelivery of Fibroblast Growth Factor and Bone Morphogenetic Protein Genes Promotes Osteogenesis in Human Adipocyte-Derived Mesenchymal Stem Cells.Mol Pharm. 2015 Aug 3;12(8):3032-42. doi: 10.1021/acs.molpharmaceut.5b00297. Epub 2015 Jul 10. Mol Pharm. 2015. PMID: 26121311 Free PMC article.
-
Ectopic study of calcium phosphate cement seeded with pBMP-2 modified canine bMSCs mediated by a non-viral PEI derivative.Cell Biol Int. 2012 Feb;36(2):119-28. doi: 10.1042/CBI20100848. Cell Biol Int. 2012. PMID: 21899515
-
Using poly(lactic-co-glycolic acid) microspheres to encapsulate plasmid of bone morphogenetic protein 2/polyethylenimine nanoparticles to promote bone formation in vitro and in vivo.Int J Nanomedicine. 2013;8:2985-95. doi: 10.2147/IJN.S45184. Epub 2013 Aug 13. Int J Nanomedicine. 2013. PMID: 23990717 Free PMC article.
-
Effects of calcium concentration on nonviral gene delivery to bone marrow-derived stem cells.J Tissue Eng Regen Med. 2019 Dec;13(12):2256-2265. doi: 10.1002/term.2971. Epub 2019 Nov 11. J Tissue Eng Regen Med. 2019. PMID: 31677246
-
BMP-2 gene modified canine bMSCs promote ectopic bone formation mediated by a nonviral PEI derivative.Ann Biomed Eng. 2011 Jun;39(6):1829-39. doi: 10.1007/s10439-011-0276-7. Epub 2011 Feb 23. Ann Biomed Eng. 2011. PMID: 21347550 Free PMC article.
Cited by
-
Application of Lyophilized Gene-Delivery Formulations to Dental Implant Surfaces: Non-Cariogenic Lyoprotectant Preserves Transfection Activity of Polyplexes Long-Term.J Pharm Sci. 2023 Jan;112(1):83-90. doi: 10.1016/j.xphs.2022.11.008. Epub 2022 Nov 11. J Pharm Sci. 2023. PMID: 36372226 Free PMC article.
-
Tissue-engineered bone construct promotes early osseointegration of implants with low primary stability in oversized osteotomy.BMC Oral Health. 2024 Jan 10;24(1):69. doi: 10.1186/s12903-023-03834-x. BMC Oral Health. 2024. PMID: 38200461 Free PMC article.
-
Harnessing biomolecules for bioinspired dental biomaterials.J Mater Chem B. 2020 Oct 14;8(38):8713-8747. doi: 10.1039/d0tb01456g. Epub 2020 Aug 4. J Mater Chem B. 2020. PMID: 32747882 Free PMC article. Review.
-
Gene-Activated Materials in Regenerative Dentistry: Narrative Review of Technology and Study Results.Int J Mol Sci. 2023 Nov 13;24(22):16250. doi: 10.3390/ijms242216250. Int J Mol Sci. 2023. PMID: 38003439 Free PMC article. Review.
-
Bone Regeneration Using Gene-Activated Matrices.AAPS J. 2017 Jan;19(1):43-53. doi: 10.1208/s12248-016-9982-2. Epub 2016 Sep 21. AAPS J. 2017. PMID: 27655418 Free PMC article. Review.
References
-
- Yamaguchi A. Regulation of differentiation pathway of skeletal mesenchymal cells in cell lines by transforming growth factor-beta superfamily. Semin Cell Biol. 1995;6:165–173. - PubMed
-
- Heldin CH, Miyazono K, tenDijke P. TGF-beta signalling from cell membrane to nucleus through SMAD proteins. Nature. 1997;390:465–471. - PubMed
-
- Wegman F, Bijenhof A, Schuijff L, Oner FC, Dhert WJA, Alblas J. Osteogenic Differentiation as a Result of Bmp-2 Plasmid DNA Based Gene Therapy in Vitro and in Vivo. Eur Cells Mater. 2011;21:230–242. - PubMed
-
- Poynton AR, Lane JM. Safety profile for the clinical use of bone morphogenetic proteins in the spine. Spine. 2002;27:S40–S48. - PubMed
MeSH terms
Substances
Grants and funding
LinkOut - more resources
Full Text Sources
Other Literature Sources
Miscellaneous

