. 2016 Oct;4(19):e12981.
doi: 10.14814/phy2.12981.

Typical gray matter axons in mammalian brain fail to conduct action potentials faithfully at fever-like temperatures

Affiliations

Typical gray matter axons in mammalian brain fail to conduct action potentials faithfully at fever-like temperatures

Dobromila Pekala et al. Physiol Rep. 2016 Oct.

Abstract

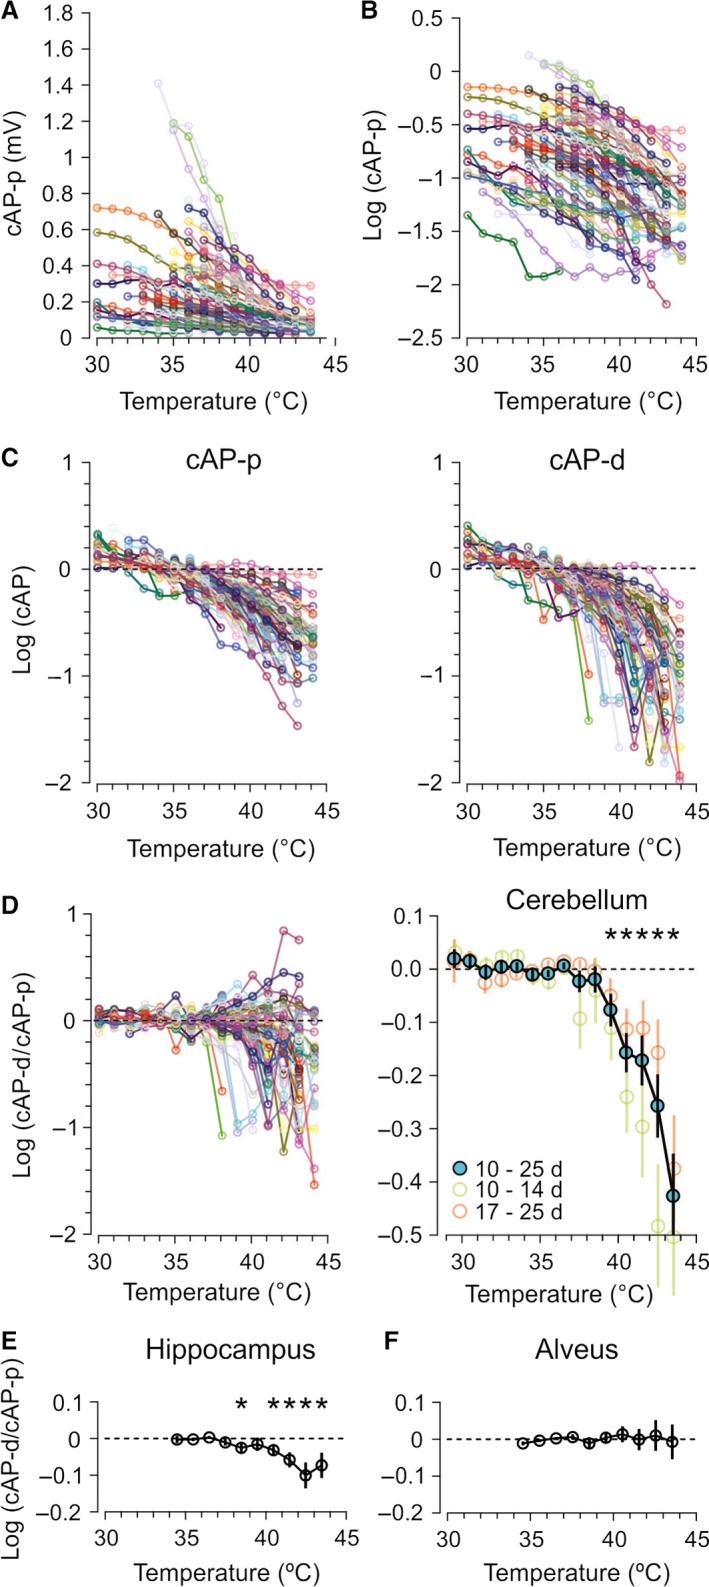
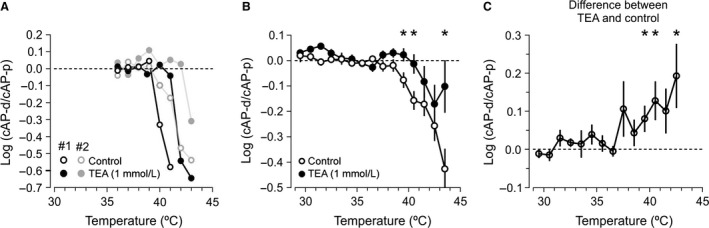
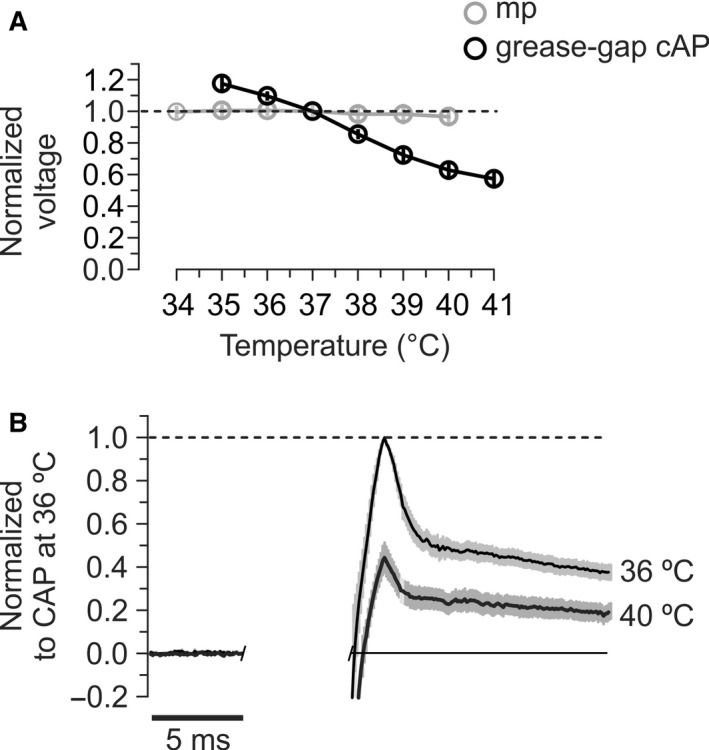
We studied the ability of typical unmyelinated cortical axons to conduct action potentials at fever-like temperatures because fever often gives CNS symptoms. We investigated such axons in cerebellar and hippocampal slices from 10 to 25 days old rats at temperatures between 30 and 43°C. By recording with two electrodes along axonal pathways, we confirmed that the axons were able to initiate action potentials, but at temperatures >39°C, the propagation of the action potentials to a more distal recording site was reduced. This temperature-sensitive conduction may be specific for the very thin unmyelinated axons because similar recordings from myelinated CNS axons did not show conduction failures. We found that the conduction fidelity improved with 1 mmol/L TEA in the bath, probably due to block of voltage-sensitive potassium channels responsible for the fast repolarization of action potentials. Furthermore, by recording electrically activated antidromic action potentials from the soma of cerebellar granule cells, we showed that the axons failed less if they were triggered 10-30 msec after another action potential. This was because individual action potentials were followed by a depolarizing after-potential, of constant amplitude and shape, which facilitated conduction of the following action potentials. The temperature-sensitive conduction failures above, but not below, normal body temperature, and the failure-reducing effect of the spike's depolarizing after-potential, are two intrinsic mechanisms in normal gray matter axons that may help us understand how the hyperthermic brain functions.

Keywords: Conduction failures; excitability; gray matter axons; presynaptic mechanisms.


Figures

Figure 1
Figure 1
Detection of conduction failures in parallel fibers, single‐experiment examples. (A) Two recording electrodes were positioned along the parallel fibers to record cAP at different distances (cAP‐p and cAP‐d: proximal and distal compound action potential, respectively) from the initiation point (stimulating electrode, Stim). The distance between Stim and proximal electrode (Prox) was always shorter than between Prox and distal electrode (Dist). (B) cAP‐d was usually smaller than cAP‐p at all temperatures (note different scaling). Additionally, cAP‐d decreased more than cAP‐p at high temperatures. Signals have been scaled to the same peak‐to‐peak amplitude at 35°C to better compare amplitude drops at high temperatures. Shaded area indicates a time window bracketing the cAP (appearing at all temperatures during the experiment) in which the magnitude of the volley was measured. The noise was measured at the beginning of the trace, within the same time window as window bracketing the cAP for each individual electrode. (C) Temperature increase (top panel) from 33 to 44°C resulted in concomitant reduction of amplitudes at both proximal and distal recording sites (lower panel). The cAPs increased again as temperature was reduced to 33°C. The noise measurement is shown separately and was in this case not subtracted from the cAP values. (D) cAP magnitude measured as SD of the signal in the time windows indicated in (B). cAP‐d (orange) dropped more than cAP‐p (black) at temperatures ˃37°C, plotted as logarithmic values, and normalized to their average values at 36°C. (E) Amplitude of cAP measured as peak‐to‐peak of cAP, in the same experiment as in B–D, showed similar results as when signal was measured as SD. (F) Example traces from 35, 37, and 40°C (same as in panel B), normalized to the cAP‐p peak‐to‐peak values (so that cAP‐p, dashed line, has the peak‐to‐peak value of 1.0), show a drop of cAP‐d amplitude relative to cAP‐p at 40°C (arrow). (G) Example of signal recorded from myelinated fibers of alveus. As in panel B, shaded area indicates a time window bracketing the cAP (appearing at all temperatures during the experiment) in which the magnitude of the volley was measured. In contrast to unmyelinated axons in cerebellum, cAP‐p and cAP‐d from the myelinated axons showed proportional drop during increase in temperature. (H) cAP magnitude of the signal shown in G confirmed the lack of selective drop in cAP‐d (orange) when compared with cAP‐p (black) while increasing temperature. Measurements were normalized to their average at 36°C, and plotted as logarithmic values.
Figure 2
Figure 2
Effect of temperature on cAP‐p and cAP‐d in cerebellum (A–D) and hippocampus (E–F). (A) The effect of temperature on cAP‐p in 78 recordings marked by different colors. (B) The logarithmic (base 10) values of the same data as in (A). (C) The left plot shows individual experiments (the same as in A and B) normalized to the average of the data points from 30 to 37°C. The same procedure was applied to cAP measured at the distal electrode (right). Note the larger drop of cAP‐d compared to cAP‐p at high temperatures. (D) The difference in the drop of cAP‐d and cAP‐p expressed as logarithms of the ratio cAP‐d/cAP‐p, in 78 individual experiments (left). The dominating negative values at high temperatures show that cAP‐d fell more than cAP‐p. The average of all experiments (right) confirms that cAP‐d dropped more than cAP‐p at temperatures ≥39.5°C (*= 0.012 at 39.5°C, and < 0.0003, at temperatures >39.5°C, = 78). Splitting the data in groups from 10 to 14 and 17–25 days old (none were 15 or 16 days old) showed that the cAPs fell more at distal electrode both in the youngest and oldest groups, with a tendency to drop most in the group of young animals. (E) Similar to cerebellar parallel fibers, hippocampal unmyelinated axons in stratum radiatum of the Ca1 area also showed larger drop of cAP‐d than cAP‐p at high temperatures. However, the magnitude of the drop was smaller than in cerebellum (*< 0.03, = 25). (F) Myelinated axons in alveus did not show changes of the cAP‐d/cAP‐p ratio, suggesting that these axons did not fail in the tested temperature range. (> 0.05 at all temperatures, = 16).
Figure 3
Figure 3
Effect of TEA (1 mmol/L) on spike conduction in parallel fibers. (A) Examples of preferential drop of cAP‐d during elevated temperatures, measured in two individual experiments (black and gray) before (open circles) and during application of TEA (filled circles). Note a shift toward higher temperatures in the drop of log (cAP‐d/cAP‐p) in the presence of TEA. (B) Average values of log (cAP‐d/cAP‐p) from 16 experiments with TEA in the bath (filled circles), compared to 78 experiments without TEA (open circles). (* indicates < 0.05 for the difference between TEA and control). (C) The failure‐reducing effect of TEA shown by the average of the differences between log‐ratios before (control) and during TEA (= 0.01, 0.01, 0.05, and 0.02 at 39.5, 40.5, 41.5, and 42.5°C, respectively, = 15).
Figure 4
Figure 4
Effects of temperature on cAPs during a train of spikes. (A) Four stimuli were repeated at 20 msec intervals. The amplitude of all cAPs (cAP1–4) in the train decreased during temperature increase from 36°C (gray trace) to 40°C (black trace). Note the difference in calibration bar. (B) Measurements of cAP1 and cAP4 (the same experiment as in A) showed that cAP4 (orange) declined less than cAP1 (black) at temperatures ˃38°C. (C) cAP4 normalized to cAP1 peak‐to‐peak amplitude at 37, 38, and 40°C, to illustrate the reduced drop of cAP4 relative to cAP1 at high temperatures (the same experiment as in A and B). (D) Logarithm of the cAP4/cAP1 ratio shows that cAP4 dropped less than cAP1 at temperatures ˃38°C. (E) The average of 76 experiments similar to the one displayed in panels A–D shows that cAP4 dropped less than cAP1 at temperatures >37.5°C (*< 0.02, = 76). (F) Smaller values of cAP‐d/cAP‐p (interpreted as more failures) were associated with larger values of cAP4/cAP1 (interpreted as fewer failures after at least one spike). This association was much stronger at high than low temperatures (3–6 data points from each of 76 experiments).
Figure 5
Figure 5
Latency of cAPs in response to repeated stimuli, recorded at distal electrode. (A) Four cAPs in response to four equal stimuli given with 20 msec intervals, at 37°C. Compared to the first latency (Lat1), the second latency (Lat2) was shorter, but the second, third (Lat3), and fourth (Lat4) latencies were very similar. The similarity of Lat2‐4 is presented also by aligning the four cAPs to their stimulus artifacts (inset on the right). Color codes as in latency markers in left hand‐side panel. (B) Lat2‐4 normalized to Lat1, in 20 experiments at 37°C, with 20 msec stimulus intervals, shows that the latency was shorter after the first cAP, but changed little at the three last cAPs in the four‐stimulus trains. *< 0.0001, ns: > 0.6. = 20. (C) The latencies of all four responses (the same recording as in A) decreased as temperature increased. (D) Average relative latencies at 37°C with 10, 20, and 30 msec stimulus intervals shows reduced effect on latency at longer intervals. The average of Lat2‐4 from each experiment was used (= 22, 20, and 13 at intervals 10, 20, and 30 msec, respectively, = 0.04). (E) The CV of Lat2–4 for the same intervals and experiments as in D. (= 22, 20, and 13 at intervals 10, 20, and 30 msec, respectively, < 0.05).
Figure 6
Figure 6
Antidromic failures were reduced by the axonal DAP. (A) Intracellular tight‐seal recording from cerebellar granule cell in a 24‐day‐old rat. This and all cells accepted for analysis responded with spikes to positive current injection, in this case, a 50 ms long 10 pA square pulse. (B) In response to electrical activation of the recorded cell's parallel fiber, antidromic spikes (green) invaded the soma. The invasion of full antidromic spikes (green) was prevented by hyperpolarization of the soma, and then only attenuated spikes arrived at the soma (red). By further hyperpolarization, also the slower, attenuated spikes failed to invade the soma (gray). Vertical axis is the same as in A. (C) The somatic membrane potential was adjusted to give ~50% invasion failures at the first response in the train of four stimuli. In the presented example, seven consecutive stimuli of equal strength gave five failures and two successes at the first stimulus. (D) The same traces as in C, but vertically separated so that the individual four‐stimulus train can be seen. When spike was detected (full or attenuated, in this example, attenuated), the following stimuli always elicited a spike that propagated far enough to be detected at the soma. (E) The average success fraction at the first stimulus in 16 experiments (open bar). When there was a failure at first, second, or third stimulus, the success rate for the following stimulus did not increase (red bars). However, when a successful spike was detected at the soma at first, second, or third stimulus (blue bars), a success followed almost always (only two failures after totally 1784 successes).
Figure 7
Figure 7
The depolarizing after‐potential is relatively unaffected by moderate spike activity. (A) Example of antidromic spikes recorded at granule cell soma in response to electrical activation of parallel fibers with four stimuli (interval = 20 msec). Membrane potentials were measured before (marked 0) and after stimuli at intervals corresponding to stimulus intervals (marked 1–4). (B) Average values of membrane potentials (mp) measured at points indicated by the arrows in A in 14 experiments. Comparing responses 1–4: = 0.94, = 14. (C) Grease‐gap recordings from bundles of cerebellar parallel fibers in response to four stimuli with 20 msec intervals. The grease‐gap signals were small, but showed many features similar to the somatic recordings, for example, the slowly decaying DAP after the fast component. (D) To compare the DAP variability in both recording types on a similar scale, we normalized the DAP amplitudes, measured from baseline before the first stimulus, to the value of the first DAP amplitude both in intracellular (= 14) and grease‐gap recordings (= 23), left and right graphs, respectively.
Figure 8
Figure 8
Temperature effects on spike and membrane potential. (A) The membrane potential showed small changes while the grease‐gap recorded cAP clearly lost amplitude as temperature increased. Before averaging, the membrane potentials and peak cAP amplitudes in each experiment were normalized to their values at 37°C. mp – membrane potential, average of eight intracellular somatic recordings from granule cells. Grease‐gap recorded cAP – average of 13 experiments. (B) The average shape (±SEM, shaded area) of the grease‐gap recorded cAP from cerebellar parallel fibers in nine experiments, at 36 and 40°C. Electrical stimulation artifacts were digitally removed. Although the amplitude of the whole signal decreased at high temperature, DAP was still present at 40°C.

References

    1. Adachi, R. , Yamada R., and Kuba H.. 2015. Plasticity of the axonal trigger zone. Neuroscientist 21:255–265. - PubMed
    1. Baginskas, A. , Palani D., Chiu K., and Raastad M.. 2009. The H‐current secures action potential transmission at high frequencies in rat cerebellar parallel fibers. Eur. J. Neurosci. 29:87–96. - PubMed
    1. Barron, D. H. , and Matthews B. H.. 1935. Intermittent conduction in the spinal cord. J. Physiol. 85:73–103. - PMC - PubMed
    1. Bernstein, J. 1902. Untersuchungen zur Thermodynamik der bioelektrischen Ströme. Pflügers Arch. 92:41.
    1. Blanton, M. G. , Lo Turco J. J., and Kriegstein A. R.. 1989. Whole cell recording from neurons in slices of reptilian and mammalian cerebral cortex. J. Neurosci. Methods 30:203–210. - PubMed

Publication types

MeSH terms

LinkOut - more resources