. 2016 Dec 1;116(6):2799-2814.
doi: 10.1152/jn.00449.2016. Epub 2016 Oct 5.

Specific connectivity between photoreceptors and horizontal cells in the zebrafish retina

Affiliations

Specific connectivity between photoreceptors and horizontal cells in the zebrafish retina

Lauw J Klaassen et al. J Neurophysiol. .

Abstract

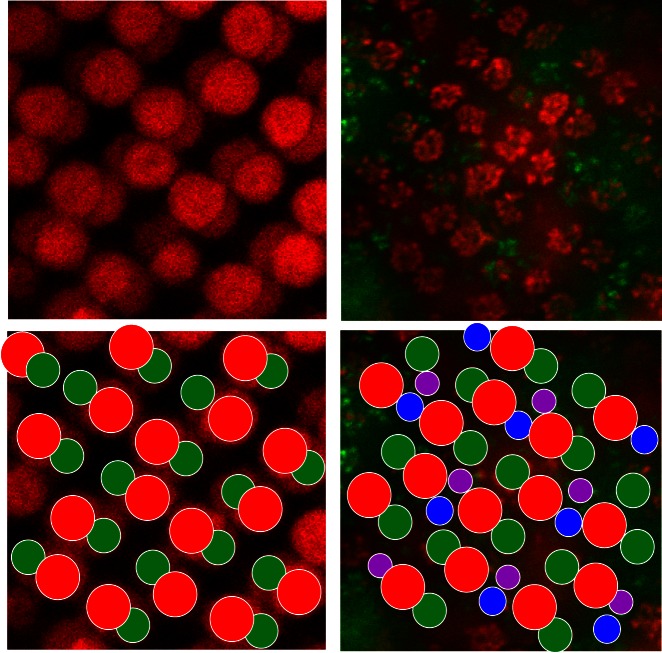
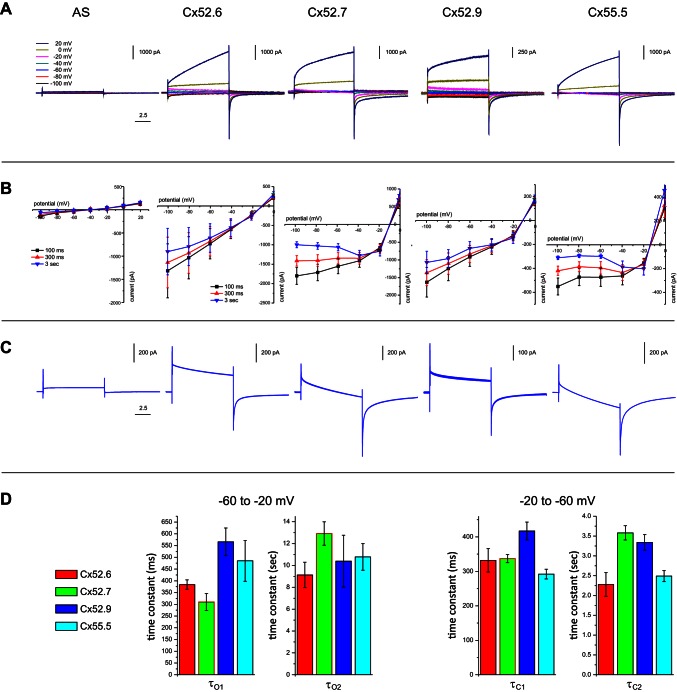
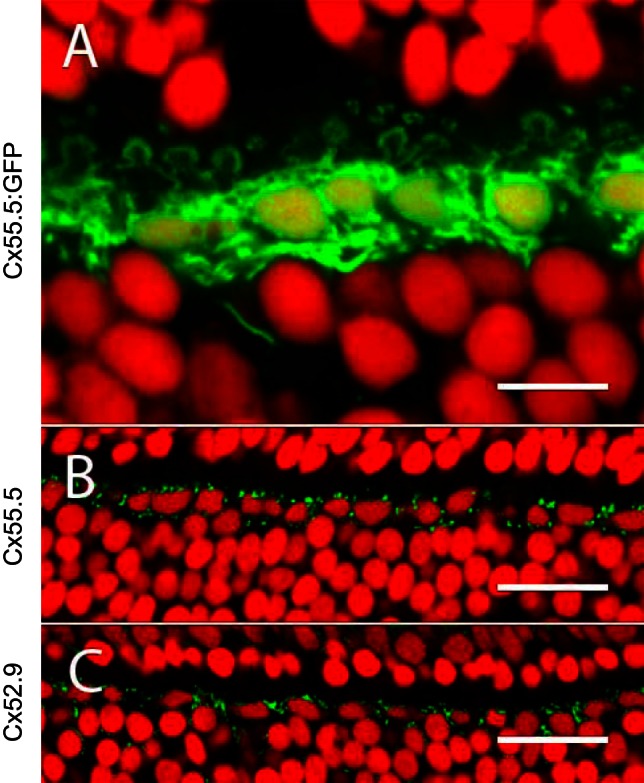
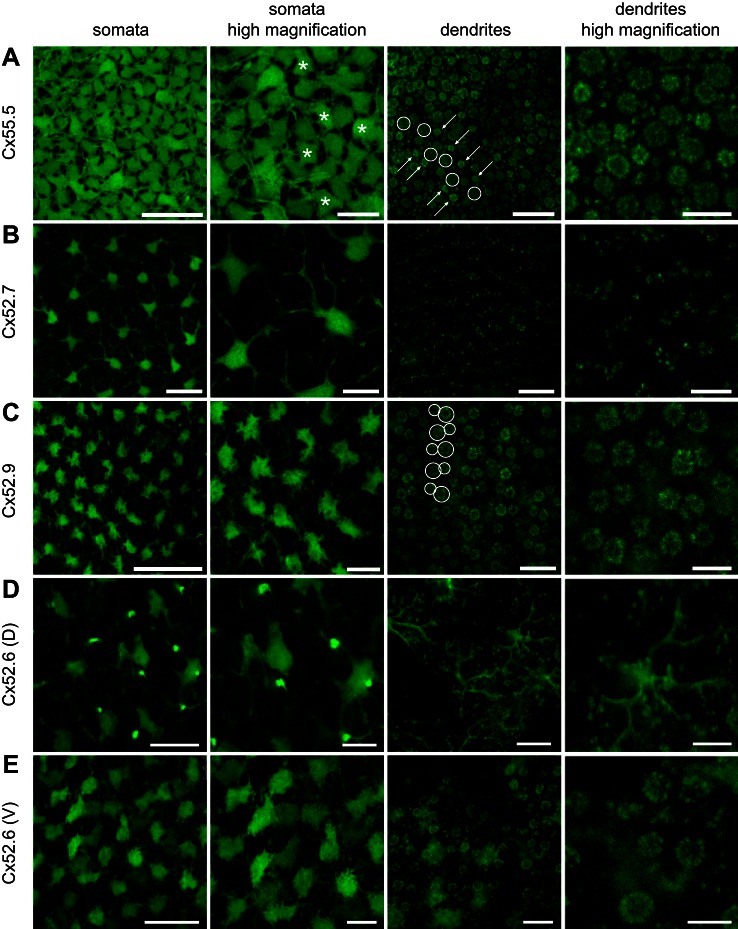
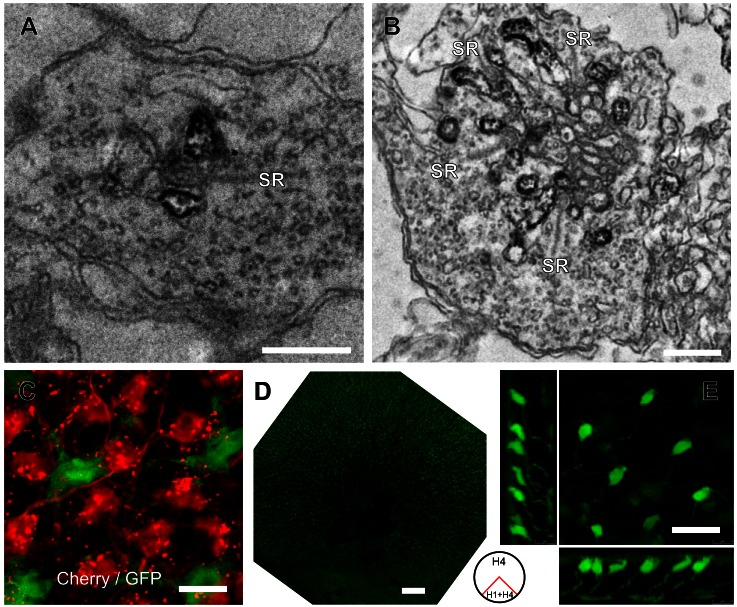
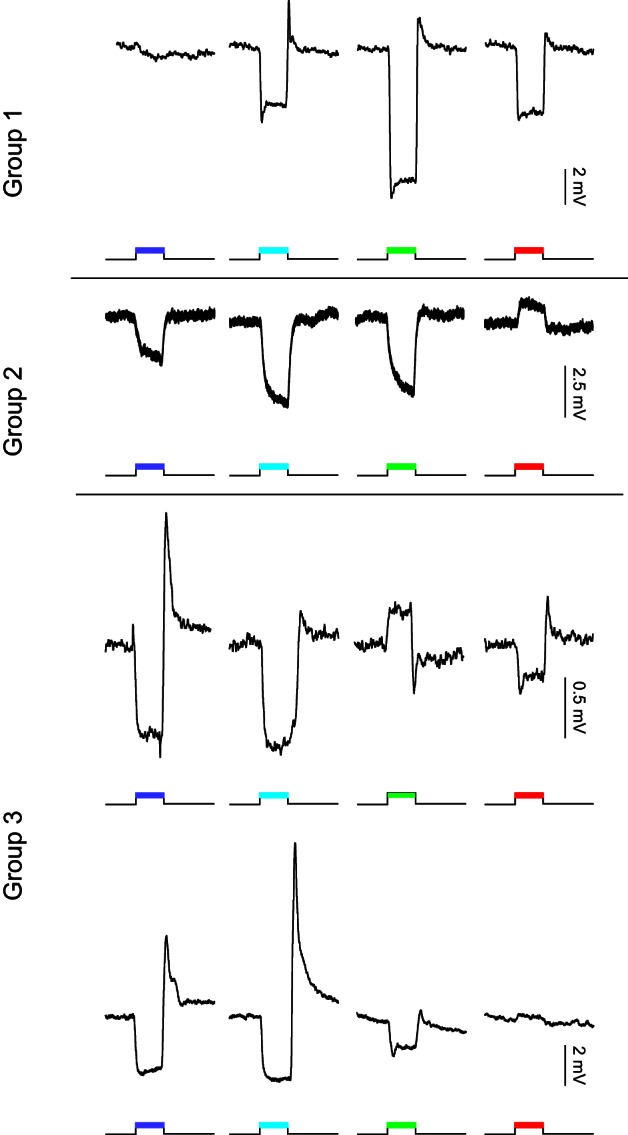
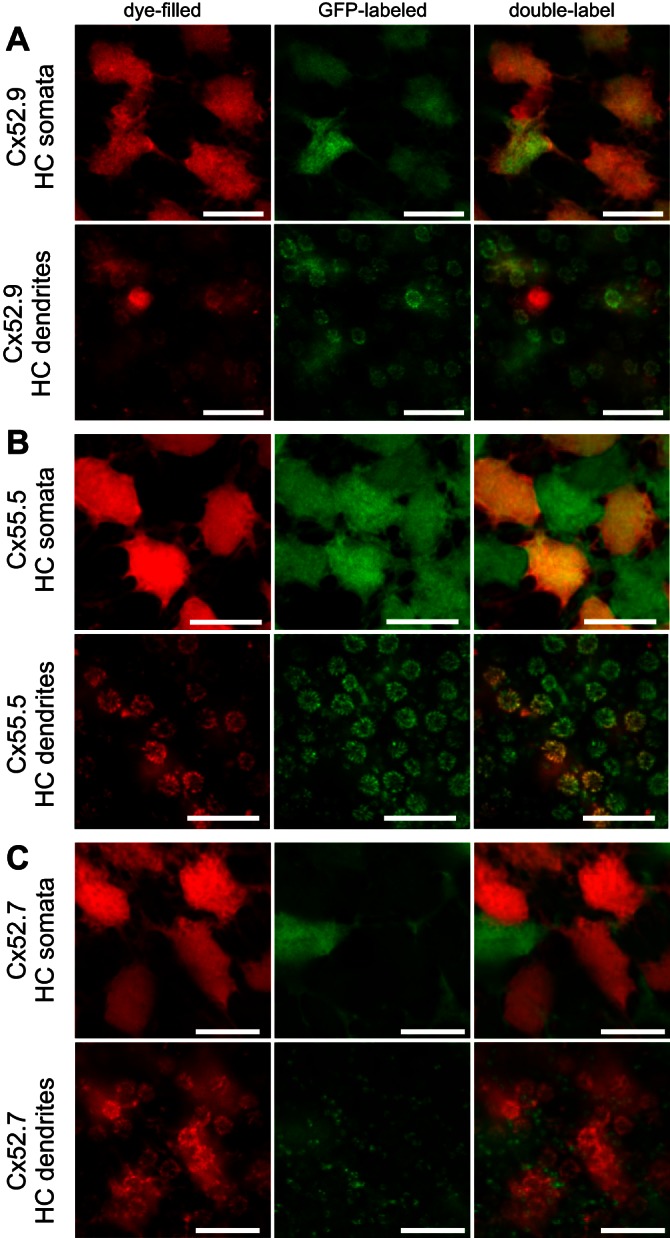
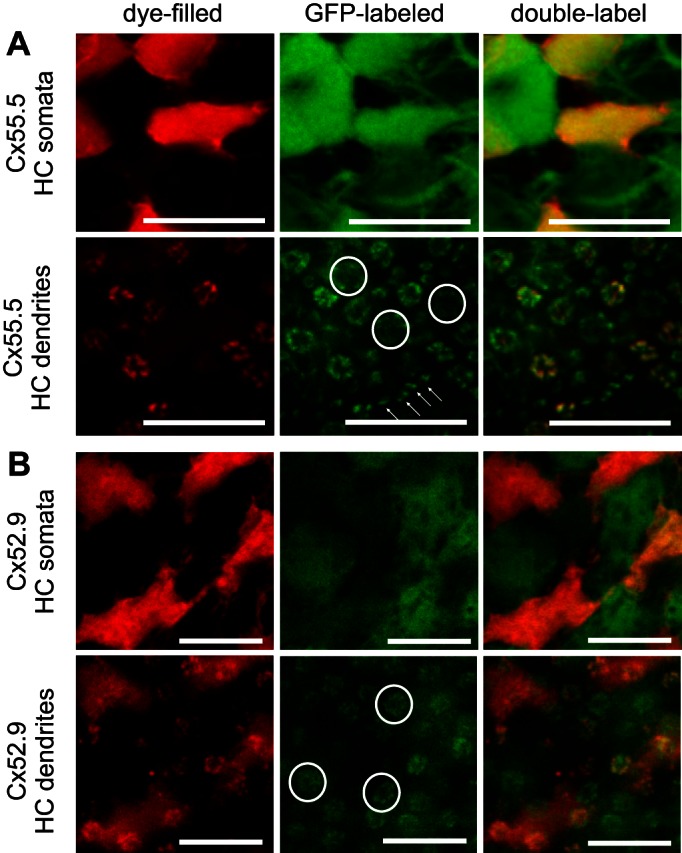
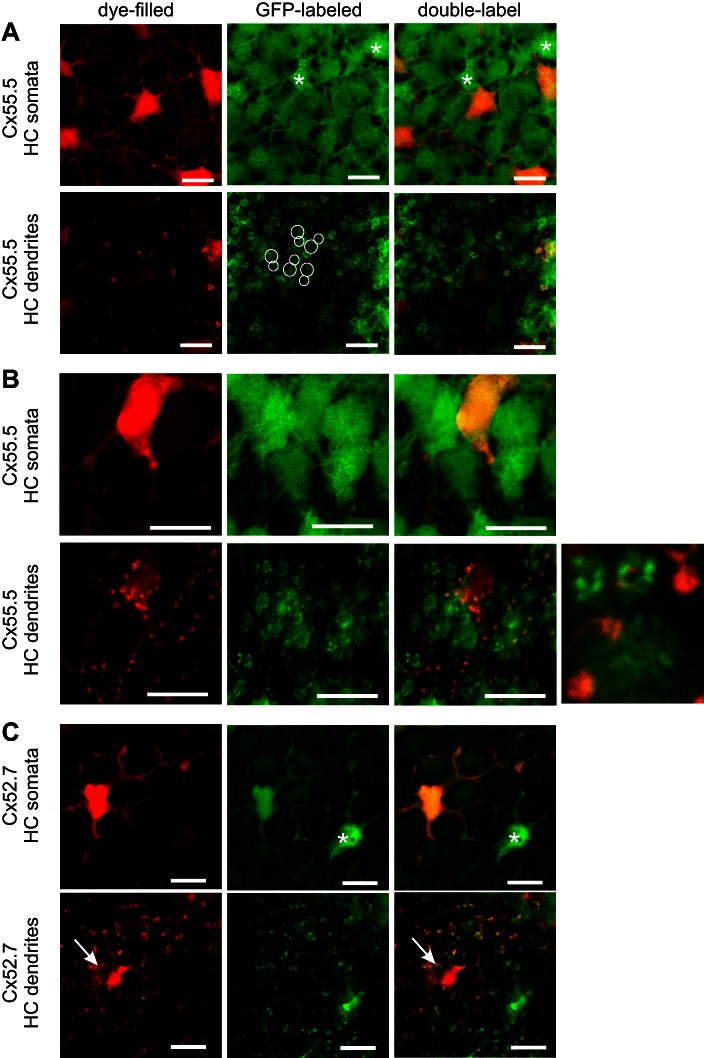
The functional and morphological connectivity between various horizontal cell (HC) types (H1, H2, H3, and H4) and photoreceptors was studied in zebrafish retina. Since HCs are strongly coupled by gap junctions and feedback from HCs to photoreceptors depends strongly on connexin (Cx) hemichannels, we characterized the various HC Cxs (Cx52.6, Cx52.7, Cx52.9, and Cx55.5) in Xenopus oocytes. All Cxs formed hemichannels that were conducting at physiological membrane potentials. The Cx hemichannels differed in kinetic properties and voltage dependence, allowing for specific tuning of the coupling of HCs and the feedback signal from HCs to cones. The morphological connectivity between HC layers and cones was determined next. We used zebrafish expressing green fluorescent protein under the control of Cx promoters. We found that all HCs showed Cx55.5 promoter activity. Cx52.7 promoter activity was exclusively present in H4 cells, while Cx52.9 promoter activity occurred only in H1 cells. Cx52.6 promoter activity was present in H4 cells and in the ventral quadrant of the retina also in H1 cells. Finally, we determined the spectral sensitivities of the HC layers. Three response types were found. Monophasic responses were generated by HCs that contacted all cones (H1 cells), biphasic responses were generated by HCs that contacted M, S, and UV cones (H2 cells), and triphasic responses were generated by HCs that contacted either S and UV cones (H3 cells) or rods and UV cones (H4 cells). Electron microscopy confirms that H4 cells innervate cones. This indicates that rod-driven HCs process spectral information during photopic and luminance information during scotopic conditions.

Keywords: connexins; horizontal cell; photoreceptors; retina; zebrafish.


Figures

Fig. 1.
Fig. 1.
Cone mosaic in Cx55.5:GFP retina with filled H1 network. Confocal images of autofluorescent double cones (left) and the rosettes formed by fluorescent HC dendrites (right, red and green) reveal a regular mosaic, schematized at bottom. The HC dendrites innervate cone synaptic terminals. L- and M-cone terminals (red and green circles) alternate in a double straight line, S- and UV-cone terminals (blue and purple circles) alternate in a single straight line between the double cones. The filled dendrites (red) are from an H1 network, predominantly contacting L and M cones, but filled dendrites in S- and UV-cone terminals can also be seen.
Fig. 2.
Fig. 2.
Electrophysiological properties of zebrafish HC Cx hemichannels measured in Xenopus oocytes. A: currents for different 10-s voltage steps in a 2-electrode voltage-clamp experiment measured in oocytes in which different HC Cxs are expressed. AS, Cx38 antisense-injected oocytes. B: current-voltage relations for different HC Cxs, measured at 100 ms, 300 ms, and 3 s after onset of the step. Cx52.6 and Cx52.9 show a similar current-voltage relation, just as Cx52.7 and Cx55.5, which are more rectifying. C: magnified current traces for the voltage step from −60 mV to −20 mV. Cx52.6 and Cx52.9 show a more sustained current, while Cx52.7 and Cx55.5 show a more transient current. To these traces the time constants shown in D were fitted. D: fast and slow time constants for opening (τO1, τO2) and closing (τC1, τC2) of different Cx hemichannels. For statistics see the text and Table 1.
Fig. 3.
Fig. 3.
Immunohistochemical localization of zebrafish HC Cxs. A: section of a retina with GFP expression via the Cx55.5 promoter, showing a single layer of HC somata. The horseshoe-shaped structures are dendrites innervating cone synaptic terminals. Nuclei are stained with ethidium bromide (red). B and C: retinal sections stained with antibodies against Cx55.5 and Cx52.9 show punctuate labeling (green) around HCs. Nuclei are stained with ethidium bromide (red). Scale bars: 10 μm (A), 25 μm (B), 25 μm (C).
Fig. 4.
Fig. 4.
Expression of GFP in HCs via different Cx promoters. A: GFP expression in HCs via the promoter of Cx55.5, shown at different magnifications. Somata of different sizes and shapes can be observed, and some irregularly shaped somata appear more brightly fluorescent (asterisks indicate some examples) than others. At the level of the synaptic terminals the HC dendrites in the small S- and UV-cone terminals (arrows) appear more brightly fluorescent than in the large L-cone terminals (circles). Small rod terminals are located between the rosettes of cone terminals. B: GFP expression in HCs via the promoter of Cx52.7, shown at different magnifications. Only a subset of HCs show fluorescence, with large irregular somata and long thick dendrites. The tips of the dendrites of these HCs do not form rosettes but can often be seen in pairs. C: GFP expression in HCs via the promoter of Cx52.9, shown at different magnifications. Only a subset of HCs show fluorescence, with small somata and relatively short dendrites. The tips of the dendrites of these HCs mainly form large rosettes, indicative of L-cone terminals (large circles) and M-cone terminals (smaller circles). D: GFP expression in HCs via the promoter of Cx52.6 in the dorsal 3 quadrants of the retina, shown at different magnifications. Large HCs with irregular somata and long dendrites show fluorescence together with regularly spaced bipolar cells. At the level of the dendrites only punctuate contacts with photoreceptors are visible. E: GFP expression in HCs via the promoter of Cx52.6 in the ventral quadrant of the retina, shown at different magnifications. Only a subset of HCs show fluorescence, with different intensities. The tips of the dendrites form large rosettes and punctuate patterns. In the ventral quadrant no bipolar cells are labeled with GFP. Scale bars, from left to right: 25 μm, 10 μm, 10 μm, and 5 μm.
Fig. 5.
Fig. 5.
Specificity of GFP expression via the Cx52.7, Cx52.9, and Cx52.6 promoters. A: electron microscopic image of a rod synaptic terminal in a Cx52.7:GFP retina. HC dendrites flanking the synaptic ribbon (SR) are stained with an anti-GFP antibody. Scale bar: 500 nm. B: electron microscopic image of a cone synaptic terminal in a Cx52.7:GFP retina. HC dendrites flanking the multiple synaptic ribbons (SR) are stained with an anti-GFP antibody. C: confocal image of a double Cx52.7:GFP and Cx52.9:mCherry transgenic zebrafish shows that there is no overlap between the HC somata showing expression. The expression of mCherry led to some cluttering in the dendrites. D: overview of a Cx52.6:GFP retina. The ventral quadrant shows fluorescence only in HCs (H1 + H4); the dorsal 3 quadrants show fluorescence in H4 HCs and strong fluorescence in a specific type of bipolar cell. E: confocal image of the dorsal region of a Cx52.6:GFP retina, showing the morphology of bipolar cells with green fluorescence. Scale bars: 0.5 μm (A), 0.5 μm (B), 10 μm (C), 200 μm (D), 20 μm (E).
Fig. 6.
Fig. 6.
Examples of spectral response profiles of recorded zebrafish HCs. Group 1: monophasic profiles with hyperpolarizing responses to red (624 nm), green (525 nm), and blue (465 nm) light and barely a response to UV light (365 nm). Group 2: biphasic profiles with depolarizing responses to red (624 nm) light and hyperpolarizing responses to green (525 nm) and blue (465 nm) light. Responses to UV light (365 nm) are small and variable and most often hyperpolarizing. Group 3: triphasic-like profiles are variable but have in common the large hyperpolarizing responses to short-wavelength light (365 and 465 nm). Responses to green (525 nm) and red (624 nm) light are variable in this group.
Fig. 7.
Fig. 7.
Morphological characteristics of monophasic HCs. A: filled HCs with a monophasic response profile (red) in a Cx52.9:GFP retina (green) showing complete overlap, indicating H1-type HCs. Accidently a cone was filled, showing red without green. At the level of the dendrites, large rosettes indicative of L- and M-cone terminals show overlap of red and green. Scale bars: 10 μm. B: filled HCs with a monophasic response profile (red) in a Cx55.5:GFP retina (green) showing an alternating pattern of red and green HCs. At the level of the dendrites, large rosettes indicative of L- and M-cone terminals are red, while smaller rosettes indicative of S- and UV-cone terminals are bright green. Scale bars: 10 μm. C: filled HCs with a monophasic response profile (red) in a Cx52.7:GFP retina (green) show no overlap between red and green HCs, indicating that the filled HCs are not H4-type HCs. At the level of the dendrites, large rosettes indicative of L- and M-cone terminals are red, while dendrites in rod synaptic terminals are green. Scale bars: 10 μm.
Fig. 8.
Fig. 8.
Morphological characteristics of biphasic HCs. A: filled HCs with a biphasic response profile (red) in a Cx55.5:GFP retina (green) showing an overlap of red and bright green HCs, indicating that the filled HCs are H2-type HCs. At the level of the dendrites, small rosettes show overlap of red and green fluorescence, while the largest rosettes (circles, indicating L-cone terminals) and dendrites inside rod terminals (arrows) were not filled. Scale bars: 10 μm. B: filled HCs with a biphasic response profile (red) in a Cx52.9:GFP retina (green) showing an alternating pattern of red and green fluorescent HCs, indicating that the filled HCs are not H1 type HCs. The largest rosettes (circles, indicating the L-cone terminals) show green but not red fluorescence, indicating innervation from H1-type HCs but not innervation from H2-type HCs. Scale bars: 10 μm.
Fig. 9.
Fig. 9.
Morphological characteristics of triphasic HCs. A: filled HCs with a triphasic response profile (red) in a Cx55.5:GFP retina (green). Bright green fluorescent HCs are H2-type HCs (asterisks indicate examples), and red somata show no overlap with these cells. At the level of the dendrites, small rosettes show overlap of red and bright green fluorescence, while the large rosettes of L cones (large circles) and M cones (small circles) were not filled (not red). No rod connectivity is visible, suggesting that these are H3-type HCs. Scale bars: 10 μm. B: filled HCs with a triphasic response profile (red) in a Cx55.5:GFP retina (green) showing no overlap of red and bright green HCs, indicating that the filled HCs are not H2-type HCs. At the level of the dendrites only punctuate labeling of filled dendrites can be seen, while large rosettes only show GFP labeling. Dendrites in rod synaptic terminals show overlap and also some dendrites inside smaller cone terminals (S or UV cones), suggesting that these are H4-type HCs. The inset shows a higher magnification of an S- and UV-cone terminal (bright green), an L-cone terminal, and 3 rod terminals. Scale bars: 10 μm. C: filled HCs with a triphasic response profile (red) in a Cx52.7:GFP retina (green) show complete overlap, indicating that the filled HCs are H4-type HCs. At the level of the dendrites punctuate labeling of filled dendrites can be seen, indicative of HC dendrites in rod synaptic terminals. One single H4-type HC appears not to be coupled to the other H4-type HCs (asterisk). Accidently a cone (arrow) was filled, showing red without green. Scale bars: 10 μm.

Similar articles

Cited by

References

    1. Alvarez-Delfin K, Morris AC, Snelson CD, Gamse JT, Gupta T, Marlow FL, Mullins MC, Burgess HA, Granato M, Fadool JM. Tbx2b is required for ultraviolet photoreceptor cell specification during zebrafish retinal development. Proc Natl Acad Sci USA 106: 2023–2028, 2009. - PMC - PubMed
    1. Atick JJ, Li Z, Redlich AN. Understanding retinal color coding from first principles. Vision Res 4: 559–572, 1992.
    1. Barish ME. A transient calcium-dependent chloride current in the immature Xenopus oocyte. J Physiol 342: 309–325, 1983. - PMC - PubMed
    1. Chalupa LM, Werner JS. The Visual Neurosciences. Cambridge, MA: MIT Press, 2003.
    1. Ciolofan C, Lynn BD, Wellershaus K, Willecke K, Nagy JI. Spatial relationships of connexin36, connexin57 and zonula occludens-1 in the outer plexiform layer of mouse retina. Neuroscience 148: 473–488, 2007. - PubMed

Publication types

MeSH terms

LinkOut - more resources