. 2016 Dec 2;291(49):25292-25305.
doi: 10.1074/jbc.M116.752865. Epub 2016 Oct 5.

Pre-T Cell Receptors (Pre-TCRs) Leverage Vβ Complementarity Determining Regions (CDRs) and Hydrophobic Patch in Mechanosensing Thymic Self-ligands

Affiliations

Pre-T Cell Receptors (Pre-TCRs) Leverage Vβ Complementarity Determining Regions (CDRs) and Hydrophobic Patch in Mechanosensing Thymic Self-ligands

Dibyendu Kumar Das et al. J Biol Chem. .

Abstract

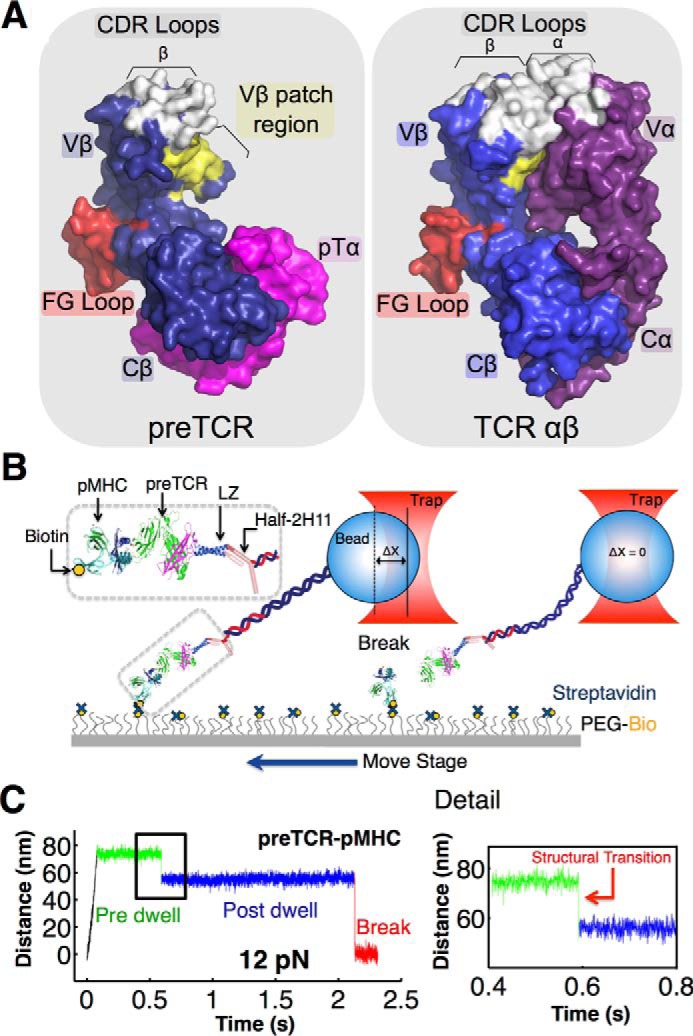
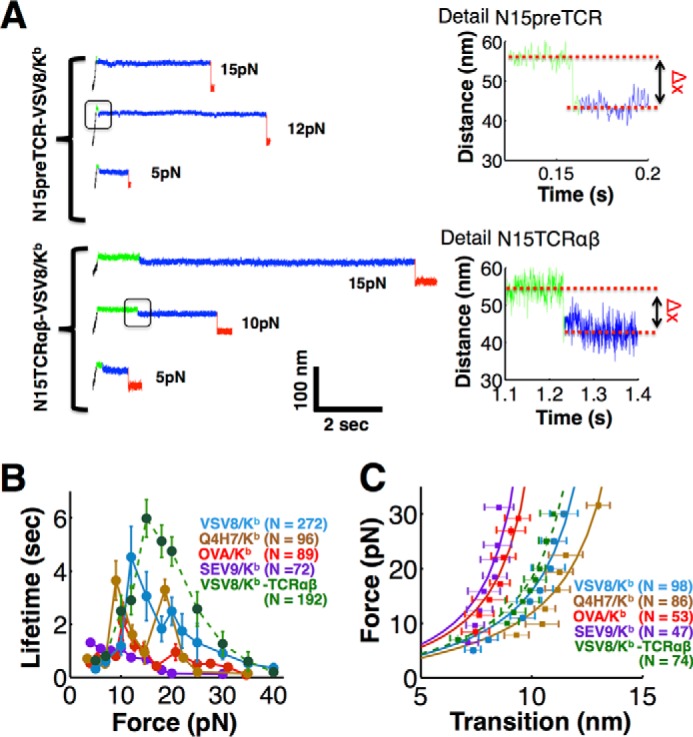
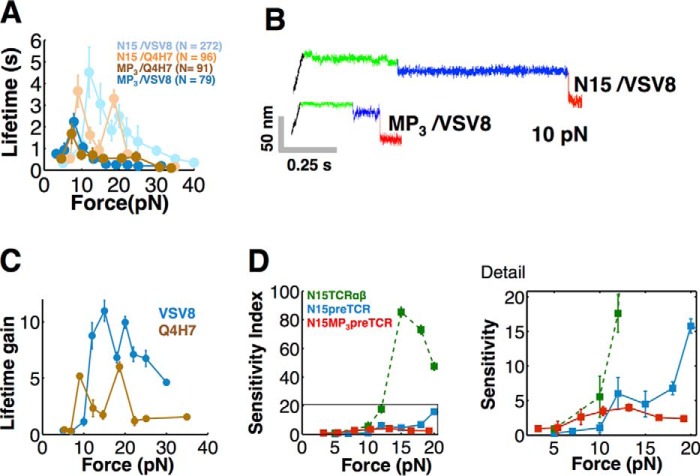
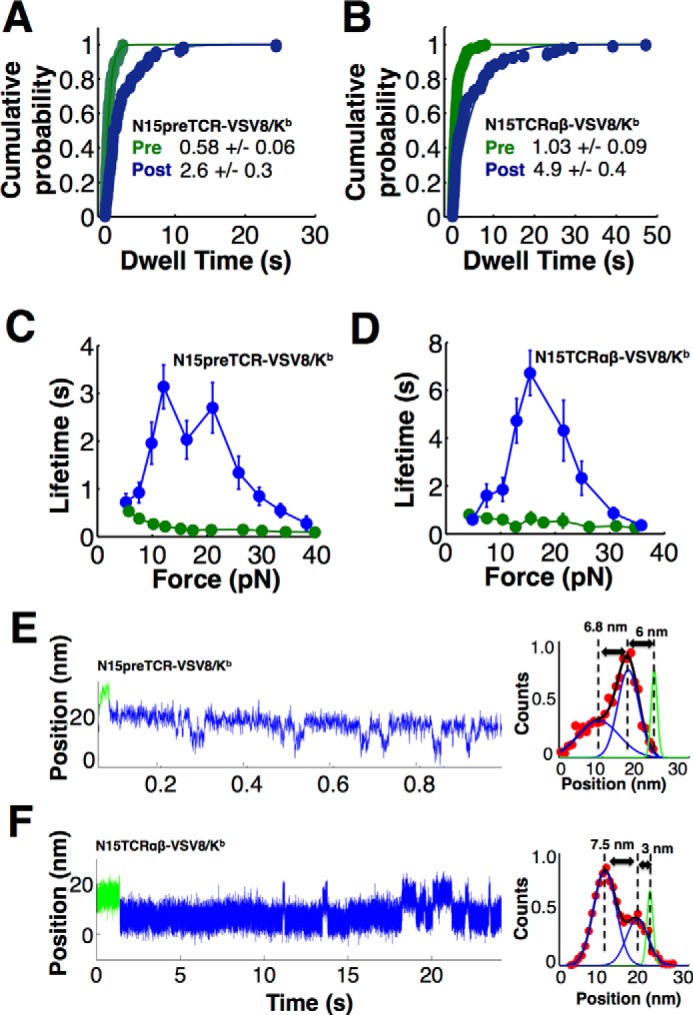
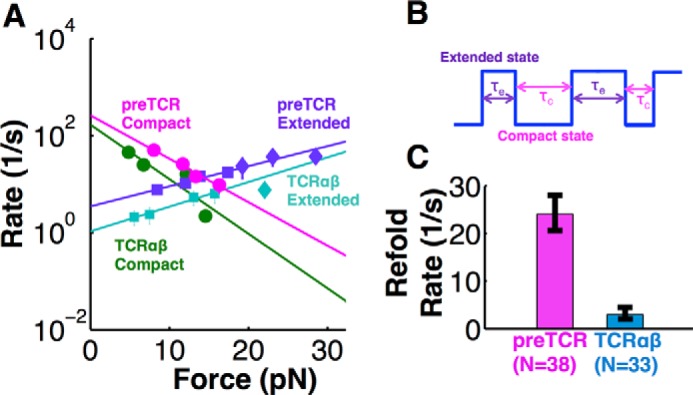
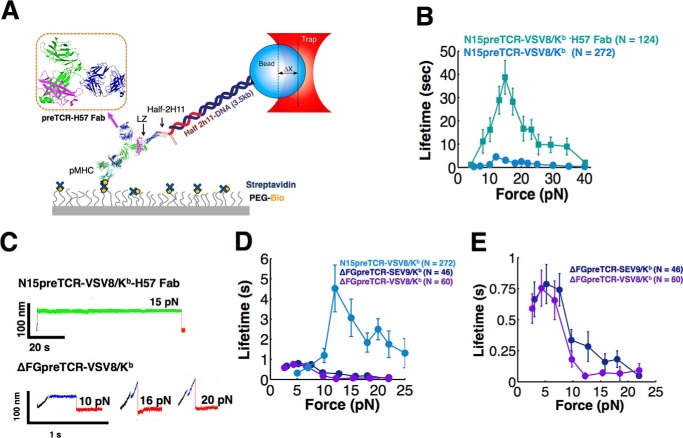
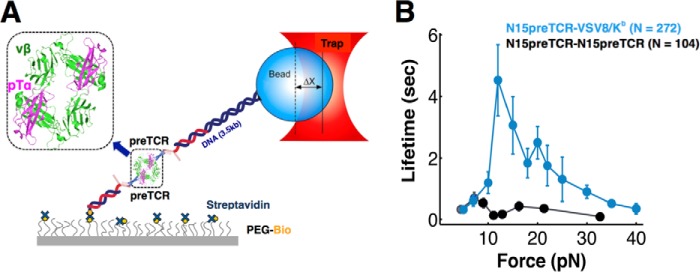
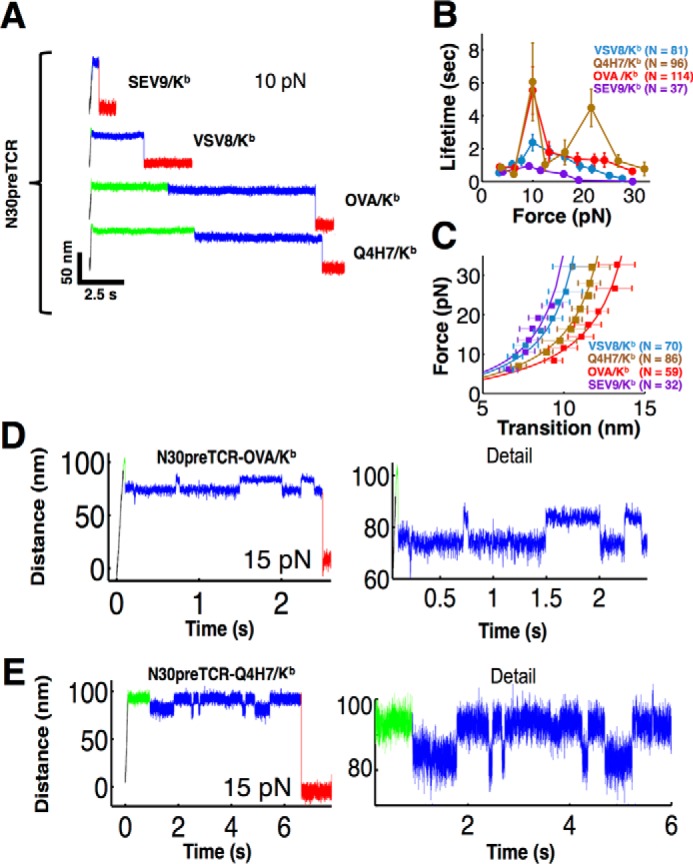
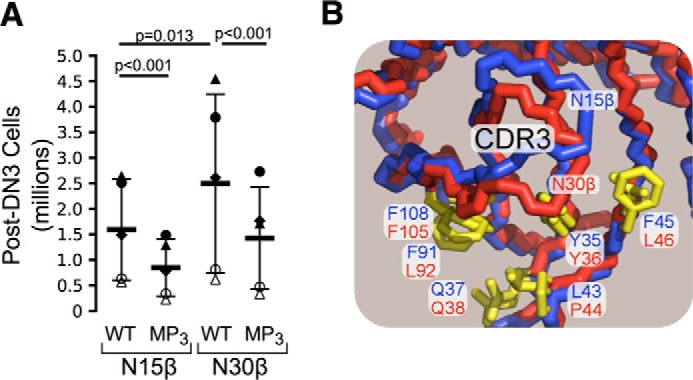
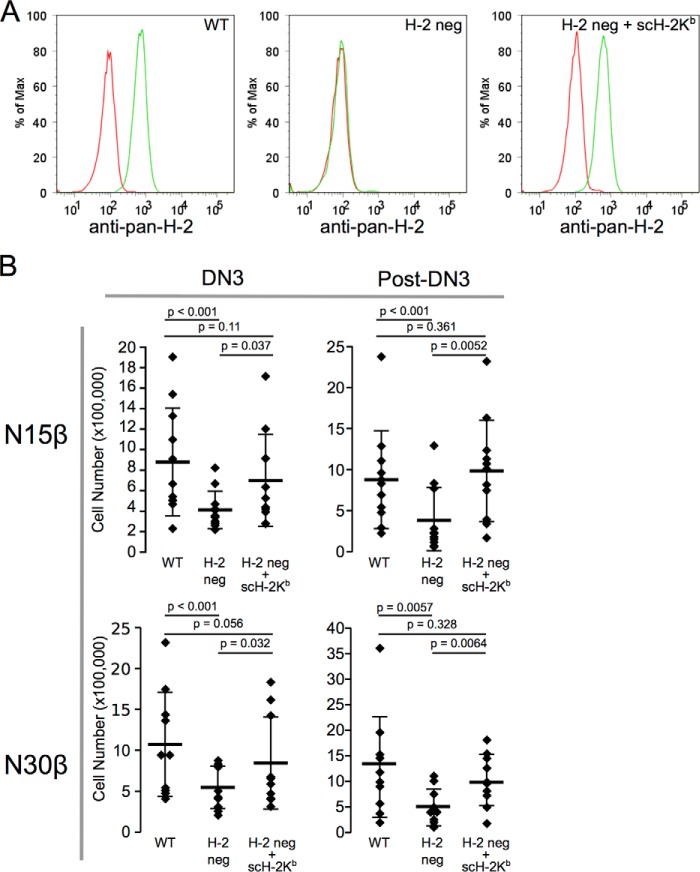
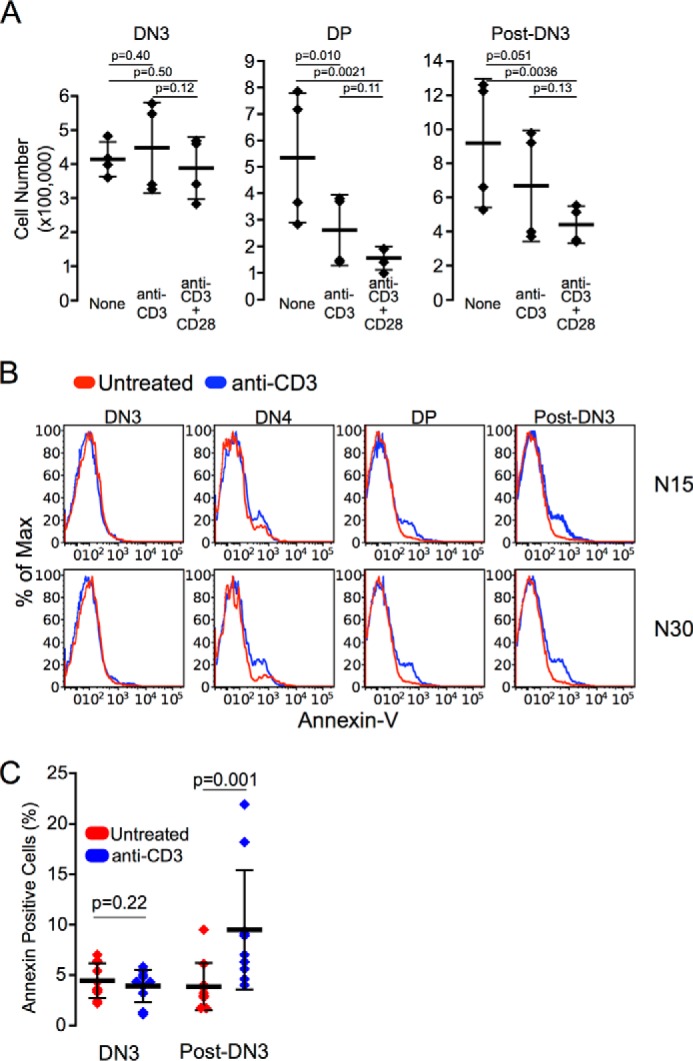
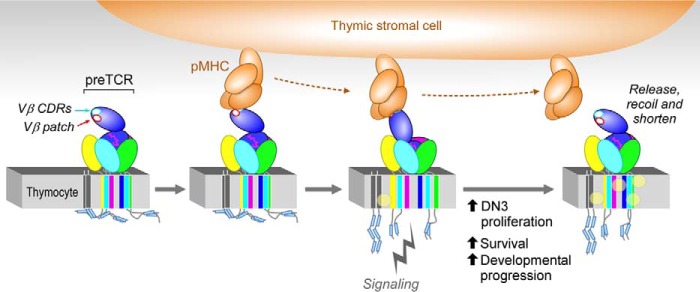
The pre-T cell receptor (pre-TCR) is a pTα-β heterodimer functioning in early αβ T cell development. Although once thought to be ligand-autonomous, recent studies show that pre-TCRs participate in thymic repertoire formation through recognition of peptides bound to major histocompatibility molecules (pMHC). Using optical tweezers, we probe pre-TCR bonding with pMHC at the single molecule level. Like the αβTCR, the pre-TCR is a mechanosensor undergoing force-based structural transitions that dynamically enhance bond lifetimes and exploiting allosteric control regulated via the Cβ FG loop region. The pre-TCR structural transitions exhibit greater reversibility than TCRαβ and ordered force-bond lifetime curves. Higher piconewton force requires binding through both complementarity determining region loops and hydrophobic Vβ patch apposition. This patch functions in the pre-TCR as a surrogate Vα domain, fostering ligand promiscuity to favor development of β chains with self-reactivity but is occluded by α subunit replacement of pTα upon αβTCR formation. At the double negative 3 thymocyte stage where the pre-TCR is first expressed, pre-TCR interaction with self-pMHC ligands imparts growth and survival advantages as revealed in thymic stromal cultures, imprinting fundamental self-reactivity in the T cell repertoire. Collectively, our data imply the existence of sequential mechanosensor αβTCR repertoire tuning via the pre-TCR.

Keywords: allosteric regulation; cell differentiation; cell surface receptor; crystallography; major histocompatibility complex (MHC); mechanobiology; nuclear magnetic resonance (NMR); optical tweezers; pre-T cell receptor; structural transition.


Figures

FIGURE 1.
FIGURE 1.
Single molecule assay for measuring pre-TCR/pMHC interaction. A, comparison of pre-TCR (left) and TCRαβ (right) extracellular domains. The pre-TCR contains three domains as follows: Cβ and Vβ (blue) and pTα (pink), an invariant partner much like the Cα domain. pMHC (not shown) interacts with Vβ CDR loops (white) and hydrophobic patch (yellow). The FG loop (red) buttresses the connection between Cβ and Vβ domains. The TCRαβ contains four domains, including additional CDR loops from Vα at the pMHC interacting surface. The patch is located at the dimerization interface of Vα with Vβ in TCRαβ. Figure was created using PyMOL (57) using Protein Data Bank entries 3OF6 (Pre-TCR) and 1NFD (TCRαβ). B, pre-TCR assay creates tethers between a pMHC bound through biotin streptavidin to a surface coated with a mixture of covalently attached PEG and PEG-biotin and a leucine zipper paired pTα-β heterodimer tethered to a bead through a 2H11 half-antibody linked to a 1-μm strand of DNA. The sample is moved and bead displacement is monitored in the trap exerting force on a tether until breakage. C, representative trace for pre-TCR/pMHC interactions. The tether is pulled to a fixed distance (black) where pre-dwell (green), post-dwell (blue), and tether break (red) features are observed. Details of the transition between pre- and post-dwell states show a structural transition of about 10 nm. Note that display of time-versus-distance plots is oriented in the opposite way to that of Ref. .
FIGURE 2.
FIGURE 2.
Pre-TCR manifests pMHC-dependent bond strengthening and structural transition. A, representative traces for the N15pre-TCR (top) and N15TCRαβ (bottom) pulling records with details of the transition (right) corresponding to the boxed area in the left trace. B, lifetime versus force plots for N15pre-TCR interacting with a variety of pMHC complexes (H-2Kb bound with indicated peptides) (solid colored traces). A two-peak structure is seen for VSV8 and Q4H7 compared with a single peak for the N15TCRαβ interacting with VSV8 (dashed green). C, force displacement plots for N15 receptors interacting with the Kb bound peptides shown in B. WLC fits were performed for N15pre-TCR conformational transitions for a series of pMHC interactions. The apparent contour lengths for N15pre-TCR were 17.1, 15.5, 12.6, and 11.9 nm for Q4H7, VSV8, OVA, and SEV9, respectively. A persistence length of 0.61 nm for an unfolded polypeptide was assumed in the fits. Although the WLC fits (solid lines in C) assume an unfolded polypeptide and extend to zero transition distance, they help to parameterize the overall structural transition observed in our pulling traces, spanning 6–15 nm, which can be due to multiple sources such as unfolding, domain rotation, and conformational change. B and C, points show mean ± S.E.
FIGURE 3.
FIGURE 3.
Patch region has significant influence on pre-TCR force-dependent bond strengthening. A, comparison of Vβ patch mutant N15 MP3pre-TCR (MP3) (dark curves) with wild-type N15pre-TCR (N15) (light curves) with indicated H-2Kb-bound peptides. The N15pre-TCR curves were taken from Fig. 2B for ease of overlay comparison of force bond lifetimes. B, representative traces comparing N15MP3pre-TCR to N15pre-TCR interacting with VSV8/Kb (VSV8) demonstrate reduced bond lifetime for the patch mutant. C, relative gain in lifetime due to the presence of patch region binding, comparing N15pre-TCR to N15MP3pre-TCR for VSV8/Kb (blue) and Q4H7/Kb (brown). Lifetime gain = (N15pre-TCR lifetime)/(N15MP3pre-TCR lifetime). D, sensitivity index (S.I = (bond lifetime with VSV8/Kb)/(bond lifetime with SEV9/Kb)) as a function of force for N15pre-TCR (blue), N15TCRαβ (green), and N15MP3pre-TCRmutant (red) with details of boxed area to the right. A, C, and D, points show mean ± S.E.
FIGURE 4.
FIGURE 4.
Bond strengthening for pre-TCR and TCRαβ occurs following the structural transition with reversible hopping of receptor molecules between states. A, pre-TCR cumulative probability for pre-dwell (green) and post-dwell (blue) distributions exhibit single exponential character with time constants (in seconds) shown. B, comparable TCRαβ cumulative probability analysis shows single exponential fitting. For both pre-TCR and TCRαβ, the post-dwell time is ∼5 times larger compared with the pre-dwell time. Force versus lifetime plots for pre-TCR (C) and TCRαβ (D) show bond strengthening in the post-transition state. Points show mean ± S.E. Representative traces at ∼10 pN showing reversible transitioning for pre-TCR (E) and TCRαβ (F). Position distributions (shown to the right of each panel) reveal the relative population of dwells in the compact or extended state under load. The initial location of the pre-dwell, prior to any extension, is indicated in green. The position distributions, which spans the reversible region of the trace shown in blue, is fit to the sum of two Gaussian distributions separated by the displacements indicated in the graph. A small displacement is typically observed between the initial green dwell location and the states that exhibit reversible transitioning. Force influences the relative probability of being in the more compact or extended state. E, system favors the more compact state. F, longer dwells are observed in the more extended state.
FIGURE 5.
FIGURE 5.
Kinetic analysis of reversible and single transitions. A, log of compact/extended rate versus force plots of reversible transitions (circles for compact, square for extended) and single transitions (diamonds) for VSV8/Kb with pre-TCR and TCRαβ. Points show mean ± S.E. In reversible transition, the rate of transitioning to the compact state (kc) for both the pre-TCR (events, n = 38) and TCRαβ (n = 33) decreases with force. The rate of extending (ke) increases with force for both pre-TCR (n = 41) and TCRαβ (n = 43). Plots are fitted using logarithmic equation of Bell model: k = k1exp(ΔxF/kbT) (Table 1). Compact and extended transition rates converge at a point, the equilibrium force, where faster rates are observed for the pre-TCR compared with TCRαβ. B, schematic profile of a reversible transition, showing hopping between compact and extended states with the compact rate (kc = 1/τe) and extended rate (ke = 1/τc), where τe is the lifetime of extended state, and τc is the lifetime of compact state. C, overall average refolding/compact rate (kc) for pre-TCR and TCRαβ with VSV8/Kb. Bars show mean ± S.E.
FIGURE 6.
FIGURE 6.
Cβ FG loop allosterically controls pTα-β heterodimer bond strength contributing to force-initiated dynamic signaling. A, single molecule assay showing stabilization of the pre-TCR-VSV8/Kb bond via the Cβ FG loop-specific H57 Fab. Box shows the schematic structural representation of pre-TCR·H57 Fab complex. This was created by visually overlaying TCRβ within PDB 1NFD onto TCRβ from PDB 3OF6 to place H57 onto the pre-TCR using PyMOL (57). B, H57 causes bond strengthening, revealed in force versus lifetime plot for VSV8/Kb. C, representative traces at indicated forces showing bond strengthening and sustained binding in H57 Fab (top trace) at 15 pN which typically do not exhibit a transition. In contrast, early transitioning is observed in the N15ΔFGpre-TCR-VSV8/Kb system (bottom traces). The transition is indicated by the green color followed by a post-transition state in blue. For the FG loop deletion, the transition occurs early in the pulling records, typically during the ramp phase. Rupture (red color) also occurs during the ramp phase for these records at 10, 16, and 20 pN. D, FG loop deletion in the N15pre-TCR (ΔFGpre-TCR) abolishes strengthened binding. The N15preTCR curve derives from Fig. 2B. E, ΔFGpre-TCR lacks ligand discrimination, with similar bond lifetimes with VSV8/Kb and SEV9/Kb. B, D, and E, points show mean ± S.E.
FIGURE 7.
FIGURE 7.
Direct test of dimerization interaction with surface and bead tethered pre-TCRs. A, single molecule assay for pre-TCR dimerization. B, comparison between N15pre-TCR/N15pre-TCR interaction (black) and N15pre-TCR/pMHC (blue) bond lifetimes over different forces. This comparison uses N15pre-TCR/pMHC data from Fig. 2B. Points show mean ± S.E.
FIGURE 8.
FIGURE 8.
Force-induced bond strengthening, structural transition, and reversible hopping are also seen in N30pre-TCR/pMHC interactions. A, representative traces of N30pre-TCR/pMHC interaction. Pulling records are at ∼10 pN for N30pre-TCR/pMHC interactions. Colors indicate the ramp phase (black), pre-dwell (green), post-dwell (blue), and rupture (red). The weak binding ligands SEV9/Kb and VSV8/Kb transition early in the trace, and the stronger interacting ligands OVA/Kb and Q4H7/Kb show more extended lifetime. B, lifetime versus force plots for N30pre-TCR interacting with a variety of pMHC complexes (H-2Kb bound with indicated peptides) (solid colored traces). A two-peak structure is seen for Q4H7 (orange). B and C, points show mean ± S.E. C, force versus extension plots for N30pre-TCR interacting with the peptides shown in B along with WLC fits. The apparent contour lengths for the N30pre-TCR were 17.6, 15.7, 13.8, and 12.9 nm for OVA, Q4H7, VSV8, and SEV9, respectively. Representative traces at ∼15 pN exhibiting reverse transitioning in the N30pre-TCR with OVA/Kb (D) and Q4H7/Kb (E). The full trace is shown (left) and detail (right).
FIGURE 9.
FIGURE 9.
Impact of hydrophobic patch on pre-TCR function. A, mutagenesis of patch residues in N15β or N30β produces defects in proliferation and development beyond DN3 stage (MP3). TCRβ-transduced rag2−/− fetal liver progenitor cells were cultured for 7 days in the OP9-DL4 stromal cell culture system, and development was followed as described (12). n = 5 independent experiments. Each of the five symbols corresponds to a separate experiment. Thick bars represent mean, and thin bars represent S.D. with p values indicated. B, CDR3 structural variability modulates patch access. Backbone trace of N15β (blue) and N30βTCR (red) shown from the approximate perspective of an approaching pMHC. Highlighted are side chain stick representations of hydrophobic patch region residues in yellow with labels of each residue in blue or red for N15β or N30β. PDB files 3Q5Y and 3Q5T were used for N15β and N30β, respectively.
FIGURE 10.
FIGURE 10.
Elimination of pMHC in stromal cell cultures causes defects in proliferation of DN3 thymocytes and progression beyond DN3. A, generation of H-2 class I-negative OP9-DL4 stromal cells and re-expression of VSV8/H-2Kb. Left panel, parental OP9-DL4 cells expressing H-2 class I (WT). Center panel, β2-microglobulin and tap2-deficient OP9-DL4 cells (H-2 neg). Right panel, H-2 neg cells transfected with single chain VSV8 β2m-H-2Kb (H-2 neg + sc-H-2Kb). For each FACS panel the red line indicates rat IgG isotype control, and the green line depicts staining with rat M1–42 pan-H-2 class I. B, N15 or N30β-transduced Rag2−/− fetal liver progenitor cells were cultured for 7–8 days in the OP9-DL4 stromal cell culture system with either WT, β2m/tap2 (H-2 neg), or H-2 neg transduced with sc-H-2Kb (H-2 neg + sc-H-2Kb) prior to analysis via FACS for cell numbers at DN3 or DN4, CD8ISP, and DP (post-DN3). For N15β, n = 11 independent experiments; for N30β, n = 10. Individual experimental results are shown with mean ± S.D. denoted as in Fig. 9.
FIGURE 11.
FIGURE 11.
Strong activation of pre-TCR results in no apoptosis or reduced cellularity at the DN3 stage of development. A, activation of pre-TCR-expressing thymocytes results in loss of cellularity only after progression past DN3 stage. TCRβ-transduced Rag2−/− progenitor cells were cultured for 6 days in the OP9-DL4 stromal cell culture system prior to transfer of equivalent numbers to plates coated with anti-CD3, anti-CD3 + anti-CD28 mAbs, or untreated control plates. After 24 h, thymocytes were analyzed for development and cell numbers. Post-DN3 represents DN4, CD8 immature single positive and DP cells. n = 4 independent experiments with all data points, mean and S.D., and p values provided. B, TCRβ-transduced (N15 or N30) cells were cultured for 3 days in the OP9-DL4 stromal cell culture system prior to transfer of equivalent numbers to plates coated with anti-CD3 mAb or untreated control plates. After 24 h, thymocytes were analyzed by FACS for development, viability, and annexin V levels. Representative traces are shown. C, annexin V-positive cells are more prevalent in pre-TCR-activated anti-CD3 treated cultures only after progression beyond DN3. B and C, n = 5 independent experiments. A and C, bars show mean ± S.D.
FIGURE 12.
FIGURE 12.
Model of force-initiated pre-TCR signaling. During chemokine-driven DN3 movement (from left to right), interaction of a pre-TCR on a thymocyte with self-pMHC on a stromal cell initiates via Vβ CDR3s (white oval with cyan circumference) resulting in formation of the first of two catch bonds, followed by conformational change, Vβ patch interaction (white oval with red circumference) forming the second catch bond at higher force and β chain extension. Subsequently, alterations of transmembrane segments, plasma membrane, and associated lipid constituents (yellow ball) occur. Immunoreceptor tyrosine-based activation module (blue cylinders) are released from the various CD3 subunits' cytoplasmic segments, with downstream signaling following Lck-mediated phosphorylation (not shown). Release, recoil, and shortening perpetuate membrane changes to prolong signaling. Note that extension of the pre-TCR/pMHC complex may include conformational change, domain rotation, and unfolding. Only a section of the thymocyte membrane is shown. CD3ζζ is in dark grey, pictured to the left for clarity. Other CD3 components are as follows: CD3δ (yellow), CD3γ (green), and CD3ϵ (mint) with a second CD3ϵ obscured in this view. The β subunit is in blue; pTα is in pink, and the Cβ FG loop is represented by the undulatory magenta lines.

References

    1. Wang J. H., and Reinherz E. L. (2012) The structural basis of αβ T-lineage immune recognition: TCR docking topologies, mechanotransduction, and co-receptor function. Immunol. Rev. 250, 102–119 - PMC - PubMed
    1. Rudolph M. G., Stanfield R. L., and Wilson I. A. (2006) How TCRs bind MHCs, peptides, and coreceptors. Annu. Rev. Immunol. 24, 419–466 - PubMed
    1. Yin L., Scott-Browne J., Kappler J. W., Gapin L., and Marrack P. (2012) T cells and their eons-old obsession with MHC. Immunol. Rev. 250, 49–60 - PMC - PubMed
    1. Goldrath A. W., and Bevan M. J. (1999) Selecting and maintaining a diverse T-cell repertoire. Nature 402, 255–262 - PubMed
    1. Ciofani M., and Zúñiga-Pflücker J. C. (2006) A survival guide to early T cell development. Immunol. Res. 34, 117–132 - PubMed

MeSH terms

Substances

LinkOut - more resources