

Disruption of Protein Processing in the Endoplasmic Reticulum of DYT1 Knock-in Mice Implicates Novel Pathways in Dystonia Pathogenesis
- PMID: 27707963
- PMCID: PMC5050323
- DOI: 10.1523/JNEUROSCI.0669-16.2016
Disruption of Protein Processing in the Endoplasmic Reticulum of DYT1 Knock-in Mice Implicates Novel Pathways in Dystonia Pathogenesis
Abstract
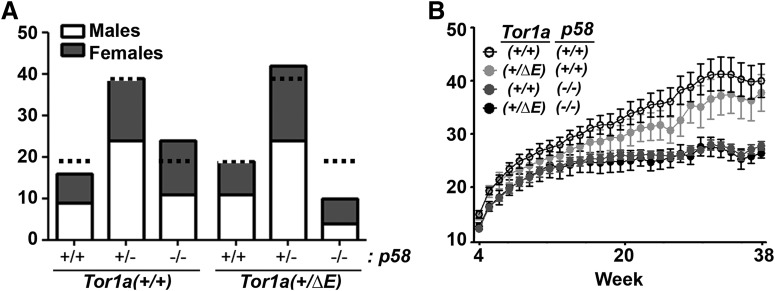
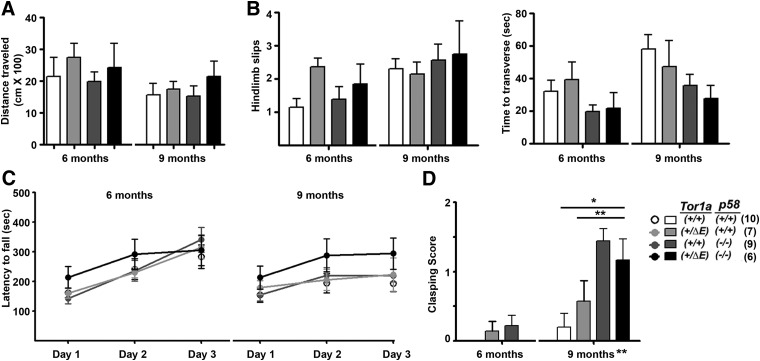
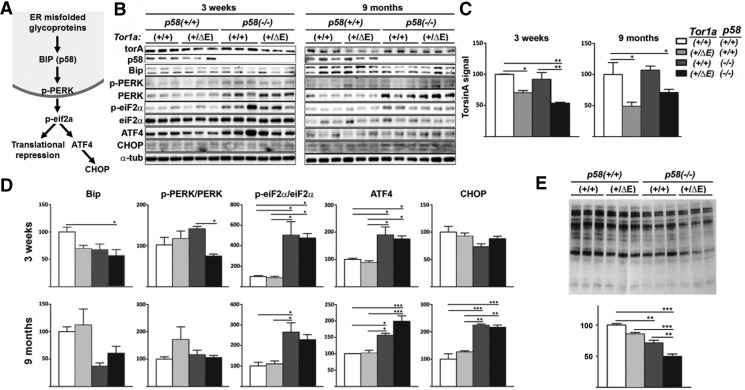
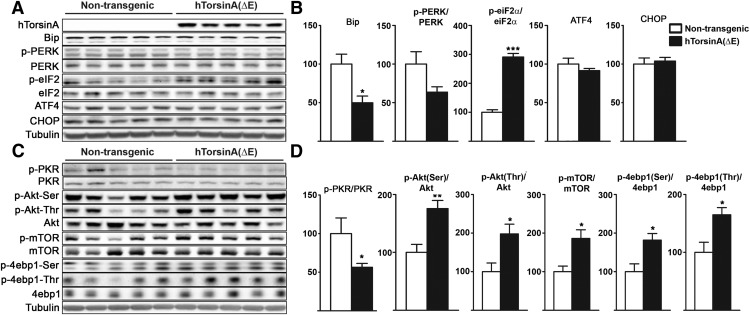
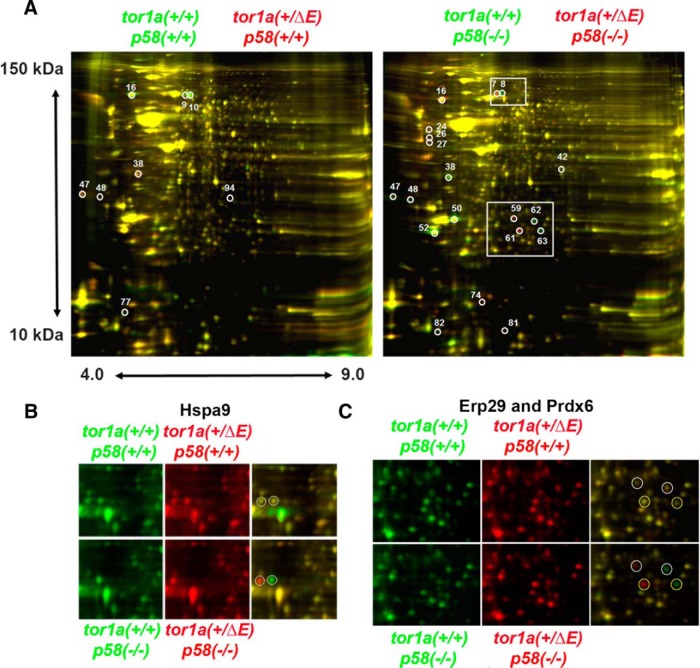
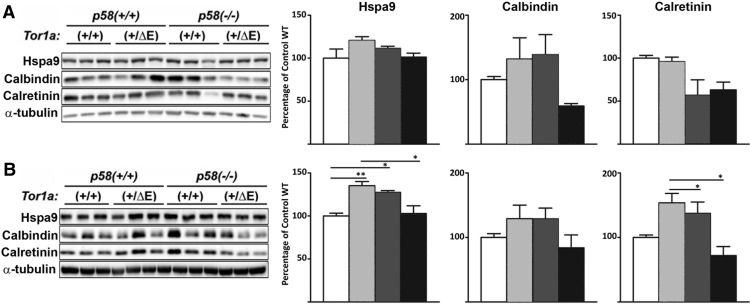
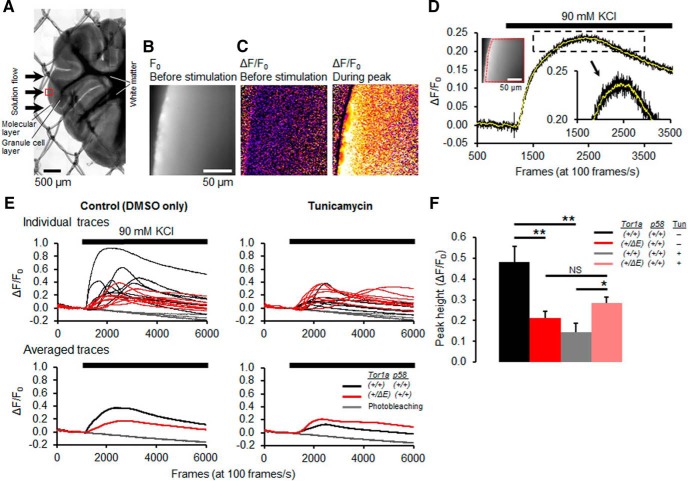
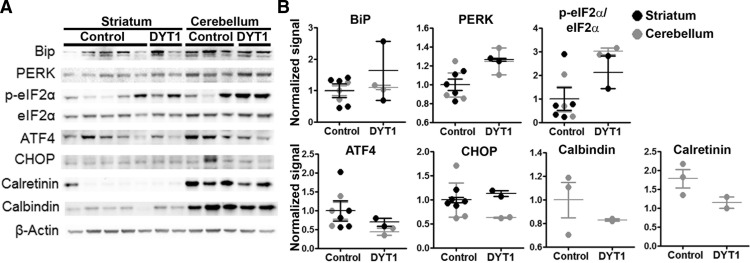
Dystonia type 1 (DYT1) is a dominantly inherited neurological disease caused by mutations in TOR1A, the gene encoding the endoplasmic reticulum (ER)-resident protein torsinA. Previous work mostly completed in cell-based systems suggests that mutant torsinA alters protein processing in the secretory pathway. We hypothesized that inducing ER stress in the mammalian brain in vivo would trigger or exacerbate mutant torsinA-induced dysfunction. To test this hypothesis, we crossed DYT1 knock-in with p58(IPK)-null mice. The ER co-chaperone p58(IPK) interacts with BiP and assists in protein maturation by helping to fold ER cargo. Its deletion increases the cellular sensitivity to ER stress. We found a lower generation of DYT1 knock-in/p58 knock-out mice than expected from this cross, suggesting a developmental interaction that influences viability. However, surviving animals did not exhibit abnormal motor function. Analysis of brain tissue uncovered dysregulation of eiF2α and Akt/mTOR translational control pathways in the DYT1 brain, a finding confirmed in a second rodent model and in human brain. Finally, an unbiased proteomic analysis identified relevant changes in the neuronal protein landscape suggesting abnormal ER protein metabolism and calcium dysregulation. Functional studies confirmed the interaction between the DYT1 genotype and neuronal calcium dynamics. Overall, these findings advance our knowledge on dystonia, linking translational control pathways and calcium physiology to dystonia pathogenesis and identifying potential new pharmacological targets.
Significance statement: Dystonia type 1 (DYT1) is one of the different forms of inherited dystonia, a neurological disorder characterized by involuntary, disabling movements. DYT1 is caused by mutations in the gene that encodes the endoplasmic reticulum (ER)-resident protein torsinA. How mutant torsinA causes neuronal dysfunction remains unknown. Here, we show the behavioral and molecular consequences of stressing the ER in DYT1 mice by increasing the amount of misfolded proteins. This resulted in the generation of a reduced number of animals, evidence of abnormal ER protein processing and dysregulation of translational control pathways. The work described here proposes a shared mechanism for different forms of dystonia, links for the first time known biological pathways to dystonia pathogenesis, and uncovers potential pharmacological targets for its treatment.
Keywords: dystonia; eif2alpha; endoplasmic reticulum; p58; proteomics; torsina.
Copyright © 2016 the authors 0270-6474/16/3610245-12$15.00/0.
Figures
Similar articles
-
Exploring the Interaction Between eIF2α Dysregulation, Acute Endoplasmic Reticulum Stress and DYT1 Dystonia in the Mammalian Brain.Neuroscience. 2018 Feb 10;371:455-468. doi: 10.1016/j.neuroscience.2017.12.033. Epub 2017 Dec 28. Neuroscience. 2018. PMID: 29289717
-
The early-onset torsion dystonia-associated protein, torsinA, is a homeostatic regulator of endoplasmic reticulum stress response.Hum Mol Genet. 2010 Sep 15;19(18):3502-15. doi: 10.1093/hmg/ddq266. Epub 2010 Jun 28. Hum Mol Genet. 2010. PMID: 20584926 Free PMC article.
-
Inhibition of endoplasmic reticulum stress reverses synaptic plasticity deficits in striatum of DYT1 dystonia mice.Aging (Albany NY). 2021 Aug 16;13(16):20319-20334. doi: 10.18632/aging.203413. Epub 2021 Aug 16. Aging (Albany NY). 2021. PMID: 34398825 Free PMC article.
-
Advances in molecular and cell biology of dystonia: Focus on torsinA.Neurobiol Dis. 2019 Jul;127:233-241. doi: 10.1016/j.nbd.2019.03.007. Epub 2019 Mar 12. Neurobiol Dis. 2019. PMID: 30877032 Review.
-
The role of torsinA in dystonia.Eur J Neurol. 2010 Jul;17 Suppl 1:81-7. doi: 10.1111/j.1468-1331.2010.03057.x. Eur J Neurol. 2010. PMID: 20590813 Review.
Cited by
-
Transcriptomic analysis of LMH cells in response to the overexpression of a protein of Eimeria tenella encoded by the locus ETH_00028350.Front Vet Sci. 2022 Nov 21;9:1053701. doi: 10.3389/fvets.2022.1053701. eCollection 2022. Front Vet Sci. 2022. PMID: 36478946 Free PMC article.
-
DYT-PRKRA Mutation P222L Enhances PACT's Stimulatory Activity on Type I Interferon Induction.Biomolecules. 2022 May 17;12(5):713. doi: 10.3390/biom12050713. Biomolecules. 2022. PMID: 35625640 Free PMC article.
-
eIF2α phosphorylation evokes dystonia-like movements with D2-receptor and cholinergic origin and abnormal neuronal connectivity.bioRxiv [Preprint]. 2024 May 15:2024.05.14.594240. doi: 10.1101/2024.05.14.594240. bioRxiv. 2024. PMID: 38798458 Free PMC article. Preprint.
-
A role for cerebellum in the hereditary dystonia DYT1.Elife. 2017 Feb 15;6:e22775. doi: 10.7554/eLife.22775. Elife. 2017. PMID: 28198698 Free PMC article.
-
Emerging and converging molecular mechanisms in dystonia.J Neural Transm (Vienna). 2021 Apr;128(4):483-498. doi: 10.1007/s00702-020-02290-z. Epub 2021 Jan 1. J Neural Transm (Vienna). 2021. PMID: 33386558 Review.
References
-
- Charlesworth G, Plagnol V, Holmström KM, Bras J, Sheerin UM, Preza E, Rubio-Agusti I, Ryten M, Schneider SA, Stamelou M, Trabzuni D, Abramov AY, Bhatia KP, Wood NW. Mutations in ANO3 cause dominant craniocervical dystonia: ion channel implicated in pathogenesis. Am J Hum Genet. 2012;91:1041–1050. doi: 10.1016/j.ajhg.2012.10.024. - DOI - PMC - PubMed
Publication types
MeSH terms
Substances
Grants and funding
LinkOut - more resources
Full Text Sources
Other Literature Sources
Medical
Molecular Biology Databases
Miscellaneous