. 2016 Oct 5;36(40):10404-10415.
doi: 10.1523/JNEUROSCI.2066-16.2016.

Glutamate Clearance Is Locally Modulated by Presynaptic Neuronal Activity in the Cerebral Cortex

Affiliations

Glutamate Clearance Is Locally Modulated by Presynaptic Neuronal Activity in the Cerebral Cortex

Moritz Armbruster et al. J Neurosci. .

Abstract

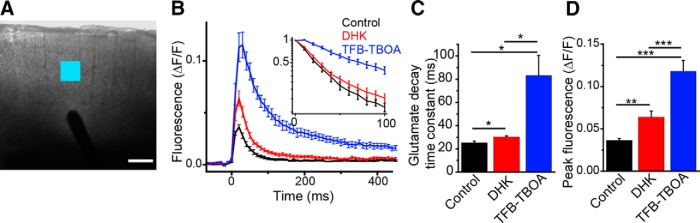
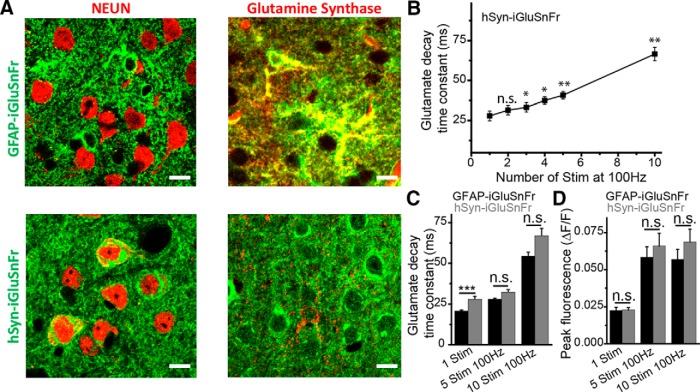
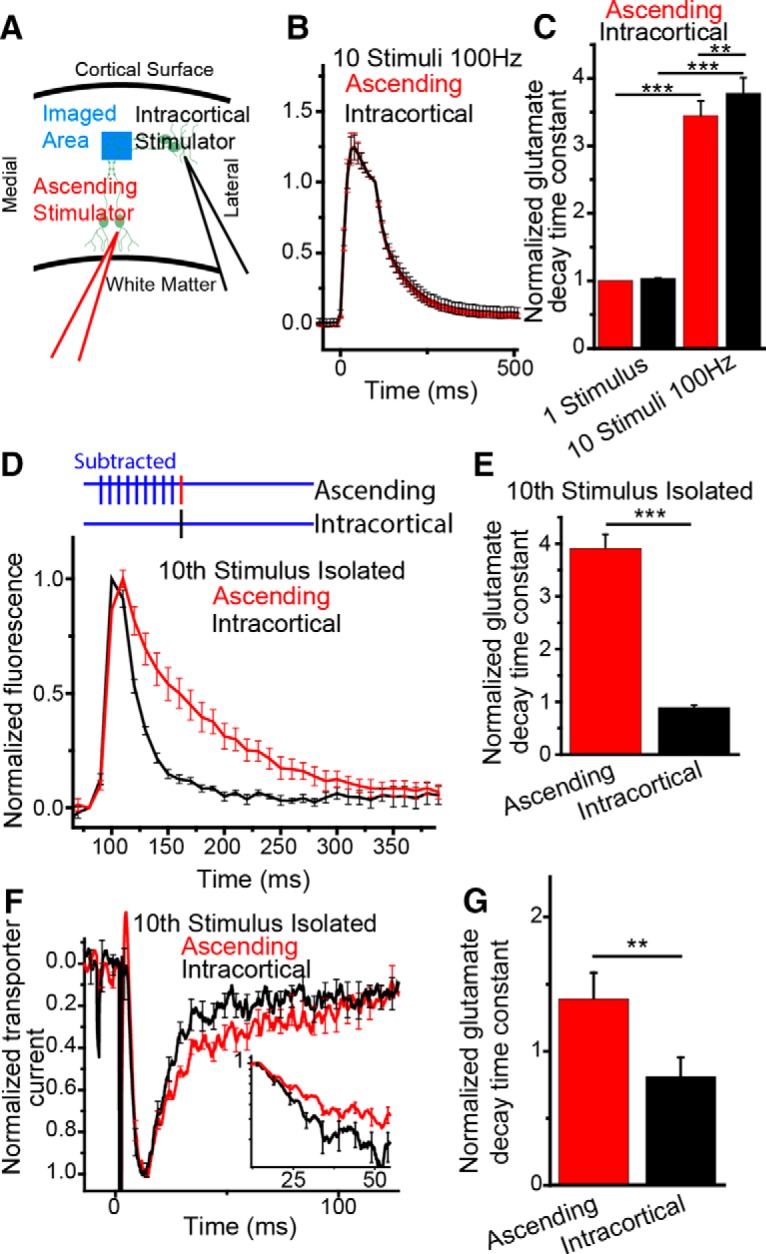
Excitatory amino acid transporters (EAATs) are abundantly expressed by astrocytes, rapidly remove glutamate from the extracellular environment, and restrict the temporal and spatial extent of glutamate signaling. Studies probing EAAT function suggest that their capacity to remove glutamate is large and does not saturate, even with substantial glutamate challenges. In contrast, we report that neuronal activity rapidly and reversibly modulates EAAT-dependent glutamate transport. To date, no physiological manipulation has shown changes in functional glutamate uptake in a nonpathological state. Using iGluSnFr-based glutamate imaging and electrophysiology in the adult mouse cortex, we show that glutamate uptake is slowed up to threefold following bursts of neuronal activity. The slowing of glutamate uptake depends on the frequency and duration of presynaptic neuronal activity but is independent of the amount of glutamate released. The modulation of glutamate uptake is brief, returning to normal within 50 ms after stimulation ceases. Interestingly, the slowing of glutamate uptake is specific to activated synapses, even within the domain of an individual astrocyte. Activity-induced slowing of glutamate uptake, and the increased persistence of glutamate in the extracellular space, is reflected by increased decay times of neuronal NR2A-mediated NMDA currents. These results show that astrocytic clearance of extracellular glutamate is slowed in a temporally and spatially specific manner following bursts of neuronal activity ≥30 Hz and that these changes affect the neuronal response to released glutamate. This suggests a previously unreported form of neuron-astrocyte interaction.

Significance statement: We report the first fast, physiological modulation of astrocyte glutamate clearance kinetics. We show that presynaptic activity in the cerebral cortex increases the persistence of glutamate in the extracellular space by slowing its clearance by astrocytes. Because of abundant EAAT expression, glutamate clearance from the extracellular space has been thought to have invariant kinetics. While multiple studies report experimental manipulations resulting in altered EAAT expression, our findings show that astrocytic glutamate uptake is dynamic on a fast time-scale. This shows rapid plasticity of glutamate clearance, which locally modulates synaptic signaling in the cortex. As astrocytic glutamate uptake is a fundamental and essential mechanism for neurotransmission, this work has implications for neurotransmission, extrasynaptic receptor activation, and synaptic plasticity.

Keywords: activity; astrocyte; cortex; glutamate; glutamate uptake.


Figures

Figure 1.
Figure 1.
iGluSnFr assay of stimulus evoked glutamate transients. A, Representative 4× bright-field image showing placement of stimulus electrode in the deep cortical layers and imaged area in layer II/III of the cortex (blue square). Scale bar, 250 μm. B, Average fluorescence response using hSyn-iGluSnFr imaging to a single electrical stimulus. Inset, Semilog plot of poststimulus decay. C, Poststimulus glutamate decay was slowed by DHK and TFB-TBOA for a single stimulus; N = 7 slices. D, Peak fluorescence was significantly increased with DHK and TFB-TBOA; N = 8 slices. Statistical tests: paired t tests. *α = 0.05 (Holm–Bonferroni multiple-comparison correction). **α = 0.01 (Holm–Bonferroni multiple-comparison correction). ***α = 0.001 (Holm–Bonferroni multiple-comparison correction).
Figure 2.
Figure 2.
Stimulus-dependent slowing of glutamate clearance. A, Average traces of GFAP-iGluSnFr with responses to 1, 2, 3, 4, 5, and 10 stimuli at 100 Hz, normalized to 1 stim response, show a stimulus-dependent slowing of glutamate clearance. B, Exponential decay time constants of glutamate clearance; N = 7 slices. C, The 10th stimulus in a 100 Hz train is isolated by subtracting the previous 9 stimuli and compared with a single stimulus. D, The isolated 10th stimulus shows significant slowing compared with a single stimulus; N = 17 slices. E, Average glutamate transporter currents recorded from whole-cell patch-clamped astrocytes show similar stimulus-dependent slowing of glutamate clearance for 1 and 10 stimuli at 100 Hz. F, Exponential decay time constants of glutamate transporter currents; N = 6 cells. G, The 10th stimulus in a 100 Hz train of GTCs isolated by subtracting the previous 9 stimuli and compared with a single stimulus. H, The isolated 10th stimulus is significantly slowed compared with a single stimulus; N = 7 cells. Statistical tests: paired t tests. *α = 0.05 (Holm–Bonferroni multiple-comparison correction). **α = 0.01 (Holm–Bonferroni multiple-comparison correction). ***α = 0.001 (Holm–Bonferroni multiple-comparison correction).
Figure 3.
Figure 3.
Slowing of glutamate clearance is independent of the amount of glutamate released. A, Single slice example trace of GFAP-iGluSnFR response to a single stimulus for control and the adensosine A1-receptor agonist CPA, normalized to 1 stim control. B, Average normalized traces to a single stimulus for control or CPA. C, Time constants of glutamate clearance are unchanged by the application of CPA for 1, 5, or 10 stimuli at 100 Hz. Statistical tests: Wilcoxon signed rank test. D, Average GFAP-iGluSnFr response in TFB-TBOA with control or CPA to characterize the amount of glutamate released in response to a single stimulus. E, Amount of glutamate released is quantified in TFB-TBOA, normalized to a single stimulus for 1, 5, or 10 stimuli at 100 Hz with or without CPA showing significant reductions in glutamate release with CPA; N = 11 slices. F, Single slice example trace of GFAP-iGluSnFR response to a single stimulus for control of the adenosine A1-receptor antagonist DPCPX, normalized to control. G, Average normalized traces to a single stimulus for control or DPCPX. H, Time constants of glutamate clearance are unchanged by the application of DPCPX for 1, 5, and 10 stimuli at 100 Hz. Statistical tests: paired t tests. N = 11, N = 10, and N = 11 slices, respectively. I, Average GFAP-iGluSnFr response in TFB-TBOA with control or DPCPX to characterize the amount of glutamate released in response to a single stimulus. J, Glutamate release is significantly increased with DPCPX for 1, 5, and 10 stimuli at 100 Hz. Statistical tests: paired t tests. N = 11, N = 10, and N = 11 slices, respectively. *α = 0.05 (Holm–Bonferroni multiple-comparison correction). **α = 0.01 (Holm–Bonferroni multiple-comparison correction). ***α = 0.001 (Holm–Bonferroni multiple-comparison correction).
Figure 4.
Figure 4.
Stimulus-dependent slowing of glutamate uptake affects glutamate signals seen using neuronal expression of iGluSnFr. A, High-magnification immunofluorescent images of cortices infected with either the GFAP-iGluSnFr (top) or the hSyn-iGluSnFr (bottom) coimmunolabeled with anti-GFP and either a neuronal (NEUN, left) or astrocytic (glutamine synthase, right) marker. Scale bar, 10 μm. B, Response of hSyn-iGluSnFr to different number of stimuli at 100 Hz, showing similar slowing as GFAP-iGluSnFr (Fig. 2B). N = 6 slices. Statistical tests: paired t tests. C, Poststimulus glutamate clearance decay time constant is slower in hSyn-iGluSnFr compared with GFAP-iGluSnFr for 1 stimuli, but not for 5 and 10 stimuli at 100 Hz. Statistical tests: Mann–Whitney test. D, Peak fluorescence shows no significant differences between the GFAP and hSyn-iGluSnFr reporters. Statistical tests: Mann–Whitney test. N = 23 and N = 18 slices for GFAP and hSyn-iGluSnFr, respectively; 15 slices for 5 stim hSyn-iGluSnFr. *α = 0.05 (Holm–Bonferroni multiple-comparison correction). **α = 0.01 (Holm–Bonferroni multiple-comparison correction). ***α = 0.001 (Holm–Bonferroni multiple-comparison correction).
Figure 5.
Figure 5.
Stimulus number and frequency dependence of glutamate clearance. Average GFAP-iGluSnFr traces for 5 and 10 stimuli are compared with a single stimulus for 10 Hz (A), 30 Hz (B), 60 Hz (C), and 100 Hz (D) stimulation. For glutamate accumulation during the stimulus train, see also Figure S7A (available at www.jneurosci.org as supplemental material). E, The 10 Hz shows no change in the poststimulus glutamate clearance time constant; meanwhile, 30, 60, and 100 Hz stimulation shows slowing of poststimulus glutamate time constant compared with both a single stimulus and with increasing stimulus number. Statistical tests: paired t tests. *α = 0.05 (Holm–Bonferroni multiple-comparison correction). ***α = 0.001 (Holm–Bonferroni multiple-comparison correction). N = 9, N = 18, N = 9, and N = 23 slices for 10, 30, 60, and 100 Hz, respectively. F, Scatterplot of the amount of glutamate at the end of stimulus plotted against the poststimulus glutamate decay time constant. There was no correlation of extracellular glutamate and decay time constant. Dashed gray line indicates identity line.
Figure 6.
Figure 6.
Recovery of glutamate clearance is rapid after cessation of high-frequency activity. A, The 10th stimulus of a train is isolated by subtracting recordings of the previous 9 stimuli. The 10th stimulus is delayed by 10, 50, or 100 ms following the ninth stimulus. Average GFAP-iGluSnFr trace of the isolated 10th stimulus. B, Time constant of glutamate clearance for the isolated 10th stimulus shown, normalized to the decay time constant in response to a single stimulus. The 10th stimulus is significantly slowed with a 10 ms delay, compared with a 50 or 100 ms delay; N = 18 slices. Statistical tests: paired t tests. ***α = 0.001 (Holm–Bonferroni multiple-comparison correction).
Figure 7.
Figure 7.
Glutamate clearance slowing is locally modulated. A, Layout of two stimulators activating ascending or intracortical inputs into layer II/III of the cortex. B, Average normalized GFAP-iGluSnFr response to ascending or intracortical stimulation with 10 stimuli at 100 Hz; N = 17 slices. C, Glutamate clearance slows similarly for the ascending and intracortical inputs, normalized to 1 stimulus on the ascending stimulator; N = 17 slices. Statistical tests: paired t tests. Significance determined with Holm–Bonferroni multiple-comparison correction. D, Nine stimuli at 100 Hz are given to the ascending inputs followed either by a 10th stimulus to the ascending stimulator or the intracortical stimulator. The 10th stimulus is isolated by subtracting recordings of the 9 stimuli train. Average GFAP-iGluSnFr response of the ascending and intracortical 10th stimulus; N = 7 slices. E, Glutamate clearance time constant normalized to 1 stimulus on the ascending stimulator shows significant differences in decay of the 10th stimulus for the ascending and intracortical inputs. Statistical tests: paired t tests. N = 17 slices. F, Astrocyte GTC recording with the same stimulus paradigm as in D; traces are TFB-TBOA subtracted. Average GTC traces shown; N = 11 cells. G, GTC decay times normalized to a single stimulus (ascending input) show significant difference between the ascending and intracortical 10th stimulus decays; N = 11 cells (Wilcoxon signed rank test). **α = 0.01; ***α = 0.001.
Figure 8.
Figure 8.
NR2A-NMDA EPSC decays are slowed by presynaptic stimulation with similar stimulus and frequency dependence to glutamate uptake slowing. A, Representative traces of NR2A-specific NMDA receptor EPSCs in response to 1, 5, or 10 stimuli at 100 Hz. B, NR2A NMDA EPSC decays show significant slowing with increased stimuli number; N = 5 cells. The slowing correlates (linear regression in red R2 = 0.96) with the slowing of glutamate clearance as assayed by GFAP-iGluSnFr (data from Fig. 5). Statistical tests: log-corrected paired t tests. Significance determined with Holm–Bonferroni multiple-comparison correction. C, Representative traces of NR2A-specific NMDA receptor EPSCs in response to 1 or 5 stimuli at 10, 30, or 100 Hz. D, NR2A-specific NMDA EPSC decays are plotted on a semilog plot, highlighting the frequency dependence of the decays. E, NR2A NMDA EPSC decays show significant slowing at 5 stimuli 30 Hz and 100 Hz compared with 1 stimuli, but not at 10 Hz. F, NR2A NMDA EPSC decays normalized to the decay in response to a single stimulus, highlighting the stimulus-dependent slowing of the decays. Statistical tests: paired t tests. *α = 0.05 (Holm–Bonferroni multiple-comparison correction). **α = 0.01 (Holm–Bonferroni multiple-comparison correction). ***α = 0.001 (Holm–Bonferroni multiple-comparison correction). N = 10 cells.

Similar articles

Cited by

References

    1. Afzalov R, Pryazhnikov E, Shih PY, Kondratskaya E, Zobova S, Leino S, Salminen O, Khiroug L, Semyanov A. Low micromolar Ba(2+) potentiates glutamate transporter current in hippocampal astrocytes. Front Cell Neurosci. 2013;7:135. doi: 10.3389/fncel.2013.00135. - DOI - PMC - PubMed
    1. Armbruster M, Hampton D, Yang Y, Dulla CG. Laser-scanning astrocyte mapping reveals increased glutamate-responsive domain size and disrupted maturation of glutamate uptake following neonatal cortical freeze-lesion. Front Cell Neurosci. 2014;8:277. doi: 10.3389/fncel.2014.00277. - DOI - PMC - PubMed
    1. Arnth-Jensen N, Jabaudon D, Scanziani M. Cooperation between independent hippocampal synapses is controlled by glutamate uptake. Nat Neurosci. 2002;5:325–331. doi: 10.1038/nn825. - DOI - PubMed
    1. Arriza JL, Fairman WA, Wadiche JI, Murdoch GH, Kavanaugh MP, Amara SG. Functional comparisons of three glutamate transporter subtypes cloned from human motor cortex. J Neurosci. 1994;14:5559–5569. - PMC - PubMed
    1. Bergles DE, Jahr CE. Synaptic activation of glutamate transporters in hippocampal astrocytes. Neuron. 1997;19:1297–1308. doi: 10.1016/S0896-6273(00)80420-1. - DOI - PubMed

Publication types

Substances

LinkOut - more resources