. 2017 Jan;72(1):128-136.
doi: 10.1093/jac/dkw383. Epub 2016 Oct 5.

Short- and long-term effects of oral vancomycin on the human intestinal microbiota

Affiliations

Short- and long-term effects of oral vancomycin on the human intestinal microbiota

Sandrine Isaac et al. J Antimicrob Chemother. 2017 Jan.

Abstract

Background: Oral vancomycin remains the mainstay of therapy for severe infections produced by Clostridium difficile, the most prevalent cause of healthcare-associated infectious diarrhoea in developed countries. However, its short- and long-term effects on the human intestinal microbiota remain largely unknown.

Methods: We utilized high-throughput sequencing to analyse the effects of vancomycin on the faecal human microbiota up to 22 weeks post-antibiotic cessation. The clinical relevance of the observed microbiota perturbations was studied in mice.

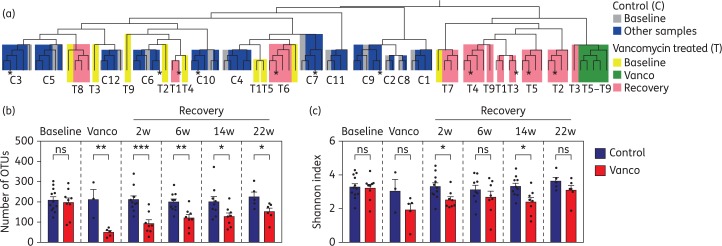
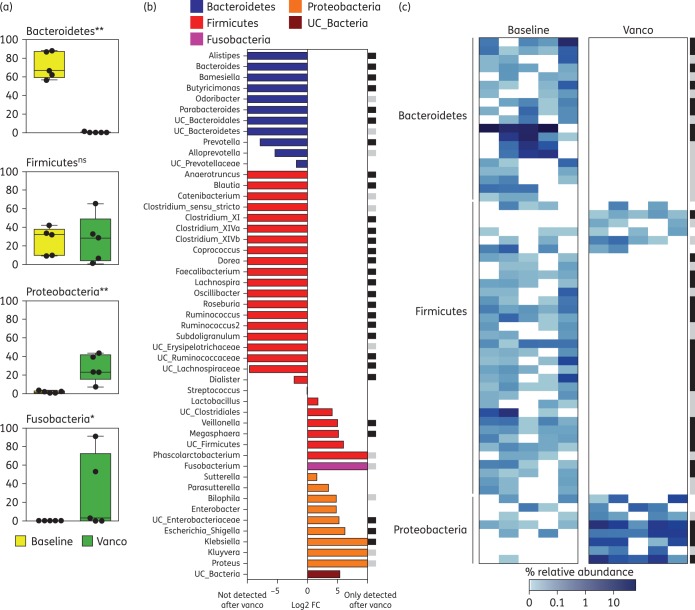
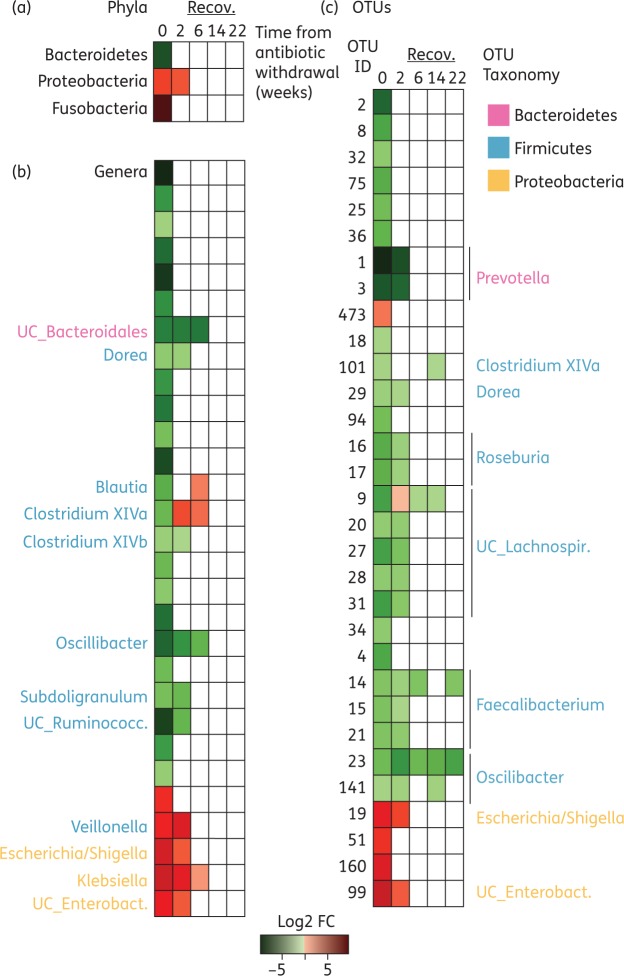
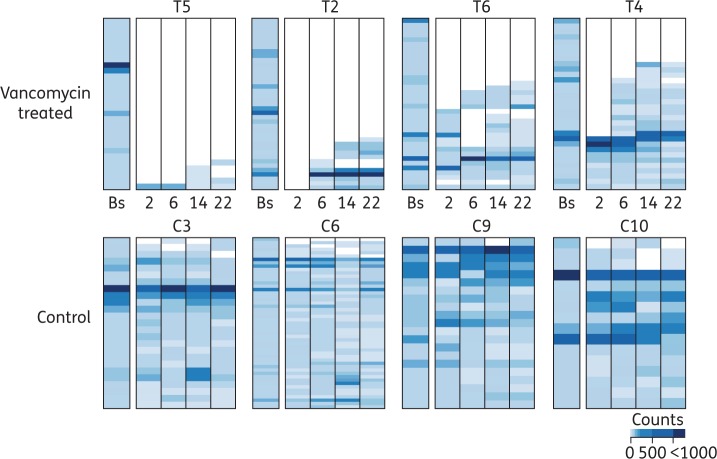
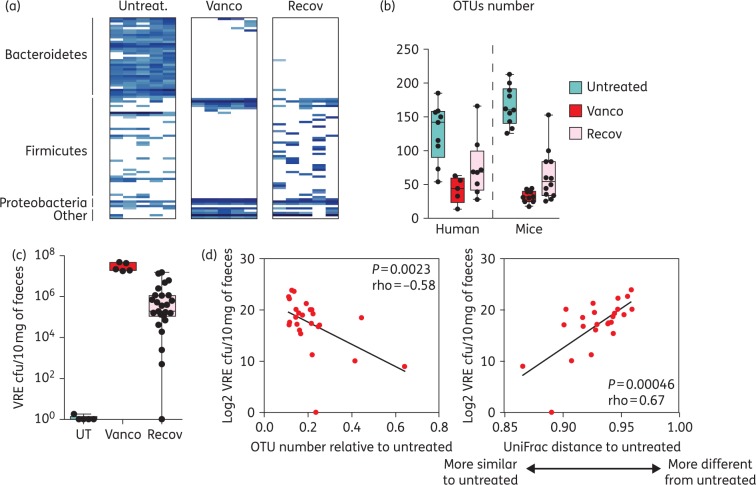
Results: During vancomycin therapy, most intestinal microbiota genera and operational taxonomic units (OTUs) were depleted in all analysed subjects, including all baseline OTUs from the phylum Bacteroidetes. This was accompanied by a vast expansion of genera associated with infections, including Klebsiella and Escherichia/Shigella. Following antibiotic cessation, marked differences in microbiota resilience were observed among subjects. While some individuals recovered a microbiota close to baseline composition, in others, up to 89% of abundant OTUs could no longer be detected. The clinical relevance of the observed microbiota changes was further demonstrated in mice, which developed analogous microbiota alterations. During vancomycin treatment, mice were highly susceptible to intestinal colonization by an antibiotic-resistant pathogen and, upon antibiotic cessation, a less-resilient microbiota allowed higher levels of pathogen colonization.

Conclusions: Oral vancomycin induces drastic and consistent changes in the human intestinal microbiota. Upon vancomycin cessation, the microbiota recovery rate varied considerably among subjects, which could influence, as validated in mice, the level of susceptibility to pathogen intestinal colonization. Our results demonstrate the negative long-term effects of vancomycin, which should be considered as a fundamental aspect of the cost-benefit equation for antibiotic prescription.


Figures

Figure 1.
Figure 1.
Vancomycin induces persistent changes in the structure and richness of the human microbiota. Patients received vancomycin treatment for 2 weeks (T, vancomycin treated) or did not receive vancomycin (C, control group). Faecal samples were obtained immediately before treatment (Baseline), the day of antibiotic cessation (Vanco), and 2, 6, 14 and 22 weeks (w) after antibiotic cessation (Recovery). As control, faecal samples from patients that did not receive vancomycin were obtained at similar timepoints. (a) Hierarchical clustering based on microbiota similarity (see the supplementary methods) among the faecal samples analysed from vancomycin-treated and control patients. Samples with a more similar microbiota are clustered within the same branch of the tree. Colours indicate the time frame where the faecal sample was obtained. Numbers indicate the patient ID. Those samples obtained at the last timepoint (22 weeks post-antibiotic withdrawal) are labelled with asterisks. (b) Number of OTUs (a close estimate of bacterial species) and (c) Shannon index of microbial diversity calculated from the microbiota of faecal samples collected at baseline and at different timepoints after vancomycin treatment. For comparison, the same indices were calculated from the faecal samples collected at similar timepoints from patients who did not receive vancomycin (control). Bar graphs represent mean ± SEM. *P < 0.05, **P < 0.01, ***P < 0.001, two-tailed t-test. ns, not significant. n = 5–12 per group and timepoint except for the second timepoint from control patients where n = 3. This figure appears in colour in the online version of JAC and in black and white in the print version of JAC.
Figure 2.
Figure 2.
The abundance of the majority of taxa and OTUs is altered during vancomycin treatment. (a) Relative abundance of different phyla in patients treated with vancomycin at baseline or 2 weeks after treatment initiation (Vanco). Only phyla that are present in at least 50% of the patients at baseline or after vancomycin treatment are shown. **P < 0.01, *P < 0.05, FDR < 0.2, two-tailed Wilcoxon test. ns, not significant. (b) Log2 average fold change (FC) between the genera abundance from samples obtained immediately after vancomycin treatment compared with their respective baseline samples. Only genera that are present in at least 50% of the patients at baseline or after vancomycin treatment are shown. Genera are sorted by phyla, FC difference and then alphabetically. UC, unclassified; vanco, vancomycin. (c) Heatmap representing the relative abundance (%) of OTUs present in at least 50% of the patients at baseline or after vancomycin treatment, showing a depletion of all prevalent Bacteroidetes OTUs and most Firmicutes OTUs. Additional analysis including all detected OTUs confirmed the depletion of all baseline OTUs from the Bacteroidetes phylum (not shown). For both (b) and (c): black squares indicate significant changes (P < 0.05, FDR < 0.1); grey squares indicate close to significance changes (P < 0.073, FDR < 0.1); two-tailed Wilcoxon test. n = 5. This figure appears in colour in the online version of JAC and in black and white in the print version of JAC.
Figure 3.
Figure 3.
Changes in the human microbiota following vancomycin withdrawal. Heatmap representing the average fold change of (a) phyla, (b) genera and (c) OTUs that were significantly increased (red) or decreased (green) (P < 0.05, FDR < 0.2, two-tailed Wilcoxon test) at a given timepoint as compared with the baseline. Time 0 represents the sample obtained the day of vancomycin withdrawal. n = 6–9 per timepoint. UC, unclassified; Enterobact., Enterobacteriaceae. This figure appears in colour in the online version of JAC and in black and white in the print version of JAC.
Figure 4.
Figure 4.
Incomplete and individualized recovery of the human microbiota after vancomycin withdrawal. Relative abundance at baseline (Bs) and at different weeks post-antibiotic cessation of OTUs whose abundance was ≥10 counts in the baseline sample of the analysed patient. Note that each patient baseline OTUs are distinct. The ID of each patient is indicated. As control, samples at similar timepoints were analysed from patients who did not receive vancomycin. Four representative patients from each group are shown (the four control patients from whom we were able to collect and analyse faecal samples at every timepoint and four out of the five vancomycin-treated patients for whom we were able to collect and analyse faecal samples at every timepoint). The rest of the patients are shown in Figure S5. This figure appears in colour in the online version of JAC and in black and white in the print version of JAC.
Figure 5.
Figure 5.
Microbiota recovery rate after vancomycin cessation influences the level of susceptibility to VRE intestinal colonization in mice. (a) Heatmap showing the most prevalent OTUs (≥10 counts per group of mice) found in the faeces of mice treated with vancomycin for 7 days (Vanco), 2 weeks after antibiotic cessation (Recov) or in mice that remained untreated (Untreat.). n = 5 per group. (b) Number of OTUs identified in faecal samples from untreated mice or humans, or mice/humans that were treated with oral vancomycin, the day the treatment was stopped (Vanco) or 2 weeks post-antibiotic cessation (Recov). Boxes extend from the 25th percentile to the 75th percentile. The line in the middle of the box represents the median. Whiskers extend from the minimum value to the maximum value. n = 5–12 per group. (c) VRE cfu/10 mg of faeces 2 days post-VRE inoculation in untreated mice (UT), mice that received vancomycin for 1 week and were inoculated with VRE immediately after vancomycin therapy (Vanco) or were inoculated 2 weeks post-antibiotic cessation (Recov). n = 5 for the UT and Vanco groups and n = 25 for the Recov group. (d) Correlation analysis between the y-axis variable (log2 VRE cfu/10 mg of faeces detected the second day after VRE inoculation in mice that recover for 2 weeks after vancomycin administration) and the x-axis variable, which is either (i) the number of OTUs identified in mice, the day of VRE inoculation, divided by the average number of OTUs identified in untreated mice, or (ii) the microbiota similarity between VRE-colonized mice, the day of VRE inoculation and untreated mice (based on UniFrac distance, see the supplementary methods). n = 25. This figure appears in colour in the online version of JAC and in black and white in the print version of JAC.

References

    1. Rakoff-Nahoum S, Paglino J, Eslami-Varzaneh F et al. Recognition of commensal microflora by toll-like receptors is required for intestinal homeostasis. Cell 2004; 118: 229–41. - PubMed
    1. Buffie CG, Pamer EG. Microbiota-mediated colonization resistance against intestinal pathogens. Nat Rev Immunol 2013; 13: 790–801. - PMC - PubMed
    1. Ivanov II, Atarashi K, Manel N et al. Induction of intestinal Th17 cells by segmented filamentous bacteria. Cell 2009; 139: 485–98. - PMC - PubMed
    1. Heijtz RD, Wang S, Anuar F et al. Normal gut microbiota modulates brain development and behavior. Proc Natl Acad Sci USA 2011; 108: 3047–52. - PMC - PubMed
    1. Ubeda C, Pamer EG. Antibiotics, microbiota, and immune defense. Trends Immunol 2012; 33: 459–66. - PMC - PubMed

Publication types