. 2016 Dec 1;27(24):3800-3812.
doi: 10.1091/mbc.E16-04-0224. Epub 2016 Oct 5.

Regulation of GPCR expression through an interaction with CCT7, a subunit of the CCT/TRiC complex

Affiliations

Regulation of GPCR expression through an interaction with CCT7, a subunit of the CCT/TRiC complex

Samuel Génier et al. Mol Biol Cell. .

Abstract

Mechanisms that prevent aggregation and promote folding of nascent G protein-coupled receptors (GPCRs) remain poorly understood. We identified chaperonin containing TCP-1 subunit eta (CCT7) as an interacting partner of the β-isoform of thromboxane A2 receptor (TPβ) by yeast two-hybrid screening. CCT7 coimmunoprecipitated with overexpressed TPβ and β2-adrenergic receptor (β2AR) in HEK 293 cells, but also with endogenous β2AR. CCT7 depletion by small interfering RNA reduced total and cell-surface expression of both receptors and caused redistribution of the receptors to juxtanuclear aggresomes, significantly more so for TPβ than β2AR. Interestingly, Hsp90 coimmunoprecipitated with β2AR but virtually not with TPβ, indicating that nascent GPCRs can adopt alternative folding pathways. In vitro pull-down assays showed that both receptors can interact directly with CCT7 through their third intracellular loops and C-termini. We demonstrate that Trp334 in the TPβ C-terminus is critical for the CCT7 interaction and plays an important role in TPβ maturation and cell-surface expression. Of note, introducing a tryptophan in the corresponding position of the TPα isoform confers the CCT7-binding and maturation properties of TPβ. We show that an interaction with a subunit of the CCT/TCP-1 ring complex (TRiC) chaperonin complex is involved in regulating aggregation of nascent GPCRs and in promoting their proper maturation and expression.


Figures

FIGURE 1:
FIGURE 1:
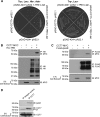
TPβ and β2AR interact with CCT7. (A) A yeast two-hybrid screen was performed using the TPβ C-terminus portion as bait on a human HeLa cell MATCHMAKER cDNA library. The interaction between CCT7 and the TPβ C-terminus was confirmed by the use of the selective yeast medium Trp, Leu, His, and Ade. (B) Lysates of HEK 293 cells transiently expressing HA-TPβ and CCT7-MYC alone or together were immunoprecipitated with HA-specific monoclonal antibody, and immunoblotting was performed with HA-specific HRP and MYC-specific HRP-conjugated antibodies. (C) Lysates of HEK 293 cells transiently expressing FLAG-β2AR and CCT7-MYC alone or together were immunoprecipitated with FLAG-specific monoclonal antibody, and immunoblotting was performed with Flag-specific polyclonal and MYC-specific HRP-conjugated antibodies. (D) HEK 293 cells lysates were incubated with either nonspecific goat or CCT7-specific goat polyclonal antibodies, and immunoblotting was performed using the same CCT7-specific and a β2AR-specific rabbit polyclonal antibody. All blots shown are representative of at least three independent experiments. IB, immunoblotting; IP, immunoprecipitation.
FIGURE 2:
FIGURE 2:
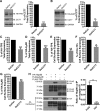
CCT7 depletion impairs TPβ and β2AR total and cell-surface expression. HEK 293 cells stably expressing HA-TPβ (A) or HA-β2AR (B) were transfected with control DsiRNA (DsiCtrl) or CCT7 DsiRNA (DsiCCT7), and lysates were immunoblotted with HA-specific HRP-conjugated, CCT7-specific and GAPDH-specific antibodies. Densitometry was performed on the Western blots to quantify relative expression of HA-TPβ (C) and HA-β2AR (D) in cells treated with CCT7 DsiRNA compared with control DsiRNA-transfected cells (100%) and normalized to GAPDH expression. Densitometry was performed using ImageJ software, and the results are presented as mean ± SD of at least four independent experiments. Cell-surface receptor expression was measured in HEK 293 cells expressing HA-TPβ (E), HA-TPα (F), or HA-β2AR (G) transfected with control or CCT7 DsiRNAs by ELISA using a monoclonal HA-specific antibody as described in Materials and Methods. Results are shown as a percentage of cell-surface receptor expression when cells were transfected with CCT7 DsiRNA compared with control DsiRNA condition (100%). (H) Lysates of HEK 293 cells transiently expressing FLAG-TPβ or FLAG-β2AR and HA-Hsp90 alone or together were immunoprecipitated with FLAG-specific monoclonal antibody, and immunoblotting was performed with FLAG-specific polyclonal and HA-specific HRP-conjugated antibodies. Densitometry on Western blots of five independent experiments are reported in the graphic and expressed as a ratio of HSP90 co-IP on receptors IP. Results are presented as mean ± SEM of at least four independent experiments. IB, immunoblotting; IP, immunoprecipitation.
FIGURE 3:
FIGURE 3:
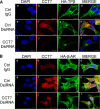
CCT7 colocalizes with TPβ and β2AR and regulates their intracellular distribution. Confocal microscopy was performed on HEK 293 cells stably expressing HA-TPβ (A) or HA-β2AR (B) treated with control or CCT7 DsiRNAs. Cells were fixed, permeabilized, and labeled with goat nonspecific IgG as a control, goat anti-CCT7 IgG, and mouse anti-HA IgG. Secondary antibodies used were Alexa Fluor 488–conjugated anti-mouse IgG and Texas red–conjugated anti-goat IgG. Cells were then stained with 4′,6-diamidino-2-phenylindole (DAPI) to visualize nuclei (a, e, and i). The fourth panel on the right represents a merged image of the blue, green, and red signals where the areas with high degree of colocalization between green-labeled receptors (c, g, and k) and red-labeled CCT7 (f and j) appear yellow (h). Approximately 88% of the 250 CCT7-depleted cells observed showed juxtanuclear accumulation of TPβ compared with 7% of the 250 control cells. Images shown are single confocal slices representative of at least four independent experiments and more than 250 observed cells. Scale bars: 10 μm.
FIGURE 4:
FIGURE 4:
CCT7 depletion causes redistribution of receptors in aggresomes. (A) HEK 293 cells stably expressing HA-TPβ transfected with CCT7 DsiRNA were fixed, permeabilized, and labeled with a rabbit anti-HA IgG and a mouse anti-GM130. Alexa Fluor 488–conjugated anti-rabbit IgG and Alexa Fluor 633–conjugated anti-mouse IgG were used as secondary antibodies. The fourth panel (d) represents a merge image of the blue (a), green (b), and red (c) signals. High degree of colocalization between the red and green signals appears in yellow. HEK 293 cells stably expressing HA-TPβ (B) or HA-β2AR (D) were treated with control or CCT7 DsiRNAs. The cells were fixed, permeabilized, and labeled with mouse anti-HA IgG and stained with PROTEOSTAT aggresome dye. We used Alexa Fluor 633–conjugated anti-mouse IgG as secondary antibody. The third image on the right represents a merged image (c and f) of the green and red signals where the areas with high degree of colocalization between the green signal of the receptors (a and d) and red signal of the aggresome (b and e) appear yellow. Scale bars: 10 μm. Images shown are single confocal slices representative of at least four independent experiments and more than 250 observed cells. (C, E) Mander’s colocalization coefficients represent the ratio of the green signal of the receptors overlapping the red signal of the aggresome and were calculated from at least 100 cells per condition. Results are presented as mean ± SEM.
FIGURE 5:
FIGURE 5:
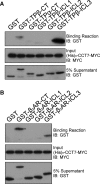
Identification of the CCT7-binding domains on TPβ and β2AR. (A) His pull-down assays were carried out using purified hexahistidine (His)6-CCT7-MYC bound to nickel–nitrilotriacetic acid–agarose beads incubated with purified GST or GST fused to the TP C-termini (GST-TPβ-CT and GST-TPα-CT) and intracellular loops (GST-TPβ-ICL). (B) His pull-down assays were carried out using purified (His)6-CCT7-MYC bound to nickel–nitrilotriacetic acid–agarose beads incubated with purified GST or GST fused to the β2AR C-terminus (GST-β2AR-CT) and intracellular loops (GST-β2AR-ICL). The binding of GST-fusion proteins in A and B was detected by immunoblotting with a GST-specific HRP-conjugated antibody, and the (His)6-CCT7-MYC present in the binding reactions was detected with a MYC-specific HRP-conjugated antibody. Blots shown are representative of at least five independent experiments.
FIGURE 6:
FIGURE 6:
TPβ Trp334 is a major determinant for CCT7 interaction. (A) Schematic representation of TPβ and TPα C-termini. The TPβ region important for CCT7 interaction is underlined in blue. The green, linked amino acids represent residues showing similarity or identity between TPβ and TPα. Shown in red are TPβ Trp334 and TPα Gln333. (B) Lysates of HEK 293 cells transiently expressing the indicated HA-TPβ constructs alone or with CCT7-MYC were immunoprecipitated with a HA-specific monoclonal antibody and analyzed by immunoblotting with MYC- and HA-specific HRP-conjugated antibodies. HA-TPβ 328, 337, 344, and 351 indicate that a stop codon was introduced after the corresponding amino acids. Densitometry on Western blots of four independent experiments are reported in the graphic and expressed as a relative ratio of CCT7 co-IP on receptors IP. (C) Lysates of HEK 293 cells transiently expressing HA-TPβ, HA-TPβ W334Q, HA-TPα, or HA-TPα Q333W alone or with CCT7-MYC were immunoprecipitated with a HA-specific monoclonal antibody and analyzed by immunoblotting with MYC- and HA-specific HRP-conjugated antibodies. Densitometry on Western blots of five independent experiments are reported in the graphic and expressed as a relative ratio of CCT7 co-IP on receptors’ IP. IB, immunoblotting; IP, immunoprecipitation.
FIGURE 7:
FIGURE 7:
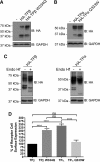
Trp334 is involved in TPβ maturation and cell-surface expression. (A) Lysates of HEK 293 cells transiently expressing HA-TPβ or HA-TPβ W334Q were analyzed by immunoblotting with HA-specific HRP-conjugated and GAPDH antibodies. (B) Lysates of HEK 293 cells transiently expressing HA-TPα or HA-TPα Q333W were analyzed by immunoblotting with HA-specific HRP-conjugated and GAPDH-specific antibodies. (C) Lysates from HEK 293 cells transiently expressing HA-TPβ or HA-TPα were subject to deglycosylation with Endo Hf as described in Materials and Methods. Immunoblotting was performed using HA-specific HRP-conjugated and GAPDH-specific antibodies. The blots shown are representative of three separate experiments. IB, immunoblotting. (D) Cell-surface receptor expression was measured in HEK 293 cells transiently expressing HA-TPβ, HA-TPβ W334Q, HA-TPα, or HA-TPα Q333W by ELISA using a monoclonal HA-specific antibody as described in Materials and Methods. The results are shown as the percentage of cell-surface receptor expression compared with HA-TPβ (TPβ, 100%). Results represent mean ± SEM of at least four independent experiments.
FIGURE 8:
FIGURE 8:
Characterization of the TPβ Trp334 mutant. (A) Confocal microscopy was performed on HEK 293 cells transiently expressing HA-TPβ (a–d) or TPβ W334Q (e–h). Cells were fixed, permeabilized, and labeled with goat anti-CCT7 IgG and mouse anti-HA IgG antibodies. Secondary antibodies used were Alexa Fluor 488–conjugated anti-mouse IgG and Texas red–conjugated anti-goat IgG. Cells were then stained with DAPI to visualize nuclei (a and e). The fourth panel on the right represents a merged image of the blue, green and red signals where the areas with high degree of colocalization between green-labeled receptors (c and g) and red-labeled CCT7 (b and f) appear yellow (d and h). Images shown are single confocal slices representative of at least four independent experiments and more than 100 observed cells. Scale bars: 10 µm. (B) Quantification of the membrane on total receptor fluorescence ratio was calculated using ImageJ software and was performed on at least 100 cells per condition. (C) Mander’s colocalization coefficients represent the ratio of the green signal of the receptors overlapping the red signal of the aggresome and were calculated from at least 100 cells per condition. Results are presented as mean ± SEM.
FIGURE 9:
FIGURE 9:
Targeting of the TPβ Trp334 mutant to the aggresome is diminished compared with wild-type TPβ in CCT7-depleted cells. (A) HEK 293 cells transiently expressing HA-TPβ W334Q were treated with control or CCT7 DsiRNAs. The cells were fixed, permeabilized, labeled with mouse anti-HA IgG, and stained with PROTEOSTAT aggresome dye. Alexa Fluor 633–conjugated anti-mouse IgG was used as the secondary antibody. The third images represent a merged image (c and f) of the green and red signals where the areas with high degree of colocalization between the green signal of the receptors (a and d) and red signal of the aggresome (b and e) appear yellow. Scale bars: 10 μm. Images shown are single confocal slices representative of at least four independent experiments and more than 250 observed cells. (B) Mander’s colocalization coefficients represent the ratio of the green signal of the receptor overlapping the red signal of aggresomes and were calculated from at least 100 cells per condition. Results are presented as mean ± SEM.
FIGURE 10:
FIGURE 10:
CCT7 coimmunoprecipitates with other GPCRs. (A) Lysates of HEK 293 cells transiently expressing HA-MOR (HA-tagged rat μ-opioid receptor) alone or with CCT7-MYC were immunoprecipitated with an HA-specific monoclonal antibody and analyzed by immunoblotting with MYC- and HA-specific HRP-conjugated antibodies. Lysates of HEK 293 cells transiently expressing FLAG-DOR (FLAG-tagged rat δ-opioid receptor; B) or FLAG-DP (FLAG-tagged prostaglandin D2 receptor; C) alone or with CCT7-MYC were immunoprecipitated with a FLAG-specific monoclonal antibody and analyzed by immunoblotting with FLAG-specific polyclonal and HA-specific HRP-conjugated antibodies. The blots shown are representative of three separate experiments. IB, immunoblotting; IP, immunoprecipitation.

Similar articles

Cited by

References

    1. Achour L, Labbé-Jullié C, Scott MGH, Marullo S. An escort for GPCRs: implications for regulation of receptor density at the cell surface. Trends Pharmacol Sci. 2008;29:528–535. - PubMed
    1. Amit M, Weisberg SJ, Nadler-Holly M, McCormack EA, Feldmesser E, Kaganovich D, Willison KR, Horovitz A. Equivalent mutations in the eight subunits of the chaperonin CCT produce dramatically different cellular and gene expression phenotypes. J Mol Biol. 2010;401:532–543. - PubMed
    1. Audigier Y, Friedlandert M, Blobel G. Multiple topogenic sequences in bovine opsin. Proc Natl Acad Sci USA. 1987;84:5783–5787. - PMC - PubMed
    1. Azzi M, Charest PG, Angers S, Rousseau G, Kohout T, Bouvier M, Piñeyro G. Beta-arrestin-mediated activation of MAPK by inverse agonists reveals distinct active conformations for G protein-coupled receptors. Proc Natl Acad Sci USA. 2003;100:11406–11411. - PMC - PubMed
    1. Bakthavatsalam D, Soung RH, Tweardy DJ, Chiu W, Dixon RAF, Woodside DG. Chaperonin-containing TCP-1 complex directly binds to the cytoplasmic domain of the LOX-1 receptor. FEBS Lett. 2014;588:2133–2140. - PMC - PubMed

Publication types

MeSH terms

Grants and funding

LinkOut - more resources