. 2016 Oct 18;113(42):11859-11864.
doi: 10.1073/pnas.1614057113. Epub 2016 Oct 5.

Generation of an inducible colon-specific Cre enzyme mouse line for colon cancer research

Affiliations

Generation of an inducible colon-specific Cre enzyme mouse line for colon cancer research

Paul W Tetteh et al. Proc Natl Acad Sci U S A. .

Abstract

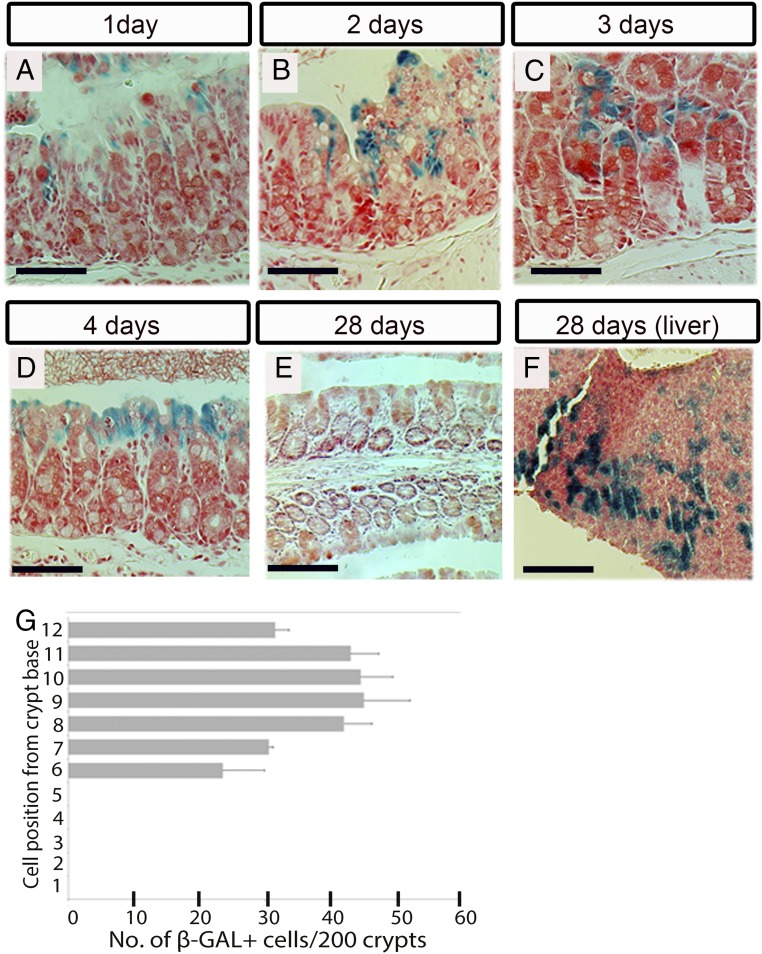
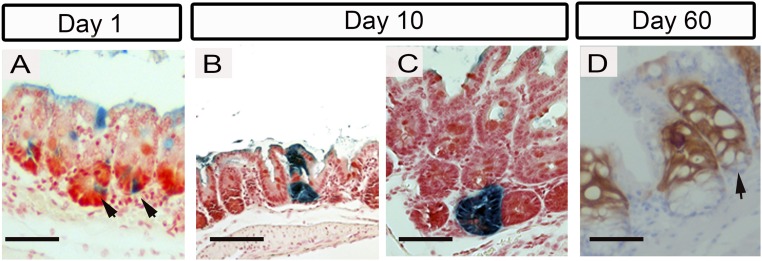
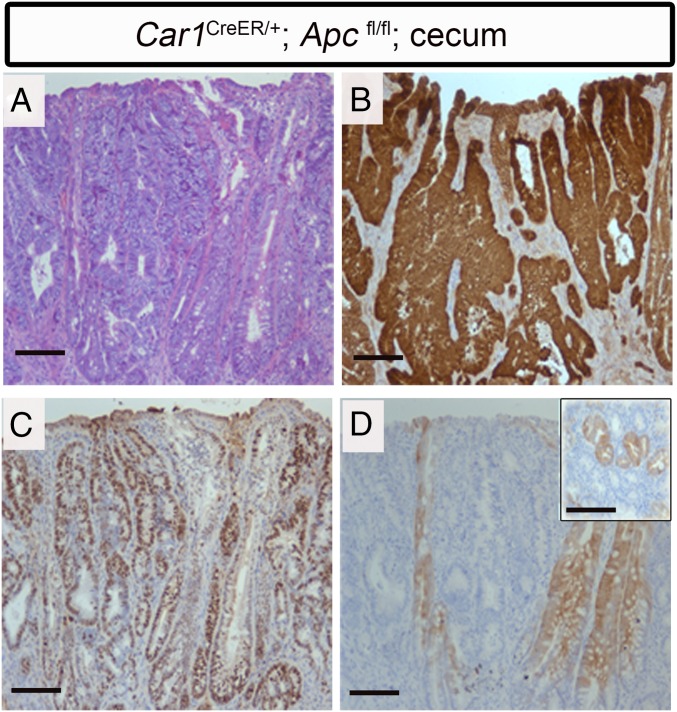
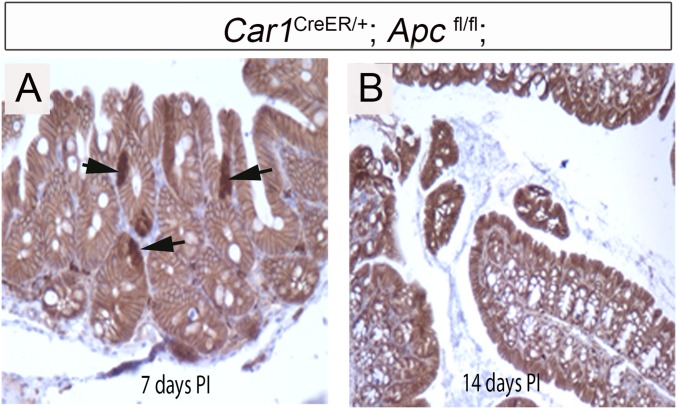
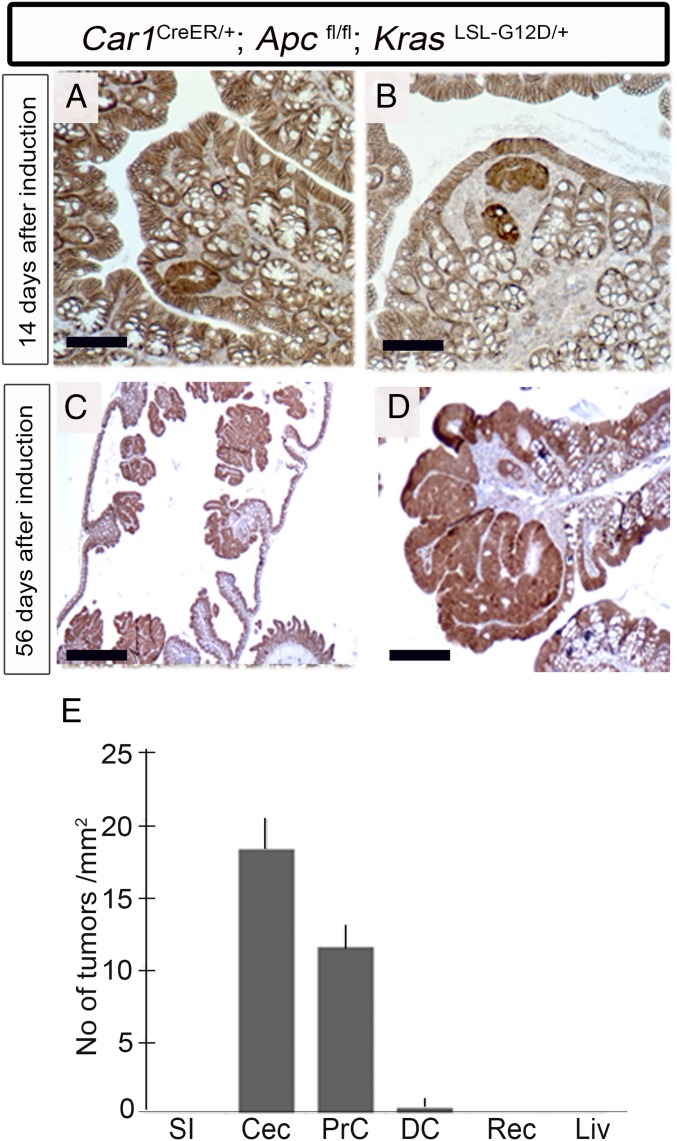
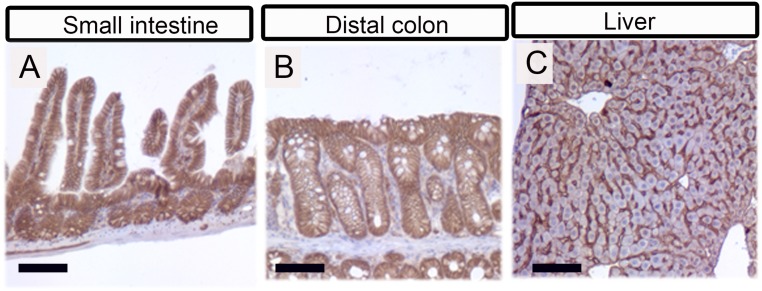
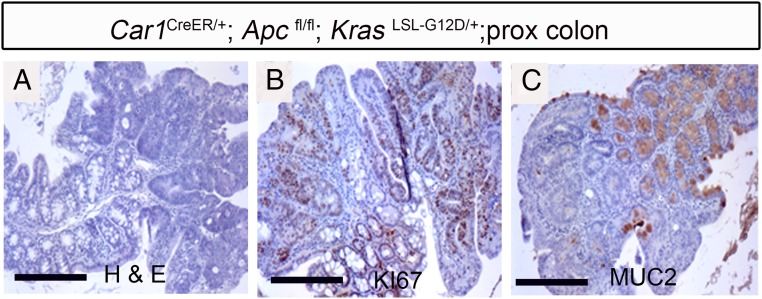
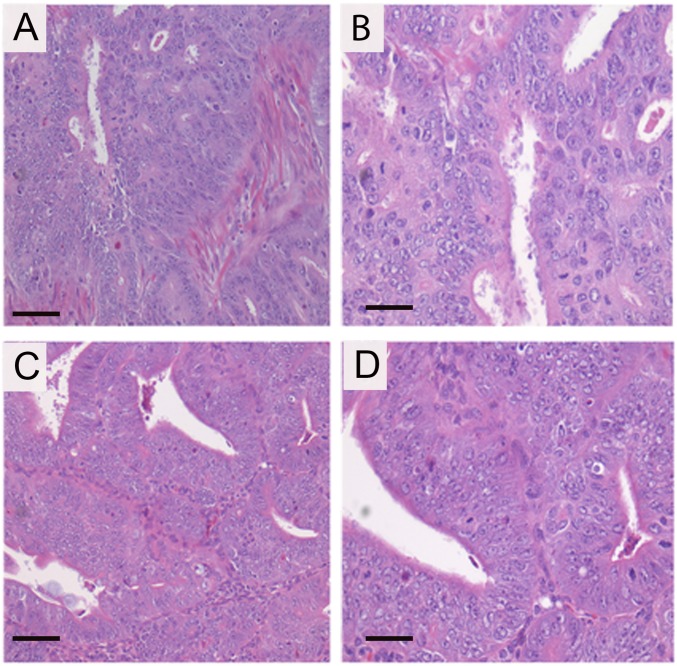
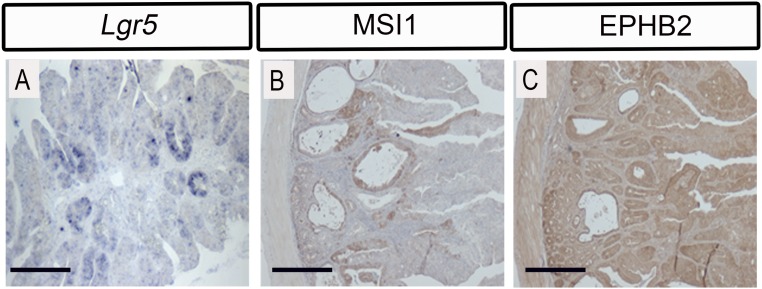
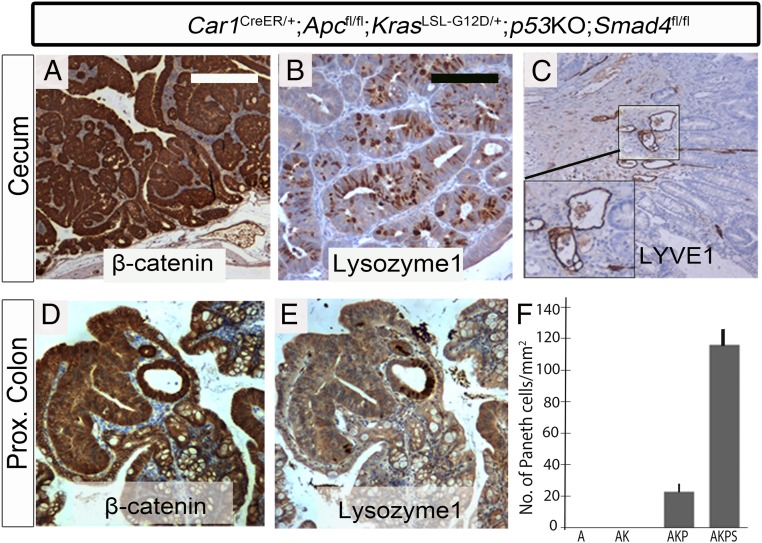
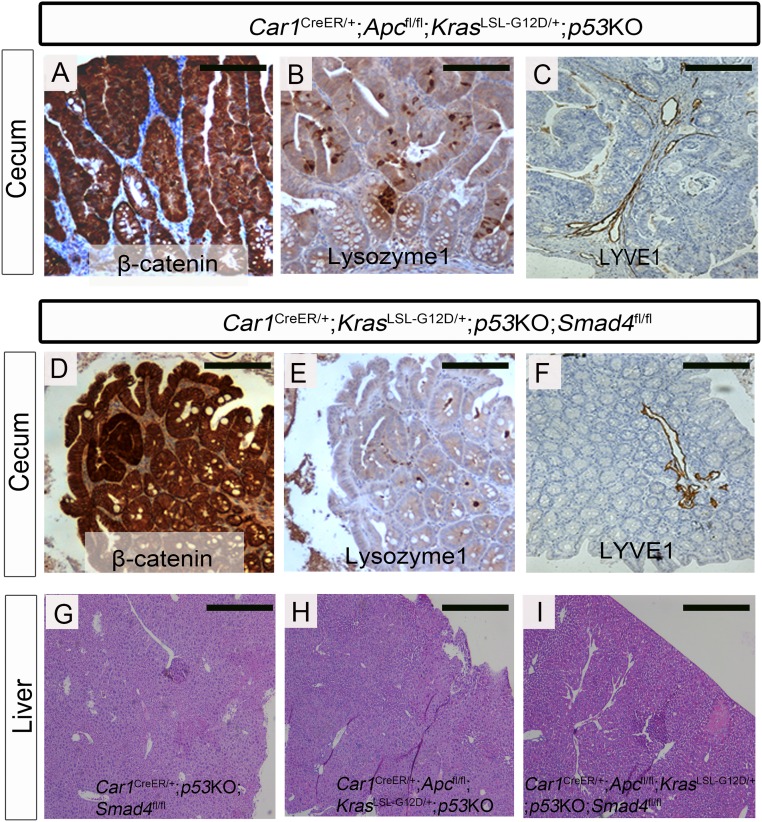
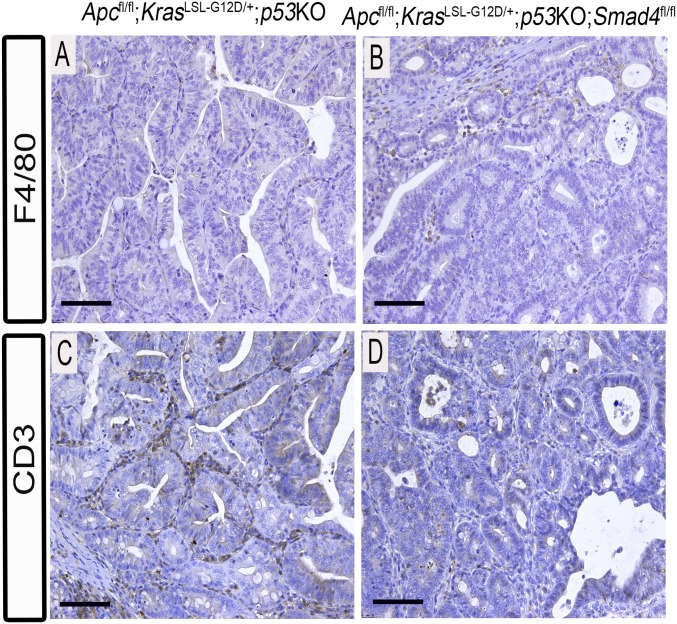
Current mouse models for colorectal cancer often differ significantly from human colon cancer, being largely restricted to the small intestine. Here, we aim to develop a colon-specific inducible mouse model that can faithfully recapitulate human colon cancer initiation and progression. Carbonic anhydrase I (Car1) is a gene expressed uniquely in colonic epithelial cells. We generated a colon-specific inducible Car1CreER knock-in (KI) mouse with broad Cre activity in epithelial cells of the proximal colon and cecum. Deletion of the tumor suppressor gene Apc using the Car1CreER KI caused tumor formation in the cecum but did not yield adenomas in the proximal colon. Mutation of both Apc and Kras yielded microadenomas in both the cecum and the proximal colon, which progressed to macroadenomas with significant morbidity. Aggressive carcinomas with some invasion into lymph nodes developed upon combined induction of oncogenic mutations of Apc, Kras, p53, and Smad4 Importantly, no adenomas were observed in the small intestine. Additionally, we observed tumors from differentiated Car1-expressing cells with Apc/Kras mutations, suggesting that a top-down model of intestinal tumorigenesis can occur with multiple mutations. Our results establish the Car1CreER KI as a valuable mouse model to study colon-specific tumorigenesis and metastasis as well as cancer-cell-of-origin questions.

Keywords: Car1; colorectal cancer; differentiated epithelial cells; gastrointestinal tract; mouse model.


Conflict of interest statement

The authors declare no conflict of interest.

Figures

Fig. 1.
Fig. 1.
Car1 expression in colon and generation of Car1CreER knock-in. Comparison of Car1 mRNA expression (A) to stem cell marker gene Lgr5 (B) in the proximal colon. Car1 is localized to differentiated cells at the top of the colonic crypt whereas Lgr5 is found in stem cells at the bottom of the crypt. (C) Targeting strategy. IRES–CreERT2 targeting construct used to target Car1 locus. (D) Southern blotting showing successfully targeted embryonic stem cells. (E) Genotyping of Car1CreER KI mice. (F and G) ER antibody staining showing expression of CreER fusion from the Car1 promoter in the Car1CreER KI. CreER expression is higher in the proximal colon (F) than in the distal colon (G). (Scale bars: A and B, 100 µm; F and G, 50 µm.)
Fig. 2.
Fig. 2.
Lineage tracing of Car1-expressing cells. Car1CreER/+;R26RLSLLacZ/+ mice were induced with 5 mg/kg TAM and then killed after (A) 1 d, (B) 2 d, (C) 3 d, (D) 4 d, and 28 d (E and F). (G) Quantification of β-gal+ cells 24 h in proximal colon after TAM injection of Car1CreER/+;R26RLSL–LacZ/+ mice. β-Gal+ cells can be detected at cell position 6 from the crypt base and above, but not at the crypt bottom (n = 3; mean ± SD). Counts were made per 100 colonic crypts for each mouse. (Scale bars: 100 µm.)
Fig. S1.
Fig. S1.
Cre expression in the cecum of Car1CreER KI. (A) Car1CreER; R26RLacz/+mouse injected with a single dose of TAM for 3 successive days and killed 1 d after the last injection. β-Gal staining showed labeled crypt bottom cells (black arrows) of cecum, suggesting stem cells in the cecum express Car1. (B and C) β-Gal staining 10 d after single dose of TAM demonstrates pronounced staining at crypt bottom of cecum indicative of stem cell labeling. (D) ER antibody staining of cecum 2 mo after a single dose of tamoxifen shows Cre expression in crypt bottom cells (stem cells) of cecum. (Scale bars: A, 50 µm; B, 100 µm; C and D, 50 µm.)
Fig. 3.
Fig. 3.
Adenomas in cecum upon Apc deletion. Car1CreER/+;Apcfl/fl mouse was injected with a single dose of TAM, killed after 2 mo, and analyzed. (A) H&E staining showing tubular adenomas in cecum. (B) Nuclear β-catenin staining showing Wnt hyperactivation in cecal adenomas. (C) KI67 staining showing highly proliferative cecal adenomas. (D) ER antibody staining showing Cre expression restricted in cecal adenomas, suggesting restricted expression in cancer cells fueling cancer progression (Inset). (Scale bars: 50 µm.)
Fig. S2.
Fig. S2.
Lack of adenomas upon Apc deletion in proximal colon Car1-expressing cells. β-Catenin nuclear accumulation (black arrows) in proximal colon, 7 d after TAM injection in Car1CreER/+;Apcfl/fl mouse (A). Adenomas were not visible after 14 d (B). (Scale bars: A, 50 µm; B, 200 µm.)
Fig. 4.
Fig. 4.
Adenoma formation upon Apc and Kras mutations in Car1-expressing colonic epithelial cells. A single dose of TAM was injected into Car1CreER/+;Apcfl/fl;KrasLSL–G12D/+ mice. β-Catenin nuclear staining was used to identify adenomas. (A and B) Microadenomas in proximal colon 14 d after TAM injection. (C and D) Macroadenomas in proximal colon 56 d after TAM injection. (E) Quantification of tumors formed per square millimeter (n = 3; mean ± SD). More tumors were observed in the cecum (Cec) than in the proximal colon (PrC). No tumors were observed in the small intestine (SI), distal colon (DC), rectum (R), and liver (Liv). (Scale bars: A and B, 100 µm; C, 800 µm; D, 200 µm.)
Fig. S3.
Fig. S3.
Restricted tumor formation in cecum and proximal colon. Assessment of tumor formation in (A) distal colon, (B) small intestine, and (C) liver in Car1CreER/+;Apcfl/fl;KrasLSL–G12D/+ mice 56 d after TAM injection by immunohistochemical stainings for β-catenin. (Scale bars: 50 µm.)
Fig. 5.
Fig. 5.
Histological analysis of Car1CreER/+;Apcfl/fl;KrasLSL–G12D/+ proximal colon tumors. (A) H&E staining showing tubular adenomas in Apc/Kras tumors. (B) Tumors were highly proliferative as shown by antibody staining of the proliferation marker KI67. (C) Proximal colon tumors were poorly differentiated as shown by the absence of differentiated MUC2-positive goblet cells. (Scale bars: 300 µm.)
Fig. S4.
Fig. S4.
Comparison of proximal colon tumors from Car1CreER/+;Apcfl/fl;KrasLSL–G12D/+ mouse and human patient. (A and B) adenomas from Car1CreER/+; Apcfl/fl;KrasLSLG12D/+ mouse 6 d post TAM induction. (C and D) Conventional proximal colon adenomas from elderly patient with APC and PTEN mutations. (Scale bars: 50 µm.)
Fig. S5.
Fig. S5.
Expression of cancer stem cell markers in Car1CreER/+;Apcfl/fl;KrasLSL–G12D/+ tumors. (A) Lgr5 in situ hybridization on Apc/Kras proximal colon tumors in Car1CreER mice showed restricted expression of the stem cell marker within tumors. (B) Antibody staining of the Musashi1 (MSI1) stem cell marker in proximal colon tumors. (C) Expression of colon stem cell marker EPHB2 within proximal colon tumors. (Scale bars: 100 µm.)
Fig. 6.
Fig. 6.
Histological analysis of Apc/Kras/p53/Smad4 deletion. Car1CreER;Apcfl/fl;KrasLSL–G12D/+;p53KO;Smad4fl/fl mice were injected with TAM and killed after 1 mo. Histological analysis of nuclear β-catenin indicating tumors: lysozyme 1 to observe Paneth cell metaplasia and lymphangiogenic marker LYVE1 to indicate invasiveness into lymph nodes. Aggressive carcinomas in cecum (A) and proximal colon (D). Paneth cell metaplasia in both cecum (B) and proximal colon (E). (C) LYVE1 staining. (Large Inset) Example of blood vessel with infiltrating tumor cells. (Scale bars: 100 µm.) (F) Quantification of Paneth cell metaplasia in cecum: Apc (A) and Apc/Kras (AK) mutations did not give rise to adenoma Paneth cells. Apc/Kras/p53/Smad4 mutants (AKPS) had fivefold more lysozyme-positive Paneth cells than Apc/Kras/p53 mutants (AKP) (n = 3, unless AKPS condition, where n = 1 due to high mortality; mean ± SD).
Fig. S6.
Fig. S6.
Histological analysis of Apc/Kras/p53/Smad4 mutations. Mice with indicated genotypes were injected with TAM and killed after 1 mo. Histological analysis of nuclear β-catenin indicating tumors: lysozyme 1 to observe Paneth cell metaplasia and lymphangiogenic marker LYVE1 to indicate invasiveness into lymph nodes. (AC) Apc/Kras/p53 mutations in cecum. Carcinomas (A) and Paneth cell metaplasia (B) with no invasiveness (C). Microadenomas (D) with no Paneth cell metaplasia (E) and no invasiveness (F) upon Kras/p53/Smad4 mutations. (GI) No adenomas, carcinomas, or metastases were observed in liver. (Scale bars: 100 µm.)
Fig. S7.
Fig. S7.
Absence of immune cell marker expression in Car1CreER/+;Apcfl/fl;KrasLSL–G12D/+;p53KO and Car1CreER/+;Apcfl/fl;KrasLSL–G12D/+;p53KO;Smad4fl/fl tumors. Immunostaining of immune markers was performed 1 mo after tumor induction. Tumor-associated macrophages, marked by expression of F4/80, were absent from (A) Apc/Kras/p53 and (B) Apc/Kras/p53/Smad4 tumors. (C and D) CD3-positive tumor-infiltrating lymphocytes were not detected in tumors arising from Car1-expressing cells. (Scale bars: 100 µm.)

Similar articles

Cited by

References

    1. Barker N, et al. Identification of stem cells in small intestine and colon by marker gene Lgr5. Nature. 2007;449(7165):1003–1007. - PubMed
    1. Gerbe F, et al. Distinct ATOH1 and Neurog3 requirements define tuft cells as a new secretory cell type in the intestinal epithelium. J Cell Biol. 2011;192(5):767–780. - PMC - PubMed
    1. de Lau W, et al. Peyer’s patch M cells derived from Lgr5(+) stem cells require SpiB and are induced by RankL in cultured “miniguts.”. Mol Cell Biol. 2012;32(18):3639–3647. - PMC - PubMed
    1. Mabbott NA, Donaldson DS, Ohno H, Williams IR, Mahajan A. Microfold (M) cells: Important immunosurveillance posts in the intestinal epithelium. Mucosal Immunol. 2013;6(4):666–677. - PMC - PubMed
    1. Siegel R, Desantis C, Jemal A. Colorectal cancer statistics, 2014. CA Cancer J Clin. 2014;64(2):104–117. - PubMed

Publication types

MeSH terms

LinkOut - more resources