Review
. 2016 Dec 28;95(6 Suppl):108-120.
doi: 10.4269/ajtmh.16-0163. Epub 2016 Oct 5.

Epidemiology of Plasmodium vivax Malaria in India

Affiliations
Review

Epidemiology of Plasmodium vivax Malaria in India

Anupkumar R Anvikar et al. Am J Trop Med Hyg. .

Abstract

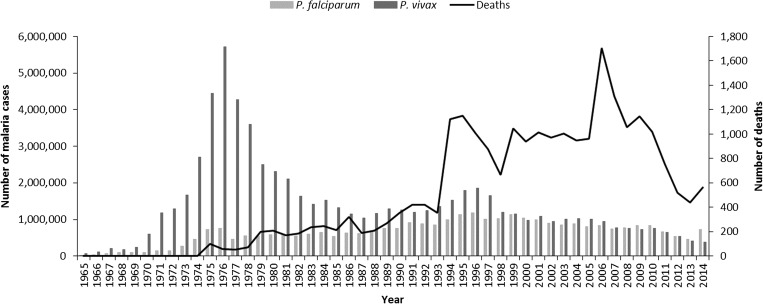
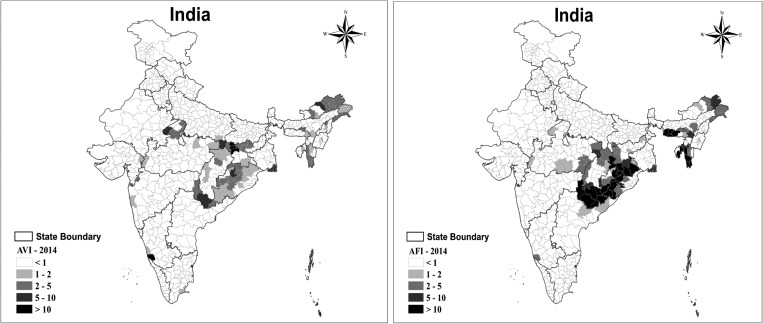
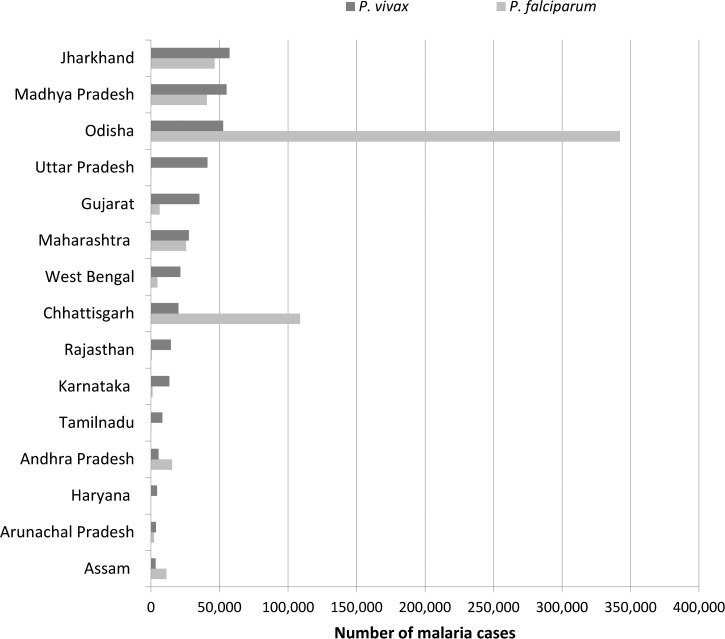
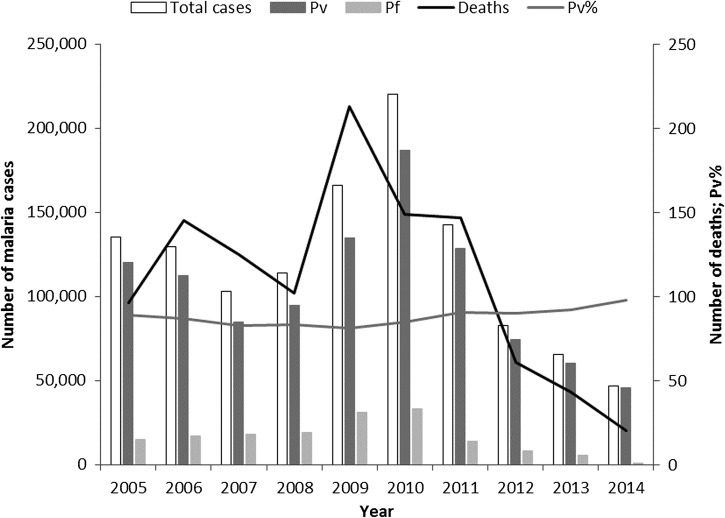
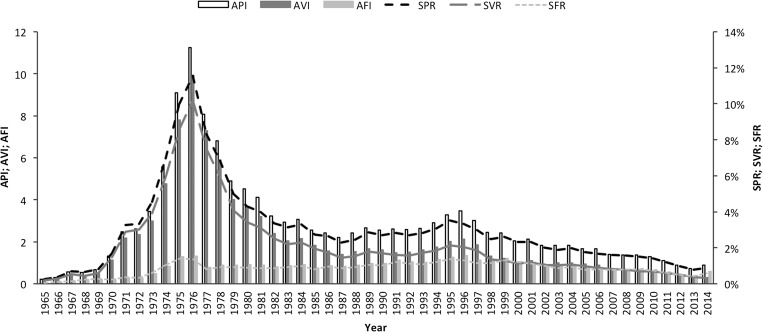
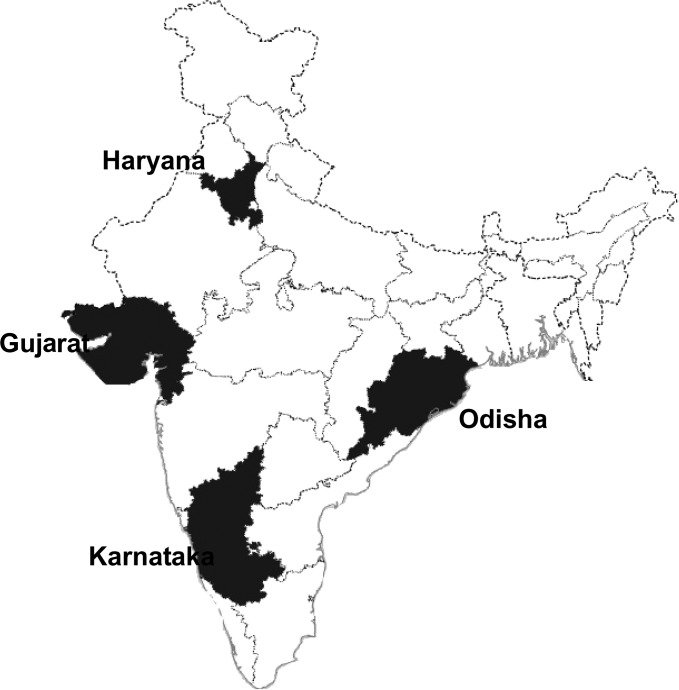
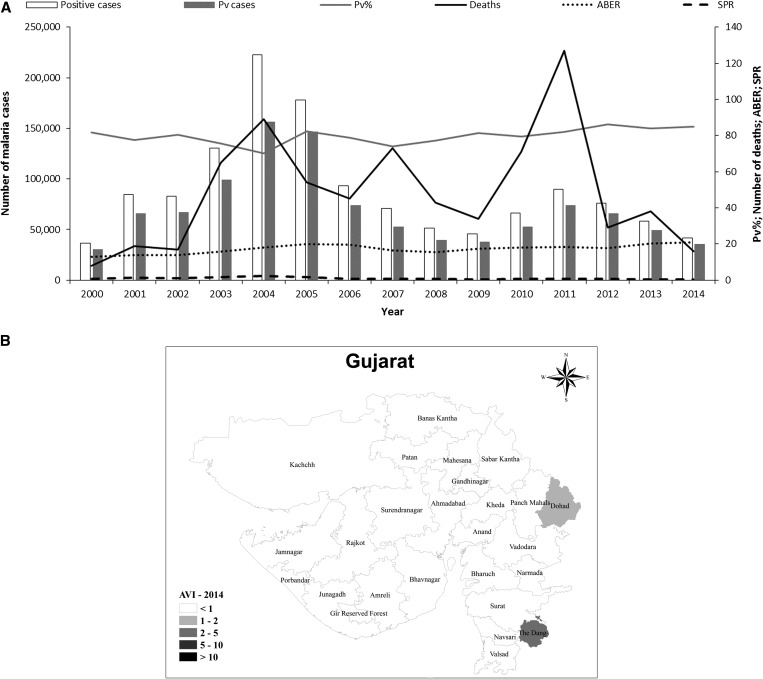
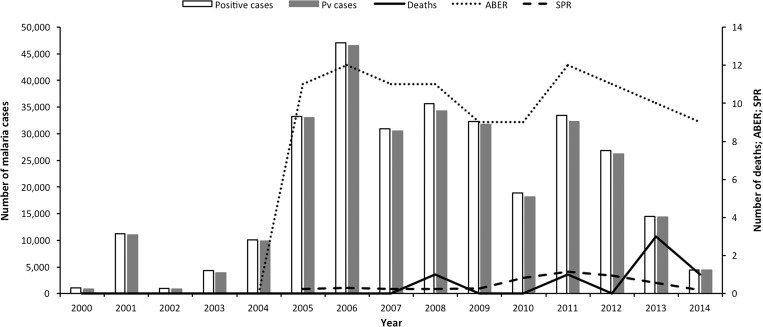
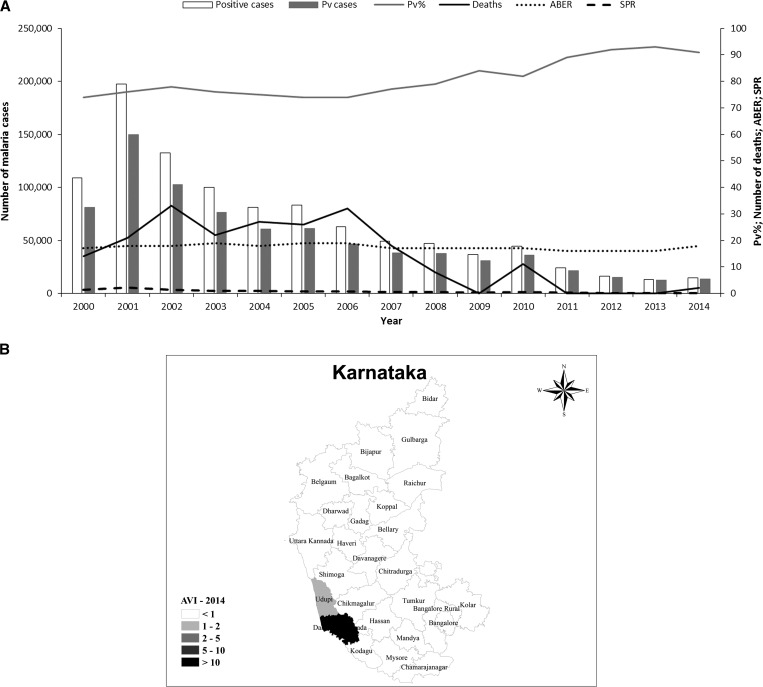
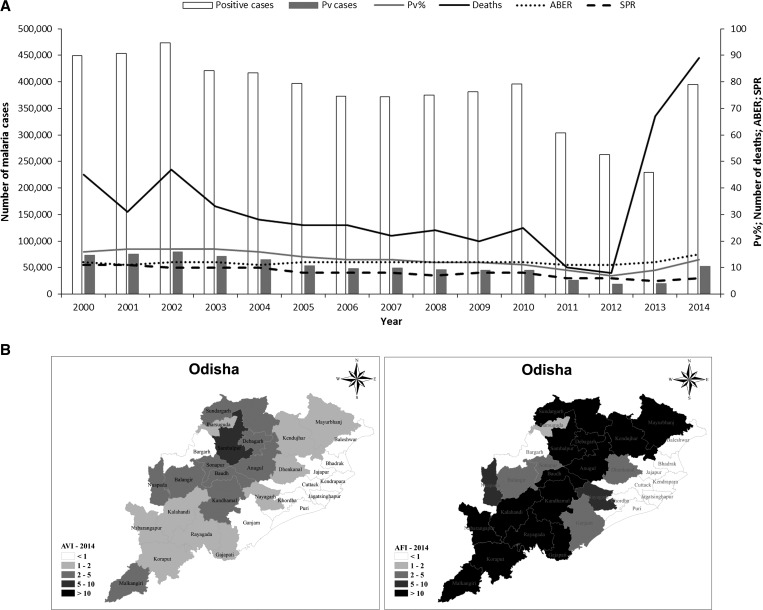
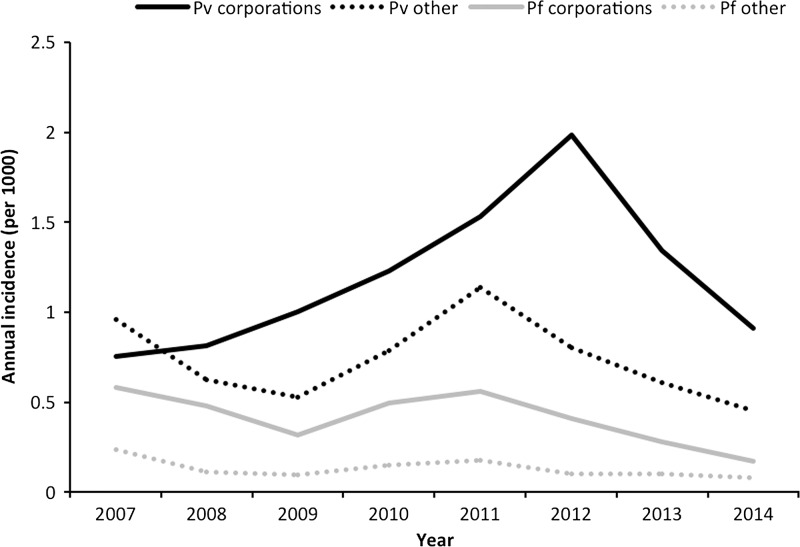
Historically, malaria in India was predominantly caused by Plasmodium vivax, accounting for 53% of the estimated cases. After the spread of drug-resistant Plasmodium falciparum in the 1990s, the prevalence of the two species remained equivalent at the national level for a decade. By 2014, the proportion of P. vivax has decreased to 34% nationally, but with high regional variation. In 2014, P. vivax accounted for around 380,000 malaria cases in India; almost a sixth of all P. vivax cases reported globally. Plasmodium vivax has remained resistant to control measures, particularly in urban areas. Urban malaria is predominantly caused by P. vivax and is subject to outbreaks, often associated with increased mortality, and triggered by bursts of migration and construction. The epidemiology of P. vivax varies substantially within India, including multiple relapse phenotypes with varying latencies between primary infection and relapse. Moreover, the hypnozoite reservoir maintains transmission potential and enables reestablishment of the parasite in areas in which it was thought eradicated. The burden of malaria in India is complex because of the highly variable malaria eco-epidemiological profiles, transmission factors, and the presence of multiple Plasmodium species and Anopheles vectors. This review of P. vivax malaria in India describes epidemiological trends with particular attention to four states: Gujarat, Karnataka, Haryana, and Odisha.


Figures

Figure 1.
Figure 1.
Annual malaria incidence in India, 1965–2014. Source: National Vector Borne Disease Control Programme.
Figure 2.
Figure 2.
Annual parasite index (parasite incidence per 1,000 population) for Plasmodium vivax (AVI) and Plasmodium falciparum (AFI) in India, 2014. Source: National Vector Borne Disease Control Programme. The annual vivax index (AVI) is the ratio between the number of P. vivax cases reported and the population at risk per 1,000 inhabitants; a higher ratio indicates a more severe P. vivax malaria problem.
Figure 3.
Figure 3.
Indian states with more than 3,000 Plasmodium vivax malaria cases in 2014. Source: National Vector Borne Disease Control Programme.
Figure 4.
Figure 4.
Urban malaria in India. Annual malaria incidence in the 19 states included in the Urban Malaria Scheme, 2005–2014. Source: National Vector Borne Disease Control Programme. Pf = Plasmodium falciparum; Pv = Plasmodium vivax; Pv% = percentage of total malaria attributed to P. vivax.
Figure 5.
Figure 5.
Changes in key indices of malaria epidemiology in India, 1965–2014. Source: National Vector Borne Disease Control Programme. API = annual parasite index; AVI = annual vivax index; AFI = annual falciparum index; SPR = slide positivity rate; SVR = slide positivity rate for Plasmodium vivax; SFR = slide positivity rate for Plasmodium falciparum.
Figure 6.
Figure 6.
Map of India showing the states considered in detail.
Figure 7.
Figure 7.
Malaria epidemiology in Gujarat. Source: State National Vector Borne Disease Control Programme. (A) Annual malaria cases and deaths in Gujarat, 2001–2014. Pv = Plasmodium vivax; Pv% = percentage of total malaria attributed to P. vivax; ABER = annual blood examination rate; SPR = slide positivity rate. (B) Annual P. vivax index (AVI) and Plasmodium falciparum (AFI) in Gujarat, 2014.
Figure 8.
Figure 8.
Malaria epidemiology in Haryana: trends in annual malaria incidence in Haryana, 2000–2014. Pv = Plasmodium vivax; ABER = annual blood examination rate; SPR = slide positivity rate. Source: State National Vector Borne Disease Control Programme.
Figure 9.
Figure 9.
Malaria epidemiology in Karnataka. Source: State National Vector Borne Disease Control Programme. (A) Trends in annual malaria incidence in Karnataka, 2000–2014. Pv = Plasmodium vivax; Pv% = percentage of total malaria attributed to P. vivax; ABER = annual blood examination rate; SPR = slide positivity rate. (B) Annual P. vivax index (AVI) and Plasmodium falciparum (AFI) in Karnataka, 2014.
Figure 10.
Figure 10.
Malaria epidemiology in Odisha. Source: State National Vector Borne Disease Control Programme. (A) Trends in annual malaria incidence in Odisha, 2000–2014. Pv = Plasmodium vivax; Pv% = percentage of total malaria attributed to P. vivax; ABER = annual blood examination rate; SPR = slide positivity rate. (B) Annual parasite index (parasite incidence per 1,000 population) for P. vivax (AVI) and Plasmodium falciparum (AFI) in Odisha, 2014.
Figure 11.
Figure 11.
Annual Plasmodium vivax and Plasmodium falciparum malaria incidence by urban and nonurban areas in Gujarat 2007–2014. Source: State National Vector Borne Disease Control Programme. Pf = P. falciparum; Pv = P. vivax.

Similar articles

Cited by

References

    1. World Health Organization World Malaria Report 2014. 2015. http://www.who.int/malaria/publications/world-malaria-report-2015/en/ Available at. Accessed July 23, 2016.
    1. Directorate of National Vector Borne Disease Control Programme Strategic Plan for Malaria Control in India 2012–2017: A Five-Year Strategic Plan. 2012. http://nvbdcp.gov.in/Doc/Strategic-Action-Plan-Malaria-2012-17-Co.pdf Available at. Accessed July 23, 2016.
    1. Srivastava HC, Kant R, Bhatt RM, Sharma SK, Sharma VP. Epidemiological observations on malaria in villages of Buhari PHC, Surat, Gujarat. Indian J Malariol. 1995;32:140–152. - PubMed
    1. Adak T, Sharma VP, Orlov VS. Studies on the Plasmodium vivax relapse pattern in Delhi, India. Am J Trop Med Hyg. 1998;59:175–179. - PubMed
    1. Adak T, Valecha N, Sharma VP. Plasmodium vivax polymorphism in a clinical drug trial. Clin Diagn Lab Immunol. 2001;8:891–894. - PMC - PubMed

LinkOut - more resources