. 2016 Nov 22;7(47):76902-76919.
doi: 10.18632/oncotarget.12357.

T-cell responses against CD19+ pediatric acute lymphoblastic leukemia mediated by bispecific T-cell engager (BiTE) are regulated contrarily by PD-L1 and CD80/CD86 on leukemic blasts

Affiliations

T-cell responses against CD19+ pediatric acute lymphoblastic leukemia mediated by bispecific T-cell engager (BiTE) are regulated contrarily by PD-L1 and CD80/CD86 on leukemic blasts

Judith Feucht et al. Oncotarget. .

Abstract

T-cell immunotherapies are promising options in relapsed/refractory B-precursor acute lymphoblastic leukemia (ALL). We investigated the effect of co-signaling molecules on T-cell attack against leukemia mediated by CD19/CD3-bispecific T-cell engager. Primary CD19+ ALL blasts (n≥10) and physiologic CD19+CD10+ bone marrow precursors were screened for 20 co-signaling molecules. PD-L1, PD-1, LAG-3, CD40, CD86, CD27, CD70 and HVEM revealed different stimulatory and inhibitory profiles of pediatric ALL compared to physiologic cells, with PD-L1 and CD86 as most prominent inhibitory and stimulatory markers. PD-L1 was increased in relapsed ALL patients (n=11) and in ALLs refractory to Blinatumomab (n=5). Exhaustion markers (PD-1, TIM-3) were significantly higher on patients' T cells compared to physiologic controls. T-cell proliferation and effector function was target-cell dependent and correlated to expression of co-signaling molecules. Blockade of inhibitory PD-1-PD-L and CTLA-4-CD80/86 pathways enhanced T-cell function whereas blockade of co-stimulatory CD28-CD80/86 interaction significantly reduced T-cell function. Combination of Blinatumomab and anti-PD-1 antibody was feasible and induced an anti-leukemic in vivo response in a 12-year-old patient with refractory ALL. In conclusion, ALL cells actively regulate T-cell function by expression of co-signaling molecules and modify efficacy of therapeutic T-cell attack against ALL. Inhibitory interactions of leukemia-induced checkpoint molecules can guide future T-cell therapies.

Keywords: CD80/86; PD-L1; T cells; blinatumomab; immune checkpoints; pediatric acute lymphoblastic leukemia.


Conflict of interest statement

CONFLICTS OF INTEREST

The authors declare that there is no conflict of interest.

Figures

Figure 1
Figure 1. CD4+ and CD8+ T-cell function can be recruited consistently for attack of CD19+ target cells through Blinatumomab
A. Dose- and target cell-dependent proliferation of T cells from ALL patients and healthy controls after co-incubation with Blinatumomab. PBMC as effectors from patients or healthy controls were incubated with irradiated CD19+ target cells (Raji cells; effector/target cell ratio: 10/1) and co-incubated with different concentrations of Blinatumomab. Proliferation of CD4+ and CD8+ T cells was analyzed by CFSE assay after 5 days. Interexperimental controls were performed with PBMC only, PBMC+Blinatumomab without addition of target cells and PBMC+irradiated Raji without addition of Blinatumomab. PBMC (patients: n=6, controls: n=6); PBMC+Blinatumomab 0.1μg/ml (patients: n=4, controls: n=7), PBMC+Raji (patients: n=6, controls: n=9), PBMC+Raji+Blinatumomab 10pg/ml (patients: n=3, controls: n=8), PBMC+Raji+Blinatumomab 1ng/ml (patients: n=5, controls: n=8), PBMC+Raji+Blinatumomab 0.1μg/ml (patients: n=5, controls: n=8, variable cell numbers due to low cell numbers of patients). B. Blinatumomab-induced proliferation of T cells from patients after successful treatment with Blinatumomab (“in vivo responders”) is equal to T-cell proliferation of “non-responders”. The group of patients depicted in Figure 1A was further grouped in responders (n=3) and non-responders to treatment with Blinatumomab (n=3). Effectors were PBMC from pediatric ALL patients and target cells were irradiated Raji cells. Co-culture experiments were done with addition of Blinatumomab 1ng/ml and 0.1μg/ml.
Figure 2
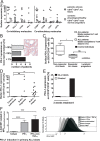
Figure 2
A. Surface expression of co-inhibitory and co-stimulatory molecules on CD19+CD10+ cells in the bone marrow of patients and control individuals (without malignancies). Surface expression of inhibitory molecules (left plot) PD-L1, LAG-3 and PD-1, of the bifunctional molecule HVEM and of co-stimulatory molecules (right plot) CD86, CD40, CD27 and CD70 on CD19+CD10+ bone marrow cells of patients (n≥11) as compared to controls (n≥4) was determined ex vivo by flow cytometry. Results with primary blasts prove an interindividual distinguishable pattern of inhibitory and stimulatory markers on leukemia cells. Each symbol represents an individual sample and the mean is indicated. Differences are statistically significant for PD-L1 (*p < 0.05) and CD86 (**p < 0.01, Mann-Whitney test). B. Immunohistochemical staining of PD-L1 expression on patients' bone marrow blasts. PD-L1 expression was analyzed on patients' bone marrow blasts by immunohistochemistry. The plot demonstrates the number of patients with their corresponding frequencies of immunohistochemical PD-L1 expression (grouped in patients with PD-L1 expression >10%, 1-10% and <1%). The right figure shows a representative example of immunohistochemical PD-L1 staining on one patient's ALL bone marrow blasts which was additionally confirmed by flow cytometry. C. Surface expression of PD-L1 on CD19+CD10+ cells from responders as compared to non-responders to Blinatumomab-treatment. PD-L1 expression on CD19+CD10+ cells of in vivo responders (n=4) and non-responders (n=5) to treatment with Blinatumomab and on CD19+CD10+ bone marrow cells of controls (n=6) was determined by extracellular antibody staining and flow cytometry. Box and whiskers show min/max and median (*p < 0.05, Mann-Whitney test). D. Surface expression of PD-L1 on CD19+CD10+ cells at primary diagnosis as compared to relapse. Median PD-L1 expression on ALL blasts of patients at primary diagnosis (n=8) compared to median PD-L1 expression on ALL blasts of relapsed/refractory patients (n=11) and to median PD-L1 expression on physiologic CD19+CD10+ bone marrow cells of controls (n=6), as determined by flow cytometry. Each symbol represents an individual sample and the median is indicated. ** p < 0.01 between relapse and controls and p = ns between controls and initial diagnosis using Mann-Whitney test. E. Induction of PD-L1 in leukemia cells in vivo through treatment. The plot demonstrates initial absence of PD-L1 surface expression on ALL blasts of one patient and development of PD-L1+ ALL blasts refractory to therapy in the further treatment course (control = isotype control). F. & G. Induction of PD-L1 in primary pediatric ALL blasts through inflammatory TH1 cytokines. Induced PD-L1 surface expression was determined in different ALL patients (n=7) after 42-44h incubation with IFN-γ or IFN-γ and TNF-α as compared to unstimulated samples and FMO (Fluorescence Minus One)/ isotype control. Mean Fluorescence Intensity (MFI) of PD-L1 on CD19+CD10+ blast cells after stimulation with IFN-γ, after stimulation with IFN-γ and TNF-α and of isotype staining were compared to MFI of unstimulated patients' samples. Bars show mean and SD of 7 independent experiments. ***p < 0.001, ****p < 0.0001, paired t test. In Figure G, an example is shown of TH1-induced PD-L1 expression on one patient's bone marrow blasts after incubation with IFN-γ or IFN-γ and TNF-α as compared to unstimulated patient's blasts, isotype and FMO control.
Figure 3
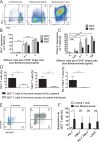
Figure 3. Induction of PD-1 and CTLA-4 on T cells during attack of malignant lymphoblast cells mediated by Blinatumomab
A. PBMC of healthy donors were incubated with irradiated Raji cells (effector/target cell ratio: 10/1) and stimulated with different concentrations of Blinatumomab for 48 hours. Flow-cytometric analysis of proliferation (determined by CFSE) and PD-1 expression on CD3+ T cells incubated with irradiated Raji cells without addition of Blinatumomab (left plot) and after 48h-incubation with 10pg/ml (central plot) and 0.1μg/ml Blinatumomab (right plot). B. Dose-dependent PD-1 expression on CD3+, CD4+ and CD8+ T cells of healthy donors (n=7 after stimulation with Blinatumomab, n=6 without Blinatumomab-stimulation) after 48h-incubation of PBMC with irradiated Raji cells and addition of 100pg/ml or 1ng/ml Blinatumomab. Bars show mean and SD. ****p<0.0001, paired t test of results from CD3+ cells. C. Dose-dependent expression of CTLA-4 (intracellular) after 48-72h incubation of PBMC (healthy donors) with irradiated Raji cells (E/T=10/1) and stimulation with Blinatumomab. PBMC+irradiated Raji cells: n=5, PBMC+irradiated Raji cells+Blinatumomab 10pg/ml: n=4, PBMC+irradiated Raji cells+Blinatumomab 100pg/ml: n=4, PBMC+irradiated Raji cells+Blinatumomab 1ng/ml: n=5, PBMC+irradiated Raji cells+Blinatumomab 0.1μg/ml: n=3. Bars show mean and SD. **p < 0.01, ****p < 0.0001, paired t test of results from CD4+ cells. D. & E. Surface expression of PD-1, TIM-3 and PD-1+TIM-3+ on CD3+ T cells in the bone marrow of ALL patients. Single and double positive expression of exhaustion markers PD-1 and TIM-3 on CD3+ T cells in bone marrow samples of patients (n=6) as compared to controls (n=4) D. Representative flow cytometric analysis of PD-1 and TIM-3 expression on CD3+ T cells of one patient without stimulation and after 48h stimulation with 1ng/ml Blinatumomab E. Bars represent data from independent experiments and mean and SD are indicated. **p < 0.01, ***p < 0.001, unpaired t test. F. Upregulation of PD-1, TIM-3 and LAG-3 on T cells during attack of malignant lymphoblast cells mediated by Blinatumomab. Expression of PD-1, TIM-3, LAG-3 and PD-1+TIM-3+ (mean±SD) on patients' bone marrow infiltrating CD3+ T cells without Blinatumomab and after 48h-incubation with 1ng/ml Blinatumomab (n=5). Bars show mean and SD of 5 independent experiments. *p < 0.05, paired t test.
Figure 4
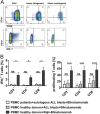
Figure 4. Target cell-dependent proliferation and IFN-γ secretion of T cells under stimulation with Blinatumomab
PBMC of patients or healthy donors were incubated with irradiated Raji cells or patients' blasts and 1ng/ml Blinatumomab for 48h. A. Flow cytometric analysis of target cell-dependent proliferation and effector capacity of CD3+ T cells. Blinatumomab-induced PD-1 expression, proliferation and IFN-γ secretion of CD3+ T cells are demonstrated after incubation of one donor's PBMC with irradiated Raji cells (left plots) or patient's blasts (central plots) as target cells and after incubation of the patient's PBMC with autologous blasts (right plots) and stimulation with Blinatumomab 1ng/ml. B. IFN-γ secretion (n=3) and proliferation (n=7) of CD3+, CD4+ and CD8+ T cells of healthy donors as compared to patients after 48h incubation of PBMC with irradiated Raji cells or patients' blasts as target cells and stimulation with 1ng/ml Blinatumomab. Bars indicate mean and SD. *p < 0.05, ****p < 0.0001, paired t test.
Figure 5
Figure 5. A-D. Blinatumomab-induced IFN-γ secretion and proliferation of T cells after blocking the PD-1–PD-L or CD80/CD86–CD28 axis
A. Flow cytometric analysis of proliferation of T cells from healthy donors after 48h-incubation with irradiated bone marrow leukemia blasts (E:T ratio 2:1) and 1ng/ml Blinatumomab as compared to additional use of PD-1 blocking antibody (n=13) or addition of PD-1 blocking antibody and CTLA-4 blocking antibody Ipilimumab (n=10). CD3+ T-cell proliferation was significantly increased through blockade of both checkpoint molecules (PD-1 and/or CTLA-4). Both, CD4+ and CD8+ T cells showed equivalent responses (data not shown). Each symbol represents one sample and results from one individual are linked by a line (**p < 0.01, paired t test). B. Proliferation (n=7) of patients' CD3+ T cells (CD4+ and CD8+ data not shown) after 48h-incubation of autologous PBMC with autologous bone marrow blasts (E:T ratio 2:1) and 1ng/ml Blinatumomab as compared to additional use of PD-1 blocking antibody. Blockade of PD-1 significantly increased T-cell proliferation (*p < 0.05, paired t test). C. IFN-γ secretion of CD3+, CD4+ and CD8+ T cells (n=4) after 48h-incubation of autologous PBMC with autologous bone marrow blasts (E:T ratio 2:1) and 1ng/ml Blinatumomab as compared to additional use of PD-1 blocking antibody which further increased T-cell activation (*p < 0.05, paired t test). D. IFN-γ secretion of CD3+ T cells (n=6) after 48h-incubation of autologous PBMC with irradiated Raji cells (E:T ratio 10:1) and Blinatumomab (100pg/ml) with and without addition of PD-1 blocking antibody. Gating on CD4+ and CD8+ T cells showed identical results as well as different E:T ratios (100:1) and Blinatumomab concentrations (1ng/ml) (data not shown; *p < 0.05, paired t test). E. & F. Blockade of the co-stimulatory markers CD80 and CD86 significantly reduced Blinatumomab-induced effector function and proliferation capacity of T cells. PBMC of healthy donors were incubated with CD80+CD86+ irradiated Raji cells (E:T ratio 2:1) for 48h and stimulated with 1ng/ml Blinatumomab. IL-2 secretion, IFN-γ secretion (n=15) and proliferation (n=16) were analyzed without antibody blockade and after addition of blocking antibodies against CD80 and CD86. CD4+ and CD8+ T-cells showed equivalent results (data not shown; **p < 0.01, ***p < 0.001, ****p < 0.0001, paired t test).
Figure 6
Figure 6. Target-cell dependent cytotoxicity mediated by Blinatumomab
PBMC were incubated with Blinatumomab and target cells at different effector:target (E:T) ratio. NALM-6 expressing firefly luciferase-GFP (NALM-6), NALM-6 expressing firefly luciferase-GFP and PD-L1 (NALM-6-PD-L1) or NALM-6 expressing firefly luciferase-GFP and CD80 (NALM-6-CD80) served as target cells. A. Representative FACS plots demonstrating expression of CD80 and PD-L1 on respective target cells. B. PBMC were stimulated with 500pg/ml Blinatumomab and cytolytic capacity against the targets NALM-6, NALM-6-CD80 and NALM-6-PDL1 were compared after 46 hours of co-culture (n≥4) by bioluminescence assay. Lysis was compared to lysis of the same conditions without addition of Blinatumomab. Results are pooled data from three independent experiments performed in duplicate or triplicate wells. Data are means ± SD. *p < 0.05, **p < 0.01, ***p < 0.001, paired t test. C. Cytotoxic activity of PBMC against NALM-6 after stimulation with Blinatumomab 500pg/ml or without Blinatumomab (n≥5). Results are pooled data from three independent experiments performed in duplicate or triplicate wells. Data are means ± SD. D. Effect of PD1-blockade and E. CD80-blockade on Blinatumomab-mediated cytotoxicity. PBMC were incubated with indicated target cells (NALM-6, NALM-6-PDL1 or NALM-6-CD80) and 500pg/ml Blinatumomab in the absence or presence of blocking antibodies against PD-1 (D) or CD80 (E) at different effector:target (E:T) ratios for 46h. Results are pooled data from three independent experiments performed in duplicate or triplicate wells. Data are means ± SD (n≥6 for PD1 blockade and n≥4 for CD80 blockade). *p < 0.05, **p < 0.01, ***p < 0.001, ****p < 0.0001, paired t test. Lysis is compared to lysis of the same conditions without Blinatumomab.
Figure 7
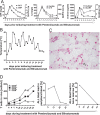
Figure 7. Inflammatory response during T-cell attack of acute lymphoblastic leukemia in vivo, mediated by treatment with PD-1 blocking antibody Pembrolizumab and Blinatumomab
A. & B. A 12-year-old girl suffering from refractory ALL was treated with combined therapy of Pembrolizumab and Blinatumomab. Blood results of inflammatory parameters C-reactive protein (CRP), Procalcitonin (PCT), ferritin, D-dimer, soluble IL-2 receptor (sIL-2R) and interleukin-6 (IL-6) as well as fever chart prior to and during combinatory treatment with Blinatumomab and Pembrolizumab. Day 0 = day of treatment start with Blinatumomab, day -1 = first application of Pembrolizumab. C. Immunohistochemical PD-L1 staining of the patient's bone marrow prior to treatment start. Immunohistochemistry revealed high percentage of PD-L1+ ALL blasts. The arrow shows one example of PD-L1+ bone marrow blasts. D. T-cell expansion in peripheral blood and blast load after treatment start with Pembrolizumab and Blinatumomab. The left plot demonstrates proliferation of CD3+, CD4+ and CD8+ T cells after application of Pembrolizumab and during treatment with Blinatumomab as determined by flow cytometry. The middle plot shows the course of ALL blast load in peripheral blood and the right plot the course of ALL blast load in bone marrow under combined treatment with Pembrolizumab and Blinatumomab.

Similar articles

Cited by

References

    1. Hunger SP, Lu X, Devidas M, Camitta BM, Gaynon PS, Winick NJ, Reaman GH, Carroll WL. Improved survival for children and adolescents with acute lymphoblastic leukemia between 1990 and 2005: a report from the children's oncology group. J Clin Oncol. 2012;30:1663–1669. - PMC - PubMed
    1. Handgretinger R, Zugmaier G, Henze G, Kreyenberg H, Lang P, von Stackelberg A. Complete remission after blinatumomab-induced donor T-cell activation in three pediatric patients with post-transplant relapsed acute lymphoblastic leukemia. Leukemia. 2011;25:181–184. - PubMed
    1. Bhojwani D, Pui CH. Relapsed childhood acute lymphoblastic leukaemia. The Lancet Oncology. 2013;14:e205–217. - PubMed
    1. Nguyen K, Devidas M, Cheng SC, La M, Raetz EA, Carroll WL, Winick NJ, Hunger SP, Gaynon PS, Loh ML, Children's Oncology G Factors influencing survival after relapse from acute lymphoblastic leukemia: a Children's Oncology Group study. Leukemia. 2008;22:2142–2150. - PMC - PubMed
    1. Zugmaier G, Klinger M, Schmidt M, Subklewe M. Clinical overview of anti-CD19 BiTE and ex vivo data from anti-CD33 BiTE as examples for retargeting T cells in hematologic malignancies. Molecular Immunology. 2015;67:58–66. - PubMed

MeSH terms