. 2016 Nov 15;7(46):75712-75728.
doi: 10.18632/oncotarget.12362.

Deregulation of the pRb-E2F4 axis alters epidermal homeostasis and favors tumor development

Affiliations

Deregulation of the pRb-E2F4 axis alters epidermal homeostasis and favors tumor development

Clotilde Costa et al. Oncotarget. .

Erratum in

Abstract

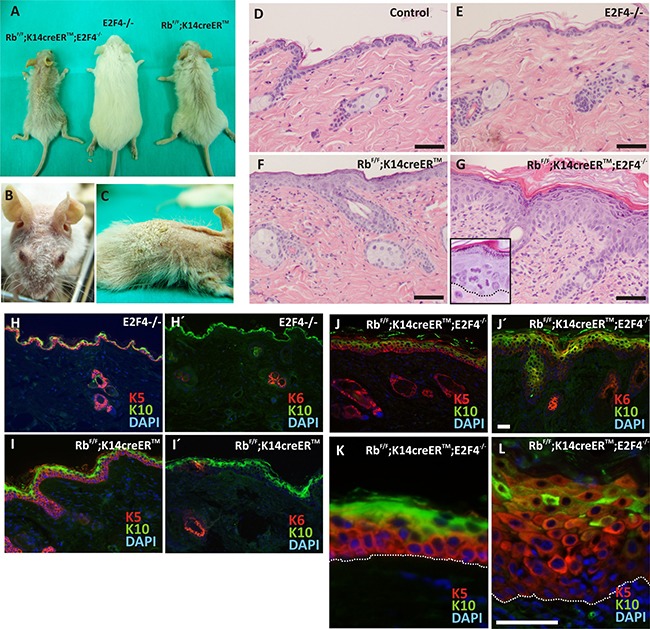
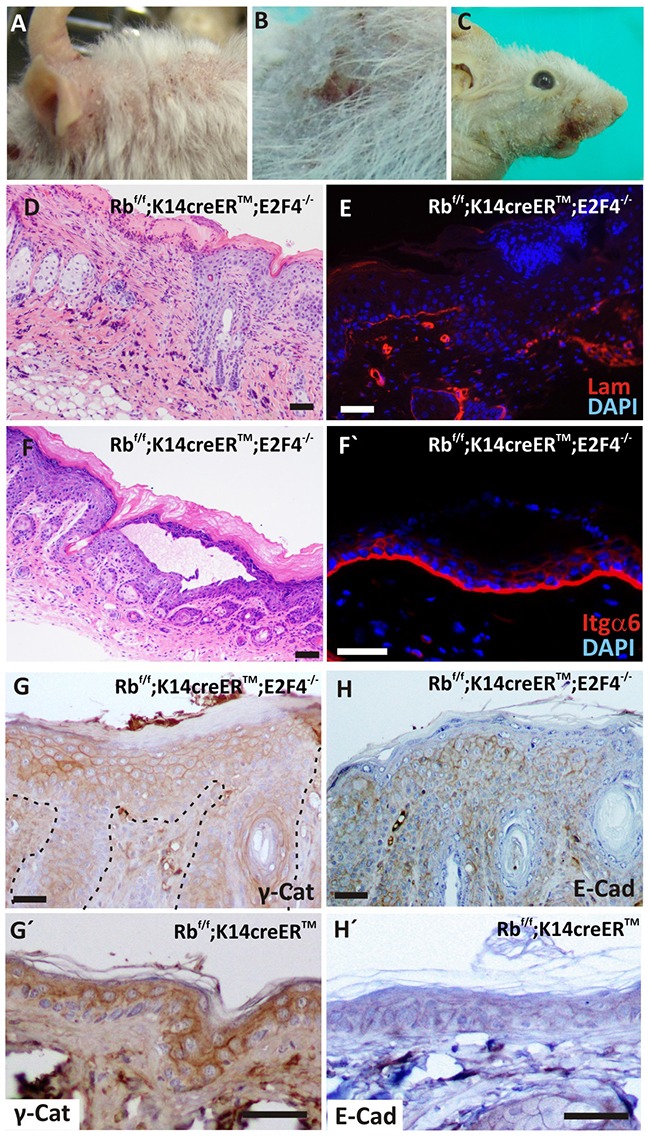
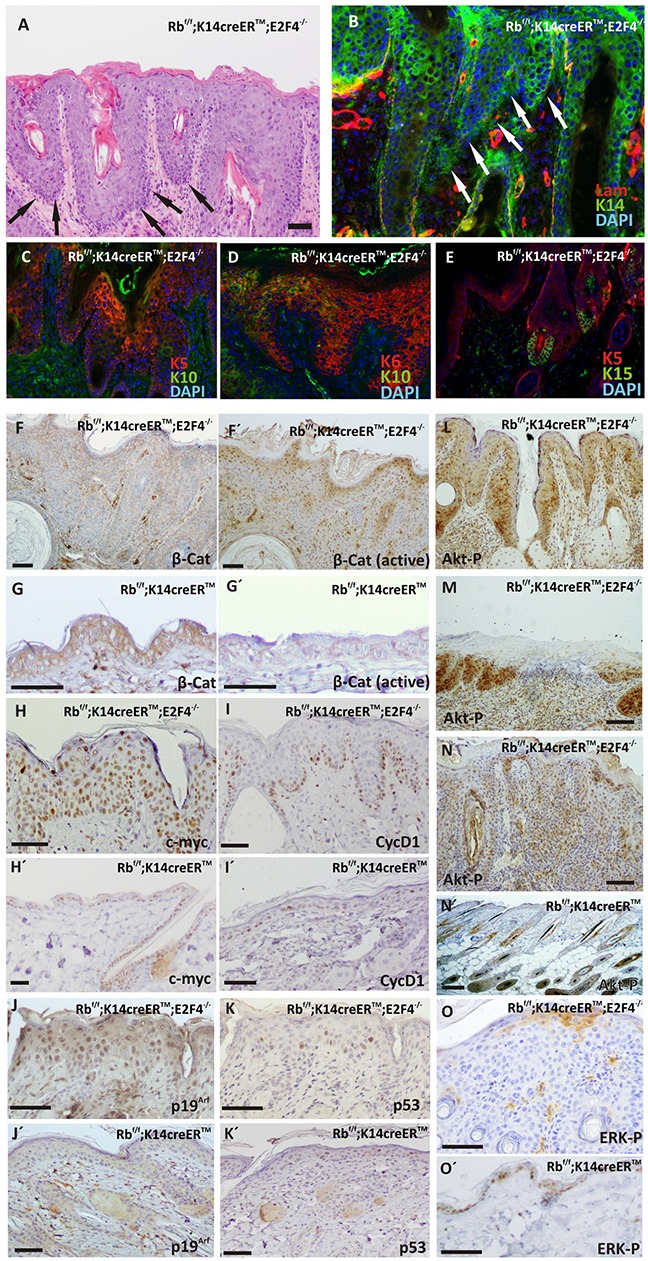
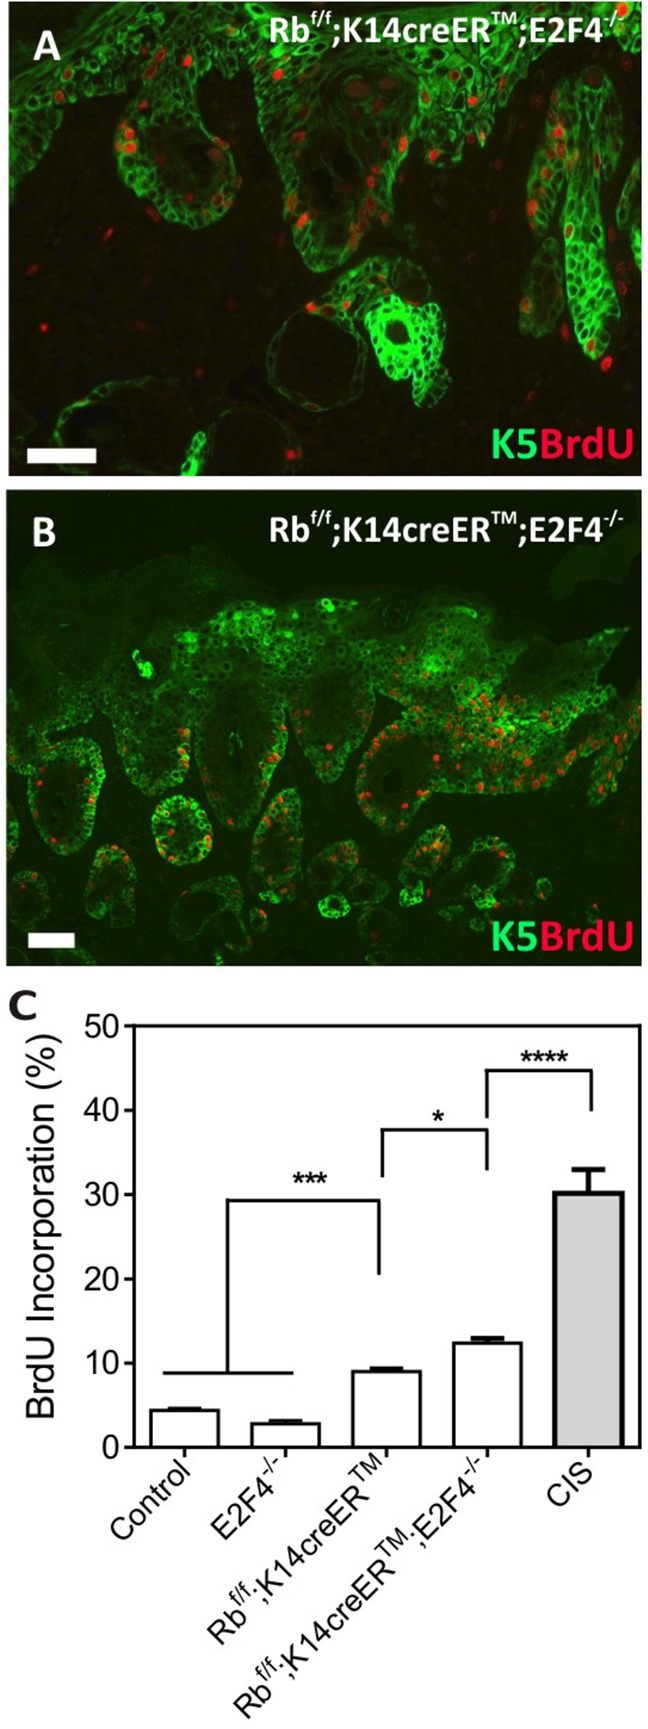
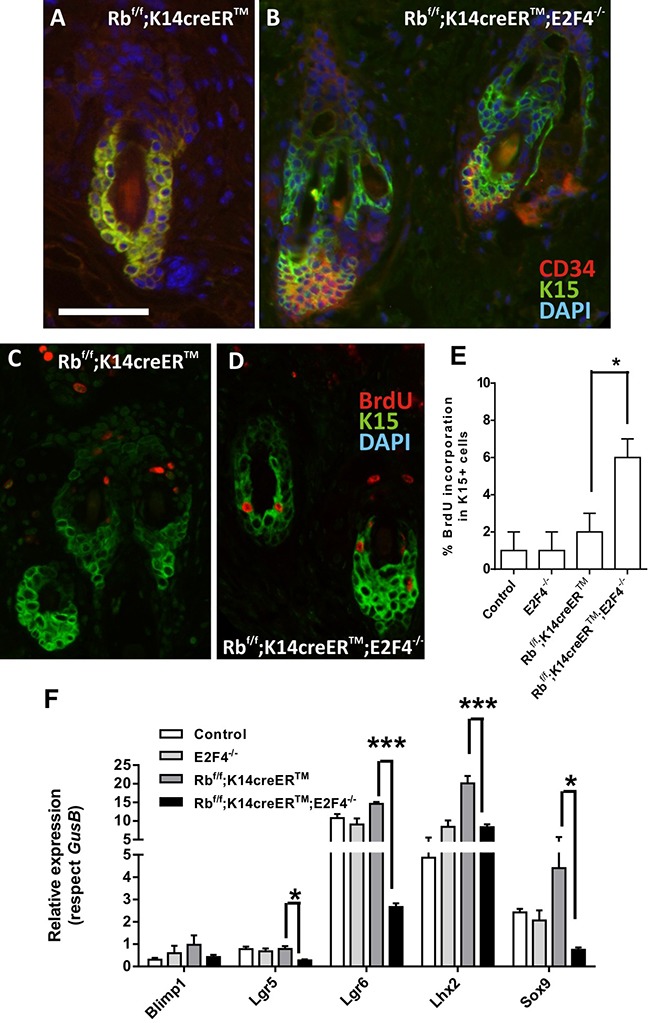
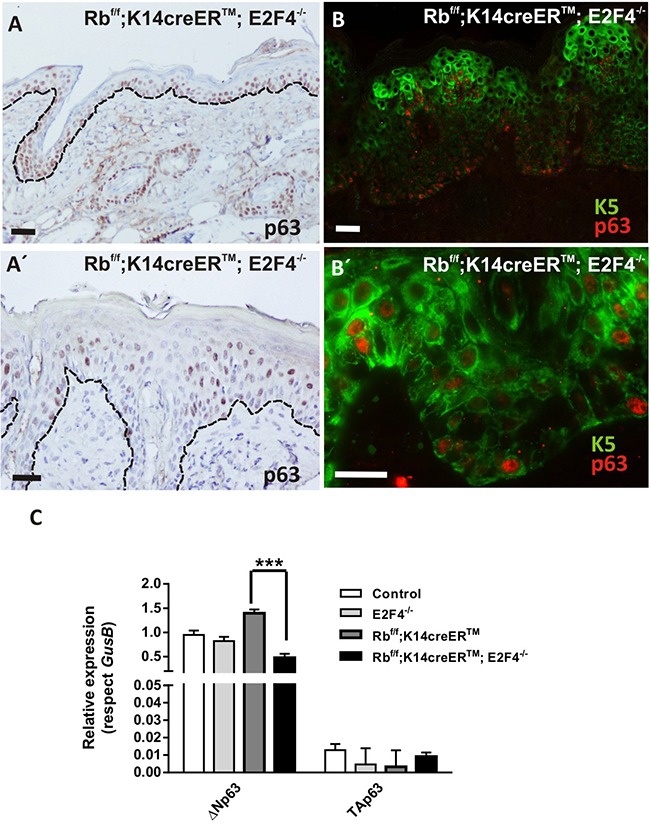
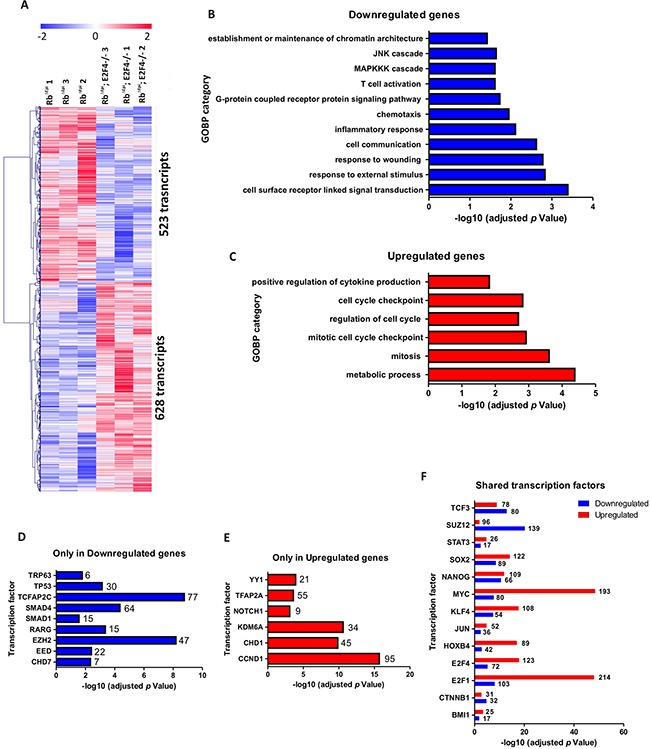
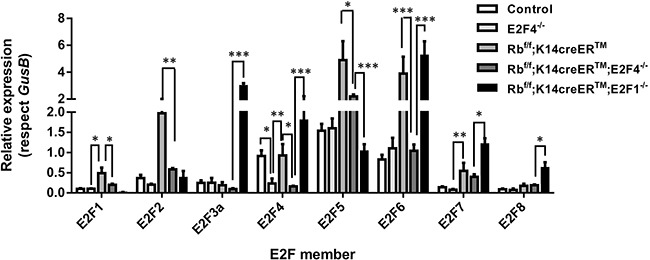
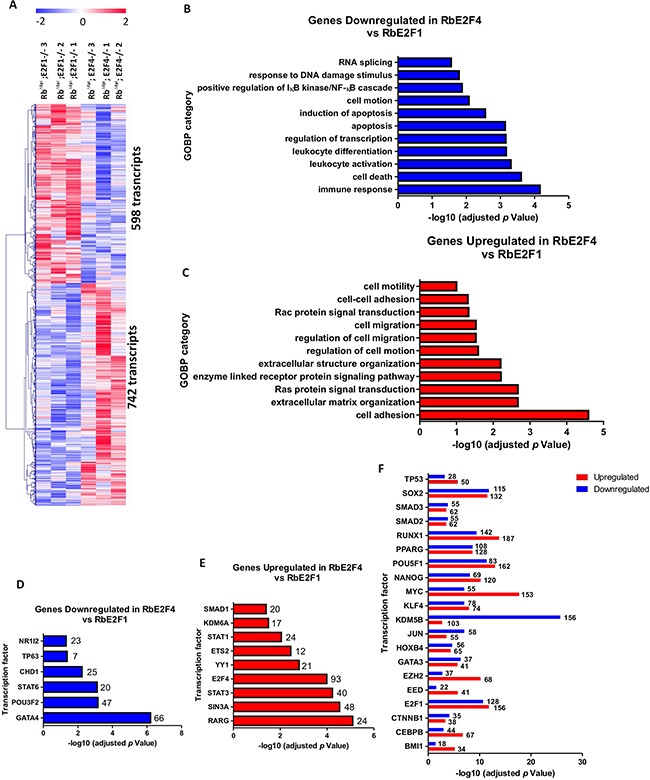
E2F/RB activity is altered in most human tumors. The retinoblastoma family of proteins plays a key role in regulating the progression of the cell cycle from the G1 to S phases. This is achieved through negative regulation of E2F transcription factors, important positive regulators of cell cycle entry. E2F family members are divided into two groups: activators (E2F1-E2F3a) and repressors (E2F3b-E2F8). E2F4 accounts for a large part of the E2F activity and is a main E2F repressor member in vivo. Perturbations in the balance from quiescence towards proliferation contribute to increased mitotic gene expression levels frequently observed in cancer. We have previously reported that combined Rb1-Rbl1 or Rb1-E2f1 ablation in epidermis produces important alterations in epidermal proliferation and differentiation, leading to tumor development. However, the possible roles of E2F4 in this context are still to be determined. Here, we show the absence of any discernible phenotype in the skin of mice lacking of E2f4. In contrast, the inducible loss of Rb1 in the epidermis of E2F4-null mice produced multiple skin abnormalities including altered differentiation and proliferation, spontaneous wounds, carcinoma in situ development and stem cell perturbations. All these phenotypic alterations are associated with extensive gene expression changes, the induction of c-myc and the Akt activation. Moreover the whole transcriptome analyses in comparison with previous models generated also revealed extensive changes in multiple repressive complexes and in transcription factor activity. These results point to E2F4 as a master regulator in multiple steps of epidermal homeostasis in Rb1 absence.

Keywords: E2F4; Rb; cancer; epidermis; mouse.


Conflict of interest statement

CONFLICTS OF INTEREST

The authors declare that they have no competing interests.

Figures

Figure 1
Figure 1. Phenotypic characterization of RbF/F;K14creERTM;E2F4−/− mice
A. Gross appearance of the RbF/F;K14creERTM;E2F4−/−; E2F4−/− and RbF/F;K14creERTM mice 12 months after topical tamoxifen treatment. B, C. Macroscopic aspect of RbF/F;K14creERTM;E2F4−/− head and back respectively. D-G. H&E stained skin sections of back skin samples of Control (D); E2F4−/− (E); RbF/F;K14creERTM (F) and RbF/F;K14creERTM;E2F4−/− (G) mice. H-L. Representative double immunofluorescence of K5 or K6 (red) and K10 (green) of the quoted genotypes. Nuclei are stained in blue with DAPI. Bars = 100 μm (H-J Bars =50 μm).
Figure 2
Figure 2. Spontaneous wounds and epidermal fragility in RbF/F; K14creERTM; E2F4−/− mice
A-C. Macroscopic wounds in head (A), back (B) and snout (C) of tamoxifen treated mice. D. H&E staining showing epidermal loss in double mutant skin. E. Immunofluorescence showing the loss of laminin (red) in epidermal basal lamina. Nuclei are stained in blue (DAPI). F. H&E stained section of an epidermal lesion forming blisters. F' Immunofluorescence for integrin α6 (red) of RbF/F;K14creERTM;E2F4−/− epidermis. Nuclei are stained in blue. G-H'. Inmunohistochemistry of hyperplastic RbF/F;K14creERTM;E2F4−/− (G; H) and RbF/F;K14creERTM (G', H') epidermis for adhesion molecules: γ-catenin (G, G') and E-cadherin (H, H'). Bars= 50 μm (F': Bar = 100 μm)
Figure 3
Figure 3. Carcinoma in situ development in RbF/F; K14creERTM;E2F4−/− mice
A. H&E stained section of double mutant epidermis showing carcinomas in situ (black arrows). B-E. Phenotypic characterization of carcinomas in situ present in RbF/F;K14creERTM;E2F4−/− epidermis by double immunofluorescence: laminin (red) and K14 (green) (B); K5 (red) and K10 (green) (C); K6 (red) and K10 (green) (D); K5 (red) and K15 (green)(E). Nuclei were stained with DAPI(blue). F-O. Representative immunohistochemistry of quoted proteins: total β-catenin expression (F, G); active β-catenin (F′, G′); c-myc (H, H'); cyclin D1 (I, I'); p19 (J, J); p53 (K, K); AKT-PS473 L, M, N, N'. and ERK-P O, O'. in RbF/F;K14creERTM;E2F4−/− (F, G, H, I, J, K, L, M. N, O) and RbF/F;K14creERTM F', G', H', I', J', K', N'. epidermis. Bars=150 μm.
Figure 4
Figure 4. Epidermal Proliferation in RbF/F;K14creERTM;E2F4−/− mice
A, B. Double immunofluorescence showing the expression of K5 (green) and BrdU (red) incorporation in the RbF/F;K14creERTM;E2F4−/− epidermis (A) and in carcinoma in situ areas (B). Bars=150 μm C. Quantitative analysis of BrdU incorporation in epidermis of the quoted genotypes. Data come from at least three mice per genotype scoring three different sections per mouse; data are shown as mean±s.e. (p values are denoted by asterisks: * p<0.05, *** p<0.005, **** p<0.0001 analyzed by unpaired Mann-Whitney t Tests).
Figure 5
Figure 5. Epidermal stem cell niche is altered in RbF/F;K14creERTM;E2F4−/− mice
A, B. Representative double immunofluorescence images showing the expression of the cell stem markers K15 (green) and CD34 (red) in hair follicles of RbF/F; K14creERTM (A) and RbF/F;K14creERTM;E2F4−/− (B) respectively. Nuclei were stained with DAPI (blue). C-D. Double immunofluorescence showing BrdU incorporation (red) in the K15 positive cells (green) in RbF/F;K14creERTM (C) and RbF/F;K14creERTM;E2F4−/− (D) epidermis. Bars= 150 μm E. Quantitative analysis of BrdU incorporation in K15+ cells of the quoted genotypes. Data come from at least five mice per genotype scoring three different sections per mouse and are shown as mean±s.e. F. Quantitative analysis of the relative expression of different genes involved in epidermal stem cells homeostasis (Lgr5, Lgr6, Blimp1, Lhx2 and Sox9) in the quoted genotypes (n=6) using qRT-PCR. GusB gene was used as a control for normalization. Samples come from total skin and are shown as mean±s.e.m. (p values in E, F are denoted by asterisks: * p<0.05, *** p<0.005 analyzed by unpaired Mann-Whitney t Tests).
Figure 6
Figure 6. p63 shows an aberrant expression pattern in Rbf/f;K14creERTM;E2F4−/− mouse epidermis
A, A'. Representative immunohistochemistry of p63 expression. B, B'. Double immunofluorescence showing K5 (green) and p63 (red) in Rbf/f;K14creERTM;E2F4−/− epidermis. Bars= 50 μm. C. Quantitative analysis of the relative expression of p63 (ΔNp63 and TAp63) in the quoted genotypes by qPCR (n=6). GusB gene was used as a control for normalization. Samples come from total skin and are shown as mean±s.e.m. (p values are denoted by asterisks: *** p<0.005, analyzed by unpaired Mann-Whitney t Tests).
Figure 7
Figure 7. Genome-wide transcriptome comparison between Rbf/f;K14creERTM;E2F4−/− and Rbf/f;K14creERTM skin
A. Heatmap of the microarray analyses showing 523 transcripts upregulated and 628 transcripts downregulated in Rbf/f;K14creERTM;E2F4−/− compared to Rbf/f;K14creERTM skin. B, C. Enrichment analyses of Gene Ontology of the downregulated (B) and upregulated (C) genes. D, E. ChEA analyses showing the transcription factors exclusively regulating the downregulated (D) and upregulated genes (E). F. ChEA analyses showing the transcription factors involved in the regulation of both upregulated and downregulated genes.
Figure 8
Figure 8. Expression of the E2F transcription factor family
Quantitative analysis of the relative expression of E2F family genes (E2f1-E2f8) in quoted genotypes by qRT-PCR (n=6). GusB gene was used as a control for normalization. Samples come from total skin and are shown as mean±s.e.m. (p values are denoted by asterisks: * p<0.05, ** p<0.01, *** p<0.005 analyzed by unpaired Mann-Whitney t Tests).
Figure 9
Figure 9. Genome-wide transcriptome comparison between Rbf/f;K14creERTM;E2F1−/− and Rbf/f;K14creERTM;E2F4−/− skin
A. Heatmap of the microarray analyses showed 742 transcripts upregulated and 598 transcripts downregulated in Rbf/f; K14creERTM;E2F4−/− compared to Rbf/f;K14creERTM;E2F1−/. B, C. Enrichment analyses of Gene Ontology of the downregulated (B) and upregulated (C) genes. D, E. ChEA analyses showing the transcription factors exclusively regulating the downregulated (D) and upregulated genes (E). F. ChEA analyses showing the transcription factors involved in the regulation of both upregulated and downregulated.

Similar articles

Cited by

References

    1. Blanpain C, Fuchs E. Epidermal homeostasis: a balancing act of stem cells in the skin. Nat Rev Mol Cell Biol. 2009;10:207–217. - PMC - PubMed
    1. Gandarillas A. The mysterious human epidermal cell cycle, or an oncogene-induced differentiation checkpoint. Cell Cycle. 2012;11:4507–4516. - PMC - PubMed
    1. Frolov MV, Dyson NJ. Molecular mechanisms of E2F-dependent activation and pRB-mediated repression. J Cell Sci. 2004;117(Pt 11):2173–2181. - PubMed
    1. Paramio JM, Lain S, Segrelles C, Lane EB, Jorcano JL. Differential expression and functionally co-operative roles for the retinoblastoma family of proteins in epidermal differentiation. Oncogene. 1998;17:949–957. - PubMed
    1. Paramio JM, Segrelles C, Casanova ML, Jorcano JL. Opposite functions for E2F1 and E2F4 in human epidermal keratinocyte differentiation. J Biol Chem. 2000;275:41219–41226. - PubMed