. 2016 Oct 6:7:13027.
doi: 10.1038/ncomms13027.

Loss of immune tolerance to IL-2 in type 1 diabetes

Affiliations

Loss of immune tolerance to IL-2 in type 1 diabetes

Louis Pérol et al. Nat Commun. .

Abstract

Type 1 diabetes (T1D) is characterized by a chronic, progressive autoimmune attack against pancreas-specific antigens, effecting the destruction of insulin-producing β-cells. Here we show interleukin-2 (IL-2) is a non-pancreatic autoimmune target in T1D. Anti-IL-2 autoantibodies, as well as T cells specific for a single orthologous epitope of IL-2, are present in the peripheral blood of non-obese diabetic (NOD) mice and patients with T1D. In NOD mice, the generation of anti-IL-2 autoantibodies is genetically determined and their titre increases with age and disease onset. In T1D patients, circulating IgG memory B cells specific for IL-2 or insulin are present at similar frequencies. Anti-IL-2 autoantibodies cloned from T1D patients demonstrate clonality, a high degree of somatic hypermutation and nanomolar affinities, indicating a germinal centre origin and underscoring the synergy between cognate autoreactive T and B cells leading to defective immune tolerance.


Conflict of interest statement

E.P., L.P, and I.C. together with Inserm have filed a provisional patent application that relates to diagnostic methods of an autoimmune disease (WO 2015162124 A1). All other authors declare no competing financial interests.

Figures

Figure 1
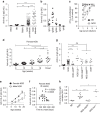
Figure 1. High-doses rhIL-2 injection in NOD induce neutralizing anti-rhIL-2 antibodies.
(af) Five-to-14-week-old male or female NOD mice were daily treated with PBS or high-doses rhIL-2 (250,000; 500,000 or 1,000,000 IU) over 30 days. (a,b) Kaplan-Meier survival curves of treated female (a, top panel) or male (b, top panel) mice; and diabetes incidence in female (a, bottom panel) or male (b, bottom panel) mice. (c) Percentage of dead, diabetic or alive and non-diabetic NOD mice after 30 days of treatment; IL-2-treated: pool of (250,000; 500,000 and 1,000,000 IU IL-2 treated mice. (d) Percentage of Foxp3+ among CD3+ CD4+ splenocytes of NOD mice treated for 5 to 30 days with high-doses IL-2 or PBS. (e) Serum anti-rhIL-2 IgG titres of untreated B6 mice and pre-diabetic NOD mice treated for 0, 7 or 30 days with high-dose IL-2. (f) Proliferation of CTLL-2 cells cultured for 3 days with 3 IU ml−1 rhIL-2 and serially diluted serum from B6 (closed circles) or NOD mice treated for 30 days with high-dose rhIL-2 (open circles). Proliferation is expressed as percentage of control (CTLL-2 cultured for 3 days with 3 IU ml−1 rhIL-2 without mouse serum). Data are cumulative of at least two independent experiments. ns, not significant. ***P<0.001 (non-parametric Mann-Whitney test).
Figure 2
Figure 2. Anti-mIL-2-autoantibodies in NOD mice.
(ac) Serum samples were obtained from different mouse strains: NSG (NOD scid gamma), B6, Balb/c, pre-diabetic NOD (NOD Pre-diabetic) and diabetic NOD (NOD Diabetic). (a,b) Serum titres of anti-mIL-2 IgG (a), IgG isotypes (IgG1, 2b, 2c and 3) and IgA (b) in the different strains. (c) Proliferation of CTLL-2 cells cultured for 3 days with 1 ng ml−1 mIL-2 and different concentrations of B6 (closed circles) or NOD (open circles) sera. Proliferation is expressed as percentage of control (CTLL-2 cultured for 3 days with 1 ng ml−1 mIL-2 without mouse serum, mean c.p.m. of 84,590). (df) Sera were obtained at different ages after birth and at disease onset (Onset) in two independent cohorts of female NOD mice (n=13 and 6, respectively) and one cohort of male NOD mice (n=5). (d,e) Serum anti-mIL-2 IgG titres in NOD mice in function of the age (d) or of the sex (e). Dashed line indicates the mean value given by B6 mouse sera in the corresponding ELISA. (f) Correlation between anti-mIL-2 IgG titres at 6 weeks and time to onset of diabetes in female NOD mice (non-parametric Spearman correlation test). (g,h) Serum samples were obtained from different mouse strains (all females and age-matched): B6, wild-type NOD, NOD.Idd3B6, Il2-hemizygous NOD: NOD.Idd3NOD/NOD-IL-2null (NOD.Il2+/−), NOD.Idd6C3H and their corresponding controls NOD.Idd6NOD, as well as NOR. Serum titres of anti-mIL-2 IgG (g) and IL-2/anti-rhIL-2-autoantibodies complex (h) in the different mouse strains. Symbols and curves represent individual mice, horizontal bars are the medians and error bars represent the s.e.m. Data are cumulative of at least two independent experiments. ns, not significant. *P<0.05; **P<0.01; ***P<0.001 (non-parametric Mann-Whitney test).
Figure 3
Figure 3. NOD mice present B and T autoimmune responses against mIL-2.
(a,b) The number of anti-mIL-2 secreting cells in fresh splenocytes and bone marrow cells (plasma cells, a) or in 5-days CpG pre-activated splenocytes (memory B cells, b) from 10–18 week-old female B6 or pre-diabetic NOD mice was quantified by ELISPOT. (c) IFN-γ production by 10–18-week-old female B6 (n=3) or pre-diabetic NOD (n=7) splenocytes was quantified in culture supernatants by CBA after 72 h of stimulation with DMSO, mIL-2 peptides that gave a positive response in the initial screen (3 and 10 μM of each peptide), P31 peptide (3 and 10 μM) or aCD3-CD28 coated beads (ratio 1bead:1cell). (d) mIL-2 amino acid sequence. The regions corresponding to peptides that gave positive results in the initial screen are underlined and the immunodominant peptides (mIL-210-24 and mIL-267-81) are in bold. The mIL-2 signal peptide is indicated by a rectangle. (ac) Symbols represent individual mice and horizontal bars are the medians. Data are cumulative of at least two independent experiments. (a,b) *P<0.05 (Kruskal-Wallis test with Dunn's multiple comparisons test).
Figure 4
Figure 4. T1D patients present a humoural autoimmune response against IL-2.
(a) Percentage of anti-rhIL-2 positive subjects among five different cohorts: serum samples were obtained from healthy donors (HD, n=249) and patients diagnosed with type 2 (T2D; n=24) or type 1 diabetes (n=39 in cohort 1, n=15 in cohort 2 and n=21 in cohort 3). P-values were calculated using pairwise Fisher exact tests. (b) IgG subclass-specific anti-IL2 ELISA in T1D patients, absorbance OD measured at 450 after incubation of sera diluted 1:50. (c) T1D patient samples were divided into three groups based on EC50 values for an IL-2 direct ELISA from total sera (weak, moderate and strong binders) and are plotted relative to the anti-IL-2 EC50 value of IgG purified from the respective serum sample. Mean and s.d. overlay individual data points, and P-values were calculated using Welch's t-test. (d) (upper panel) rhIL-2 competition ELISA using IgG purified from the sera of T1D patients, with the control (lower panel) of an anti-influenza ELISA with competing soluble rhIL-2.
Figure 5
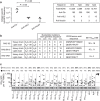
Figure 5. Circulating anti-IL-2-specific B and T lymphocytes in T1D patients.
(a) (Left) Relative frequency and (right) absolute numbers of antigen-specific IgG memory B cells across four T1D patients. Error bars represent s.d., P-values calculated using an unpaired t-test. (b) IL-2-specific heavy and light chain V gene segment usage, CDR3 amino acid sequences, and rhIL-2 solution equilibrium titration (SET) affinity for recombinant IgG obtained from a single T1D patient, (c) IFN-γ production by peripheral blood mononuclear cells (PBMCs) from healthy donors (HD) (n=14, closed circles) or T1D patients (n=13, open circles) quantified by ELISPOT after stimulation with rhIL-2 (Proleukin, Pro) or Pro peptides (10 μM per each), intracellular IA-2, adenovirus lysate (AdV), or PHA. The number of IFN-γ spot-forming cells (SFC)/106 PBMCs is depicted, the dashed line indicates the positive cut-off threshold, and the grey shaded area shows undetectable responses (that is, identical to spontaneous background responses; see material and methods for threshold determination). The percent of positive T1D (top number) and HD (bottom number) is indicated for each condition, with antigens yielding responses significantly different between HD and T1D patients in bold (P<0.03 using the Fisher exact test).
Figure 6
Figure 6. High frequencies of anti-IL-2 autoantibodies are present in different autoimmune diseases.
(a) Serum samples were obtained from healthy donors (HD, n=249), T1D (n=75 in the three pooled cohorts), multiple sclerosis (MS; n=33), Sjögren syndrome (SJO; n=22), anti-JO1 positive polymyositis (JO1; n=16), rheumatoid arthritis (RA; n=33), systemic lupus erythematosus (SLE; n=20), chronic inflammatory demyelinating neuropathy (CIPD; n=51) and cancer (Cancer; n=128) patients. Cancer patients were used as controls for a non-autoimmune disease. Left panel: serum titres of anti-rhIL-2 IgG in the different cohorts. Dashed line indicates the threshold of positivity. Right panel: percentage of anti-rhIL-2 positive subjects among the different cohorts. Symbols represent individual subjects and horizontal bars are the medians. *P<0.05; ***P<0.001 (Fisher exact test). (b) To control the anti-rhIL-2 autoantibody specificity a competition ELISA was performed. Sera from one anti-rhIL-2-autoantibodies healthy donor (HD) or from anti-rhIL-2-autoantibodies+ samples from HD and T1D, T2D, SLE, RA, Sjögren syndrome (SJO), polymyositis (JO1) patients were pre-incubated or not for 1 h with increasing amounts of free recombinant rhIL-2 and titres of anti-rhIL-2 were then quantified by ELISA. Shown is percentage of inhibition of the ELISA signal calculated as (OD with rhIL-2 competition) × 100/(OD without competition). Curves represent individual subjects. Data are cumulative of three independent experiments. (c) Titres of anti-mIL-2 IgG were quantified by ELISA in the sera of B6 and 4-month-old lupus-prone mice B6/lpr mice. Each serum was tested once or twice in duplicate. Symbols represent individual mice and horizontal bars are the medians. *P<0.05 (non-parametric Mann-Whitney test).

References

    1. Browne S. K. Anticytokine autoantibody-associated immunodeficiency. Ann. rev. immunol. 32, 635–657 (2014). - PubMed
    1. Piccoli L. et al.. Neutralization and clearance of GM-CSF by autoantibodies in pulmonary alveolar proteinosis. Nat. commun. 6, 7375 (2015). - PMC - PubMed
    1. Malek T. R. The biology of interleukin-2. Ann. rev. immunol. 26, 453–479 (2008). - PubMed
    1. Bach J. F. Insulin-dependent diabetes mellitus as an autoimmune disease. Endocr. rev. 15, 516–542 (1994). - PubMed
    1. Herold K. C., Vignali D. A., Cooke A. & Bluestone J. A. Type 1 diabetes: translating mechanistic observations into effective clinical outcomes. Nat. rev. Immunol. 13, 243–256 (2013). - PMC - PubMed

Publication types

MeSH terms

Grants and funding