. 2016 Oct 6:6:34785.
doi: 10.1038/srep34785.

Single cell dynamic phenotyping

Affiliations

Single cell dynamic phenotyping

Katherin Patsch et al. Sci Rep. .

Abstract

Live cell imaging has improved our ability to measure phenotypic heterogeneity. However, bottlenecks in imaging and image processing often make it difficult to differentiate interesting biological behavior from technical artifact. Thus there is a need for new methods that improve data quality without sacrificing throughput. Here we present a 3-step workflow to improve dynamic phenotype measurements of heterogeneous cell populations. We provide guidelines for image acquisition, phenotype tracking, and data filtering to remove erroneous cell tracks using the novel Tracking Aberration Measure (TrAM). Our workflow is broadly applicable across imaging platforms and analysis software. By applying this workflow to cancer cell assays, we reduced aberrant cell track prevalence from 17% to 2%. The cost of this improvement was removing 15% of the well-tracked cells. This enabled detection of significant motility differences between cell lines. Similarly, we avoided detecting a false change in translocation kinetics by eliminating the true cause: varied proportions of unresponsive cells. Finally, by systematically seeking heterogeneous behaviors, we detected subpopulations that otherwise could have been missed, including early apoptotic events and pre-mitotic cells. We provide optimized protocols for specific applications and step-by-step guidelines for adapting them to a variety of biological systems.


Figures

Figure 1
Figure 1. Overview of the workflow.
(a) Experimental setup and image acquisition. Top: Cells were seeded onto 96-well plates, allowed to adhere overnight and imaged the next day. Parallel acquisition of multiple wells allowed for analysis of different experimental conditions including controls. Middle: Multiple fields per well (indicated as grid) increased throughput and enabled technical replicates. Bottom: Time-lapse imaging and generation of initial tracking data. (b) Steps of the workflow including image acquisition, phenotype tracking, and data filtering. (c) Examples of assay outputs we measured to track heterogeneity of cellular dynamics. Imaging increment was set according to the expected timescale of response. Top: Protein translocation of ligand-stimulated GFP-tagged receptors. Cells were imaged every minute for 30 min, nuclear to cytoplasmic ratios of GFP intensity (GFPnuc/cyto) of single cells were plotted over time. Representative cell with GFP translocating to the nucleus is depicted at baseline, intermediate and final time points. Middle: Cell death assays. Cells were imaged every 5 min for 5–12 h and nuclear area and caspase activity of single cells were measured over time. Representative cell’s nucleus condensing in the second half of the experiment and initiating effector caspases in response to phototoxic imaging conditions is depicted at baseline, intermediate and final time points. Bottom: Cell proliferation assays. Cells were imaged every 30 min for 20 h and mitosis in single cells was tracked over time. Representative cell dividing to 2 daughter cells is depicted to highlight multi-generation tracking.
Figure 2
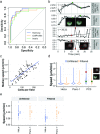
Figure 2. Tracking individual cells in heterogeneous populations.
(a) Comparison of ROC curves based on data from Harmony AUC = 0.93, CI95% = [0.87,0.98] (blue), CellProfiler, AUC = 0.92, CI95% = [0.84, 0.99] (yellow) and Imaris, AUC = 0.89 95%CI = [0.81–0.97] (green). (b) Cell not rejected due to TrAM outlined in green (τ = 2.79). Below outlined in red, cell excluded from evaluation due to TrAM value > 4.81 threshold (τ = 36.33). Nuclear area and roundness are plotted over time. Smoothed curves represent typical fluctuation between adjacent time points. Cell segmentation images correspond to highlighted data points. (c) Adjustment of PC3 cell motility to high density imaging areas (R2 = 0.66). Plot correlates number of cells per imaging field with current speed. Each dot represents an imaging well of a 96-well plate. (d) Speed distribution of PC3, HeLa and Panc-1 cells before (blue) and after (yellow) TrAM filtering. PC3 data points indicate average speed of examples of high and low τ shown in b. (e) Speed distribution of HeLa (n = 26 fields, SEM = 0.005) vs. Panc-1 (6 fields, SEM = 0.006) cells post-filtering, p < 0.0007 (right panel). In comparison, speed distribution pre-filtering, HeLa SEM = 0.005, Panc-1 SEM = 0.006, p < 0.58 (2-sided t-test) (left panel).
Figure 3
Figure 3. Dynamic measurements of ligand-stimulated protein translocation.
(a) Nuclear to cytoplasmic GFP intensities in PC3 GFP-AR cells plotted over time. Controls include a non-responsive PC3-GFP cell population (black triangles) and mock-treated cells (black circles). Shaded regions correspond to one standard deviation. (b) Effect of 2-step filtering (incomplete tracks + τ) to exclude erroneous cell tracks: bad tracks vs. good tracks. (c) Responders vs. non-responders with nuclear to cytoplasmic GFP intensity change < 0.147. (d) Left panel: Example of responding cell not rejected due to GFPnuc/cyto change > 0.147 (1.05). Snapshots of GFP-AR, nuclear DRAQ5 and overlay at baseline (T0) and at endpoint (T30). Right panel: Comparison cell rejected due to GFPnuc/cyto change 0.012. (e + f) Effect of filtering on AR translocation kinetics of clonal (yellow) vs. polyclonal (blue) cell lines. Nuclear to cytoplasmic GFP intensities plotted over time. (e) Unfiltered data: 0.60 GFPnuc/cyto increase in K22 vs. 0.33 in polyclonal cells, 95% CI of [0.21,0.33], p < 2e-16, first order linear model). (f) Filtered data: 0.67 GFPnuc/cyto increase in K22 vs. 0.60 in polyclonal cells, 95% CI of [−0.01, 0.14], p = 0.11, first order linear model).
Figure 4
Figure 4. Tracking nuclear morphology.
(a) K-means clustering of TrAM filtered HeLa cells stained with nuclear DRAQ5 into 7 subpopulations of distinct nuclear morphology trajectories. Dotted line represents population average. (b) Example cell with 54% nuclear area decrease due to phototoxic response vs. stable cells. Nuclear areas are plotted over time. Cell segmentation images corresponding to color marked data points depicted on top. Color of arrows and data points indicate the cluster cells fall under in a. (c–e) Application of TrAM filter threshold τ = 3.71 and cell cycle tracking. (c) Box plots of nuclear area normalized to mitotic events detected in Harmony. Nuclei preparing for mitosis depicted in light blue, just born nuclei depicted in dark blue. (d) Single cell undergoing mitosis, detected in Harmony and by 37% nuclear area change at T14. Nuclear areas of mother and daughter cells plotted over time. Corresponding cell segmentation images depicted above.

References

    1. Purvis J. E. & Lahav G. Encoding and decoding cellular information through signaling dynamics. Cell 152, 945–956 (2013). - PMC - PubMed
    1. Altschuler S. J. & Wu & Cellular Heterogeneity: Do Differences Make a Difference? Cell 141, 559–563 (2010). - PMC - PubMed
    1. Snijder B. & Pelkmans L. Origins of regulated cell-to-cell variability. Nat. Rev. Mol. Cell Biol. 12, 119–125 (2011). - PubMed
    1. Aw Yong K. M. et al.. Morphological effects on expression of growth differentiation factor 15 (GDF15), a marker of metastasis. J. Cell. Physiol. 229, 362–373 (2014). - PMC - PubMed
    1. Purvis J. E. et al.. p53 dynamics control cell fate. Science 336, 1440–1444 (2012). - PMC - PubMed

Publication types