. 2016 Sep 21:7:406.
doi: 10.3389/fphys.2016.00406. eCollection 2016.

Modeling Ca2+-Bound Troponin in Excitation Contraction Coupling

Affiliations

Modeling Ca2+-Bound Troponin in Excitation Contraction Coupling

Henry G Zot et al. Front Physiol. .

Abstract

To explain disparate decay rates of cytosolic Ca2+ and structural changes in the thin filaments during a twitch, we model the time course of Ca2+-bound troponin (Tn) resulting from the free Ca2+ transient of fast skeletal muscle. In fibers stretched beyond overlap, the decay of Ca2+ as measured by a change in fluo-3 fluorescence is significantly slower than the intensity decay of the meridional 1/38.5 nm-1 reflection of Tn; this is not simply explained by considering only the Ca2+ binding properties of Tn alone (Matsuo et al., 2010). We apply a comprehensive model that includes the known Ca2+ binding properties of Tn in the context of the thin filament with and without cycling crossbridges. Calculations based on the model predict that the transient of Ca2+-bound Tn correlates with either the fluo-3 time course in muscle with overlapping thin and thick filaments or the intensity of the meridional 1/38.5 nm-1 reflection in overstretched muscle. Hence, cycling crossbridges delay the dissociation of Ca2+ from Tn. Correlation with the fluo-3 fluorescence change is not causal given that the transient of Ca2+-bound Tn depends on sarcomere length, whereas the fluo-3 fluorescence change does not. Transient positions of tropomyosin calculated from the time course of Ca2+-bound Tn are in reasonable agreement with the transient of measured perturbations of the Tn repeat in overlap and non-overlap muscle preparations.

Keywords: EC-coupling; calcium; contraction; excitation; kinetics; model; muscle; troponin.


Figures
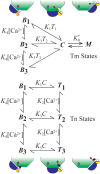
Figure 1
Figure 1
Summary of model. The model consists of two subsystems that partially overlap. The states of Tm (blue) include central (C), myosin-dependent (M), and blocking (Bi, i = 1–3). States of Tn (TnT, yellow; TnI, magenta; TnC, black-white) include energetically coupled (Bi) and uncoupled (Ti) states each having regulatory sites of TnC that can be Ca2+-free (i = 1; white), singly Ca2+-bound (i = 2; black), and doubly Ca2+-bound (i = 3; black). The diagram shows how Tn is isolated from a site of interaction with actin (gray oval) by the movement of Tm from position B to positions C and M. All constants depicted in the figure represent the ratio of component rate constants (Table 1) used to calculate the relative abundance or probability of each state as a function of a transient change in calcium concentration.
Figure 2
Figure 2
Standard transient of free Ca2+ and final steady-state conditions. Transient free Ca2+ data (dots) reproduced from Matsuo et al. (2010) are fit empirically by a mathematical function (green). Inset, Steady-state activation (M state) is plotted as a function of free Ca2+ concentration on absolute (purple) and normalized (black) scales. Adjusting steady-state constants (Table 2) shifts the curves for activation laterally (Δxss). Predicted Ca2+-bound Tn curves (gold) that simulate no crossbridges (1 pt. line), saturating rigor crossbridges (3 pt. line), and cycling crossbridges (2 pt. gold line) are calculated with K0 set to 0, 106, and 1, respectively, under the standard equilibrium/steady-state conditions of Table 1. Hill coefficients (Hill, 1910) of unity are determined for curves representing no crossbridges and rigor crossbridges.
Figure 3
Figure 3
Time courses of principle states of the thin filament with overlap. Plotted as a function of a pulse of free calcium (green) are calculated transients of states B (dark blue), C (red), and M (black). Total Ca2+-bound Tn (B2 + B3 + T2 + T3; gold) is broken down into components, i.e., fast (B2 + B3; blue) and slow (T2 + T3; gray). Plotted on the same scale are measured tension (circles) and fluo-3 fluorescence (squares) transients of muscle fibers of average sarcomere length of 2.8 μm and stimulated by a single impulse (reproduced from Matsuo et al., 2010). Adjustments in standard conditions (Table 1) alter the width (ΔxM), height (ΔyM), and center of the M peak (O) as described in Table 2.
Figure 4
Figure 4
Time courses of principle states of the thin filament with no overlap. Plotted as a function of a pulse of free calcium (green) are calculated transients of states B (dark blue), C (red), and M (black). Total Ca2+-bound Tn (B2 + B3 + T2 + T3; gold) is broken down into fast (B2 + B3; blue) and slow (T2 + T3; gray) components. For comparison, the measured fluo-3 fluorescence transient (squares) is reproduced from Figure 3.
Figure 5
Figure 5
Time courses of fluo-3 fluorescence and transient structural changes of troponin in nonoverlap sarcomeres. Changes in intensity of the meridional 1/38.5 nm−1 reflection (triangles) and of fluo-3 fluorescence (squares) in response to a single calcium pulse are reproduced for muscle stretched beyond overlap (Matsuo et al., 2010). Plotted on the same scale in response to a simulated calcium pulse (Figure 2) are the calculated temporal change of state C (red) and calcium bound to troponin (gold) under standard conditions (Table 1) with K0 set to null. Other adjustments in standard conditions (Table 2) alter the decay rate of Ca2+-bound Tn (ΔxCaB) and the relationship with the state C transient (Δdif C).
Figure 6
Figure 6
Model compared with temporal responses measured in overlap sarcomeres. Intensities of the meridional 1/38.5 nm−1 reflection (triangles), tension (circles), and fluo-3 fluorescence (squares) for average sarcomere length of 2.8 μm in response to a single calcium pulse are reproduced (Matsuo et al., 2010). Plotted on the same scale in response to a simulated calcium pulse (Figure 2) are the calculated temporal changes of states C (red) and M (black) and Ca2+-bound Tn (gold) under standard conditions (Table 1). Adjustments in standard conditions (Table 2) alter the decay rate of Ca2+-bound Tn (ΔxCaB).
Figure 7
Figure 7
Predicted time course of crossbridge-dependent Ca2+-bound Tn. Crossbridge-dependent Ca2+-bound Tn is the residual (dashed line) obtained by subtracting Ca2+-bound Tn calculated for the non-overlap preparation (Figure 4) from Ca2+-bound Tn calculated for the overlap preparation (solid gold line; Figure 3). The stimulus for both conditions (green) is taken from Figure 2.

Similar articles

Cited by

References

    1. Baylor S. M., Hollingworth S. (1998). Model of sarcomeric Ca2+ movements, including ATP Ca2+ binding and diffusion, during activation of frog skeletal muscle. J. Gen. Physiol. 112, 297–316. 10.1085/jgp.112.3.297 - DOI - PMC - PubMed
    1. Baylor S. M., Hollingworth S. (2007). Simulation of Ca2+ movements within the sarcomere of fast-twitch mouse fibers stimulated by action potentials. J. Gen. Physiol. 130, 283–302. 10.1085/jgp.200709827 - DOI - PMC - PubMed
    1. Baylor S. M., Hollingworth S. (2011). Calcium indicators and calcium signalling in skeletal muscle fibres during excitation-contraction coupling. Prog. Biophys. Mol. Biol. 105, 162–179. 10.1016/j.pbiomolbio.2010.06.001 - DOI - PMC - PubMed
    1. Baylor S. M., Hollingworth S., Chandler W. K. (2002). Comparison of simulated and measured calcium sparks in intact skeletal muscle fibers of the frog. J. Gen. Physiol. 20, 349–368. 10.1085/jgp.20028620 - DOI - PMC - PubMed
    1. Brandt P. W., Poggesi C. (2014). Clusters of bound Ca2+ initiate contraction in fast skeletal muscle. Arch. Biochem. Biophys. 552–553, 60–67. 10.1016/j.abb.2013.12.013 - DOI - PubMed

LinkOut - more resources