. 2016 Sep 21:7:128.
doi: 10.3389/fendo.2016.00128. eCollection 2016.

Increased Circulating Adiponectin in Response to Thiazolidinediones: Investigating the Role of Bone Marrow Adipose Tissue

Affiliations

Increased Circulating Adiponectin in Response to Thiazolidinediones: Investigating the Role of Bone Marrow Adipose Tissue

Richard J Sulston et al. Front Endocrinol (Lausanne). .

Abstract

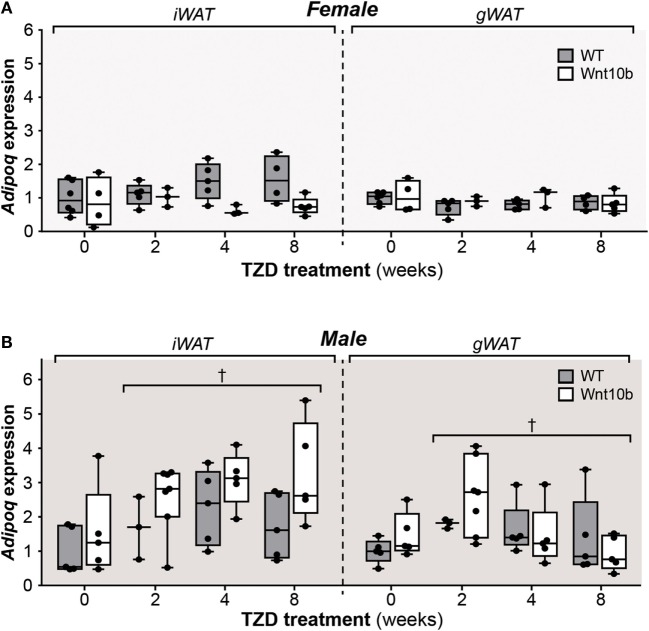
Background: Bone marrow adipose tissue (MAT) contributes to increased circulating adiponectin, an insulin-sensitizing hormone, during caloric restriction (CR), but whether this occurs in other contexts remains unknown. The antidiabetic thiazolidinediones (TZDs) also promote MAT expansion and hyperadiponectinemia, even without increasing adiponectin expression in white adipose tissue (WAT).

Objectives: To test the hypothesis that MAT expansion contributes to TZD-associated hyperadiponectinemia, we investigated the effects of rosiglitazone, a prototypical TZD, in wild-type (WT) or Ocn-Wnt10b mice. The latter resist MAT expansion during CR, leading us to postulate that they would also resist this effect of rosiglitazone.

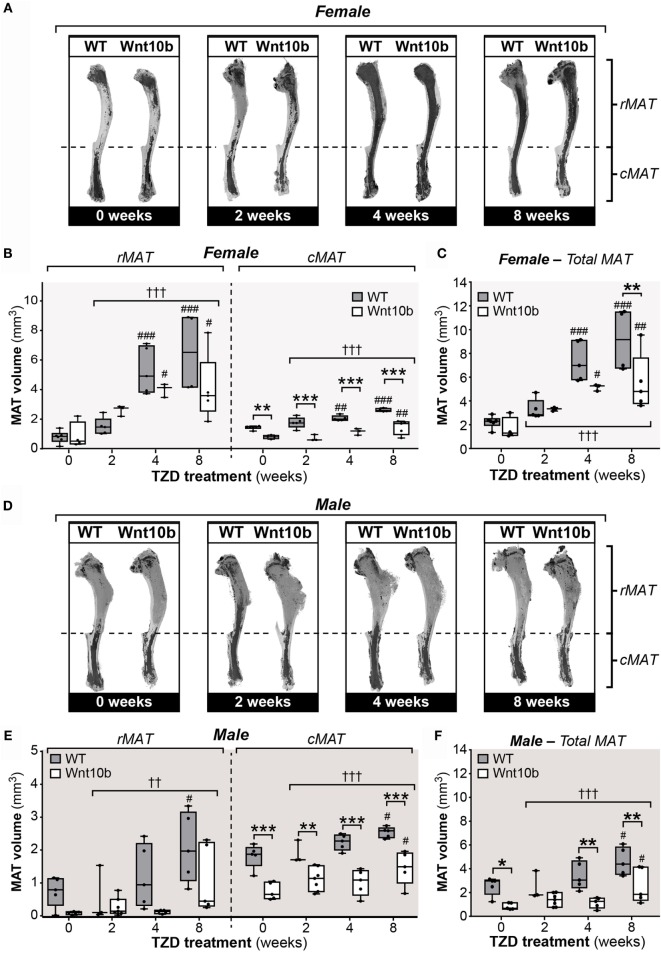
Design: Male and female WT or Ocn-Wnt10b mice (C57BL/6J) were treated with or without rosiglitazone for 2, 4, or 8 weeks, up to 30 weeks of age. MAT content was assessed by osmium tetroxide staining and adipocyte marker expression. Circulating adiponectin was determined by ELISA.

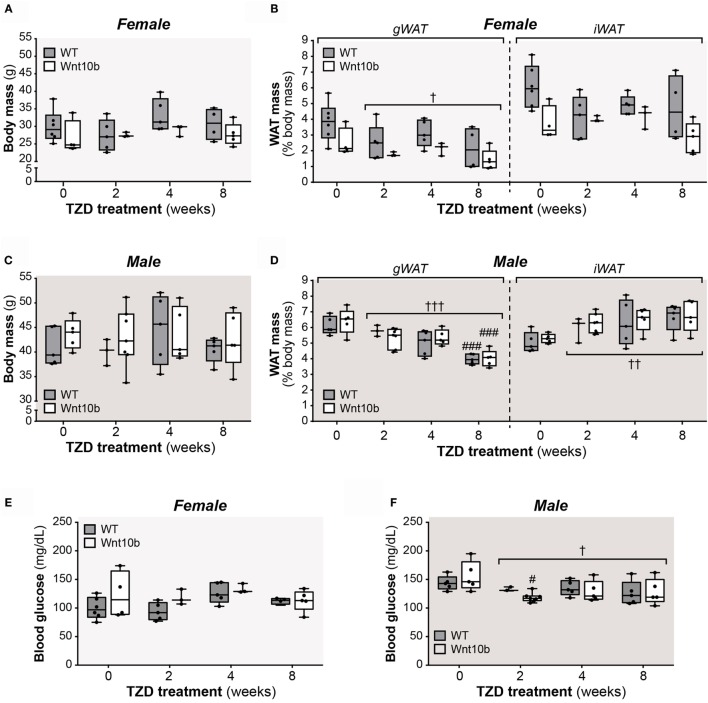
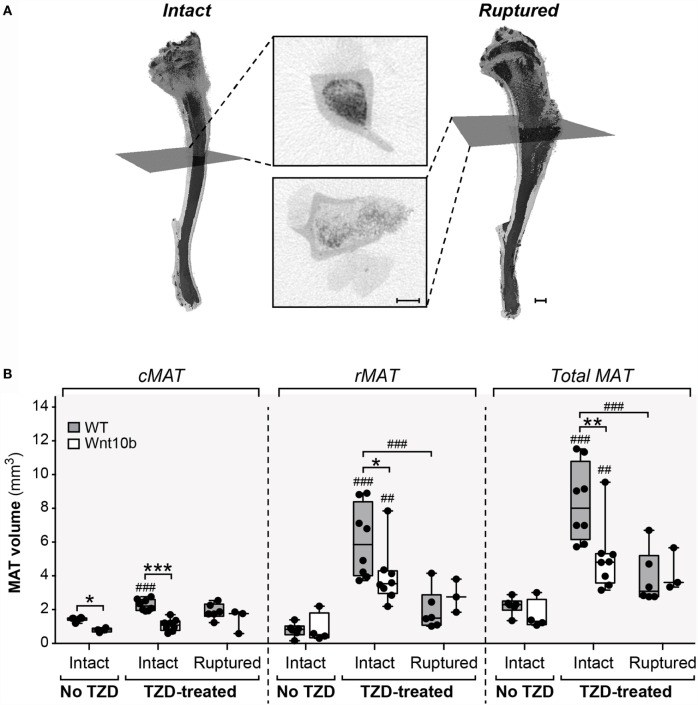
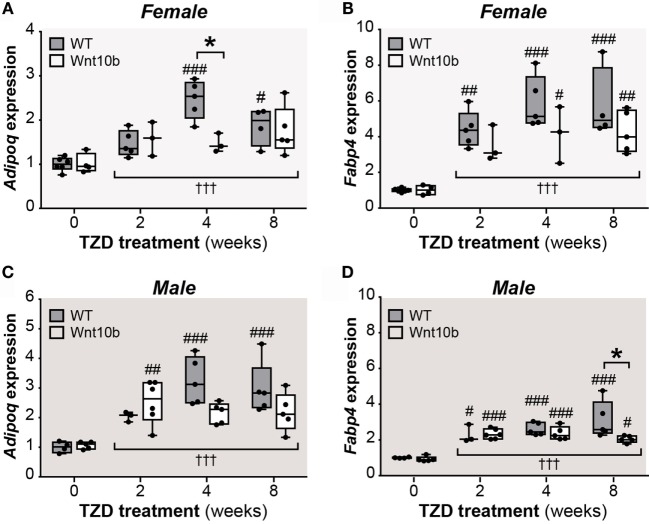
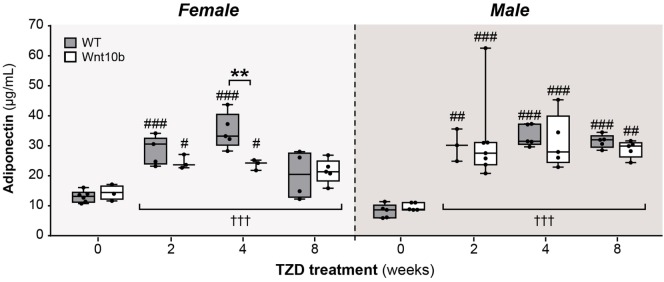
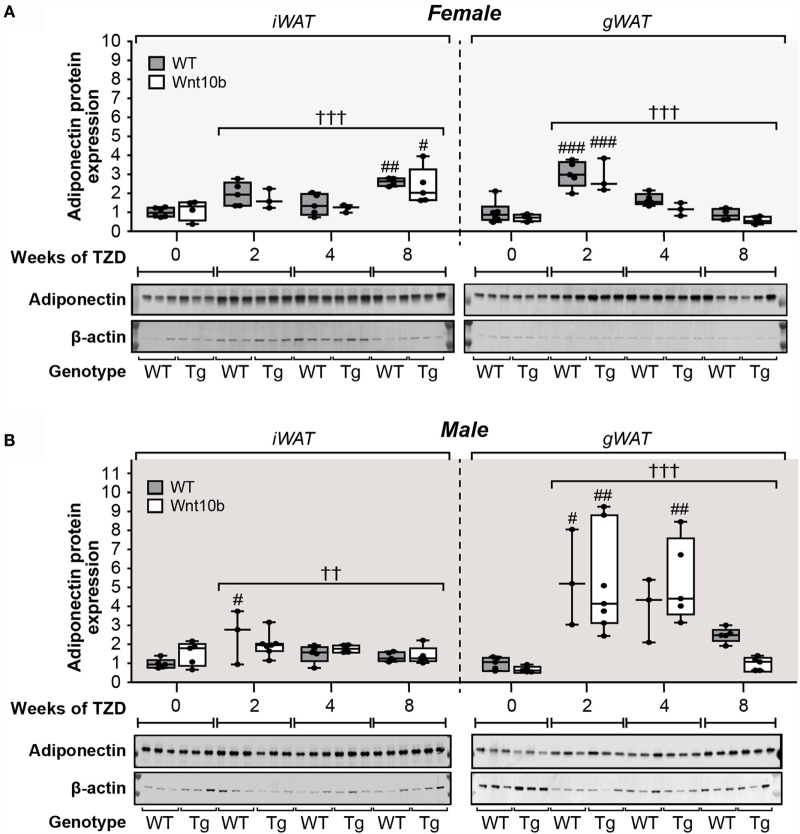
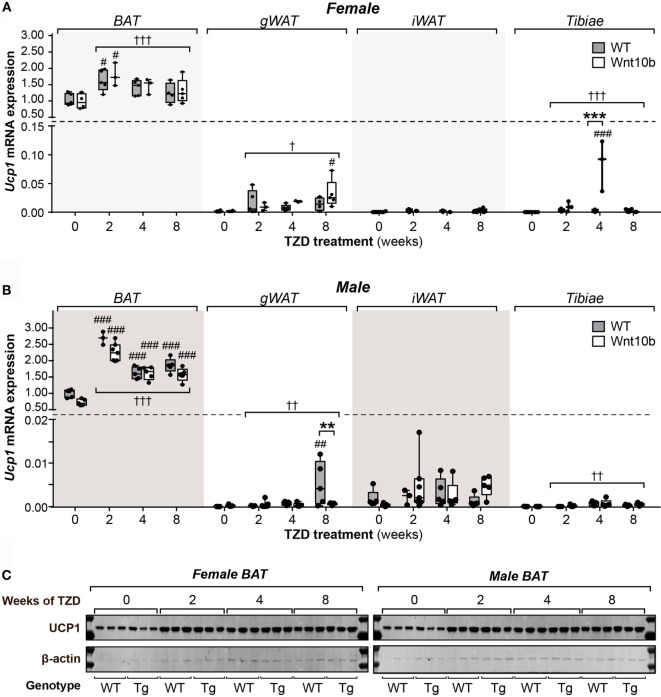
Results: In WT mice, rosiglitazone caused hyperadiponectinemia and MAT expansion. Compared to WT mice, Ocn-Wnt10b mice had significantly less MAT in distal tibiae and sometimes in proximal tibiae; however, interpretation was complicated by the leakage of osmium tetroxide from ruptures in some tibiae, highlighting an important technical consideration for osmium-based MAT analysis. Despite decreased MAT in Ocn-Wnt10b mice, circulating adiponectin was generally similar between WT and Ocn-Wnt10b mice; however, in females receiving rosiglitazone for 4 weeks, hyperadiponectinemia was significantly blunted in Ocn-Wnt10b compared to WT mice. Notably, this was also the only group in which tibial adiponectin expression was lower than in WT mice, suggesting a close association between MAT adiponectin production and circulating adiponectin. However, rosiglitazone significantly increased adiponectin protein expression in WAT, suggesting that WAT contributes to hyperadiponectinemia in this context. Finally, rosiglitazone upregulated uncoupling protein 1 in brown adipose tissue (BAT), but this protein was undetectable in tibiae, suggesting that MAT is unlikely to share thermogenic properties of BAT.

Conclusion: TZD-induced hyperadiponectinemia is closely associated with increased adiponectin production in MAT but is not prevented by the partial loss of MAT that occurs in Ocn-Wnt10b mice. Thus, more robust loss-of-MAT models are required for future studies to better establish MAT's elusive functions, both on an endocrine level and beyond.

Keywords: UCP1; adiponectin; beige adipocyte; bone marrow adipose tissue; brown adipose tissue; rosiglitazone; thiazolidinedione; white adipose tissue.


Figures

Figure 1
Figure 1
Effects of rosiglitazone on body mass, fat mass, and fasting glucose. Male and female mice were fed a control Western diet only or a Western diet supplemented with rosiglitazone for 2, 4, or 8 weeks, as described in Section “Materials and Methods.” (A,C) Body masses of females (A) and males (C) were recorded prior to necropsy at 30 weeks of age. (B,D) Masses of iWAT and gWAT were recorded at necropsy for female (B) and male mice (D) and are shown as percentage of total body mass. (E,F) Fasting blood glucose, as recorded at 29.5 weeks of age. For (A–F), a significant influence of TZD treatment, across all treatment groups, is indicated by † (P < 0.05), †† (P < 0.01) or ††† (P < 0.001). Within each genotype, significant differences between untreated controls (0-week TZD) and individual durations of TZD treatment are indicated by ### (P < 0.001). Within each TZD treatment group (0-, 2-, 4-, or 8-week TZD), there were no statistically significant differences between WT and Ocn-Wnt10b mice.
Figure 2
Figure 2
Rosiglitazone increases rMAT and cMAT volume in WT mice and cMAT expansion is blunted in Ocn-Wnt10b mice. Male and female tibiae were dissected at necropsy. For each mouse, one tibia was decalcified in EDTA, stained with 1% osmium tetroxide, and analyzed by μCT scanning, as described in Section “Materials and Methods.” (A,D) Representative μCT scans of stained tibiae from female (A) and male mice (D). The dashed line indicates the tibia–fibula junction as the boundary between rMAT and cMAT. (B,C,E,F) For female (B,C) and male mice (E,F), μCT scans were used to determine the volumes of rMAT (proximal to tibia–fibula junction), cMAT (distal to tibia–fibula junction), and total MAT (whole tibia), as indicated. In (B,E), volumes of rMAT and cMAT are presented on the same y-axis scale. A significant influence of TZD treatment, across all treatment groups, is indicated by † (P < 0.05), †† (P < 0.01) or ††† (P < 0.001). Within each genotype, significant differences between TZD-treated mice and untreated controls are indicated by # (P < 0.05), ## (P < 0.01) or ### (P < 0.001). Within each TZD treatment group, statistically significant differences between WT and Ocn-Wnt10b mice are indicated by * (P < 0.05), ** (P < 0.01), or *** (P < 0.001).
Figure 3
Figure 3
Cortical bone ruptures significantly decrease detectable rMAT volume. All male and some female tibiae had ruptured cortical bone near the proximal end, causing a large reduction in signal. (A) Representative 3D models of intact (non-ruptured) and ruptured tibiae from 8-week-TZD-treated females, with cross-sectional images showing loss of MAT signal (dark regions within bone marrow cavity). Gray squares across the 3D models indicate the slices from which cross-sectional images are taken. Scale bars = 500 μm. (B) Tibiae from female WT or Ocn-Wnt10b mice were categorized into bones from mice untreated with TZD, all of which were intact; intact bones from TZD-treated mice; and ruptured bones from TZD-treated mice. The volume of cMAT, rMAT, and total MAT in these bones was determined from μCT scans. Statistically significant differences between untreated (intact), TZD-treated (intact), and TZD-treated (ruptured) samples are indicated by ## (P < 0.01) or ### (P < 0.001). Within each group, statistically significant differences between WT and Ocn-Wnt10b mice are indicated by * (P < 0.05), ** (P < 0.01), or *** (P < 0.001).
Figure 4
Figure 4
TZD increases adipocyte marker expression in tibiae, suggesting MAT expansion. Male and female tibiae were dissected at necropsy, and total RNA was isolated from one tibia of each mouse. Expression of Adipoq (A,C) and Fabp4 transcripts (B,D) in female and male mice was determined by qPCR and is presented normalized Ppia mRNA expression. Statistical significance is presented, as described in Figure 2, for the influence of TZD across all groups, and for differences between TZD-treated and untreated mice (within each genotype) or WT and Ocn-Wnt10b mice (within each TZD group).
Figure 5
Figure 5
TZD induces hyperadiponectinemia to a similar extent in WT and Ocn-Wnt10b mice. Serum was isolated from mice at 30 weeks of age and ELISA used to determine concentrations of total adiponectin in female and male mice, as indicated. For each sex, statistical significance for the influence of TZD across all groups, and for differences between TZD-treated and untreated mice (within each genotype) or WT and Ocn-Wnt10b mice (within each TZD group), are presented as described for Figure 2.
Figure 6
Figure 6
Rosiglitazone treatment or Wnt10b transgene expression does not alter adiponectin transcript expression in WAT. At necropsy, iWAT and gWAT were dissected, and total RNA was isolated from portions of each tissue. Expression of Adipoq in female (A) and male mice (B) was determined by qPCR and is presented normalized Ppia mRNA expression. Across all groups, statistically significant effects of TZD are presented as described for Figure 2, while significant effects of genotype are described in the text. There were no statistically significant differences between TZD-treated and untreated mice (within each genotype) or between WT and Ocn-Wnt10b mice (within each TZD group), as determined by two-way ANOVA.
Figure 7
Figure 7
Rosiglitazone increases adiponectin protein expression in WAT in a depot- and sex-specific manner. At necropsy, iWAT and gWAT were dissected, and total protein was isolated from portions of each tissue. Lysates were separated by SDS-PAGE and expression of adiponectin protein determined by immunoblotting; β-actin expression was analyzed as a loading control. Immunoblots shown in (A,B) are representative of three mice per group. Samples from Ocn-Wnt10b mice are labeled “Tg.” Band intensities from these blots and further blots of the remaining samples were quantified using Image Studio Lite software. Adiponectin expression was then normalized to expression of β-actin for (A) Males and (B) Females, with representative blots shown beneath. For each sex, statistically significant differences between TZD-treated and untreated mice (within each genotype) or between WT and Ocn-Wnt10b mice (within each TZD group) are presented as described for Figure 2.
Figure 8
Figure 8
Rosiglitazone increases UCP1 mRNA and protein in BAT not in WAT or tibiae. Total RNA and protein were isolated from interscapular BAT, gWAT, iWAT, and whole tibiae. (A,B) Ucp1 transcript expression in each tissue of female (A) and male mice (B) was quantified by qPCR and normalized to expression of Ppia mRNA. In each tissue, statistically significant differences between TZD-treated and untreated mice (within each genotype) or between WT and Ocn-Wnt10b mice (within each TZD group) were determined by two-way ANOVA and are presented as described for Figure 2. (C) Protein lysates from BAT were separated by SDS-PAGE and expression of UCP1 protein determined by immunoblotting; β-actin expression was analyzed as a loading control. Immunoblots are representative of three mice per group. Samples from Ocn-Wnt10b mice are labeled “Tg.” UCP1 protein could not be detected in gWAT, iWAT, or tibiae (data not shown).

References

    1. Rosen ED, Spiegelman BM. What we talk about when we talk about fat. Cell (2014) 156(1–2):20–44.10.1016/j.cell.2013.12.012 - DOI - PMC - PubMed
    1. Scheller EL, Burr AA, MacDougald OA, Cawthorn WP. Inside out: bone marrow adipose tissue as a source of circulating adiponectin. Adipocyte (2016) 5(3):251–69.10.1080/21623945.2016.1149269 - DOI - PMC - PubMed
    1. Cawthorn WP, Scheller EL, Learman BS, Parlee SD, Simon BR, Mori H, et al. Bone marrow adipose tissue is an endocrine organ that contributes to increased circulating adiponectin during caloric restriction. Cell Metab (2014) 20(2):368–75.10.1016/j.cmet.2014.06.003 - DOI - PMC - PubMed
    1. Scheller EL, Doucette CR, Learman BS, Cawthorn WP, Khandaker S, Schell B, et al. Region-specific variation in the properties of skeletal adipocytes reveals regulated and constitutive marrow adipose tissues. Nat Commun (2015) 6:7808.10.1038/ncomms8808 - DOI - PMC - PubMed
    1. Scheller EL, Cawthorn WP, Burr AA, Horowitz MC, MacDougald OA. Marrow adipose tissue: trimming the fat. Trends Endocrinol Metab (2016) 27(6):392–403.10.1016/j.tem.2016.03.016 - DOI - PMC - PubMed