

Mitochondrial Haplogroup Influences Motor Function in Long-Term HIV-1-Infected Individuals
- PMID: 27711166
- PMCID: PMC5053473
- DOI: 10.1371/journal.pone.0163772
Mitochondrial Haplogroup Influences Motor Function in Long-Term HIV-1-Infected Individuals
Abstract
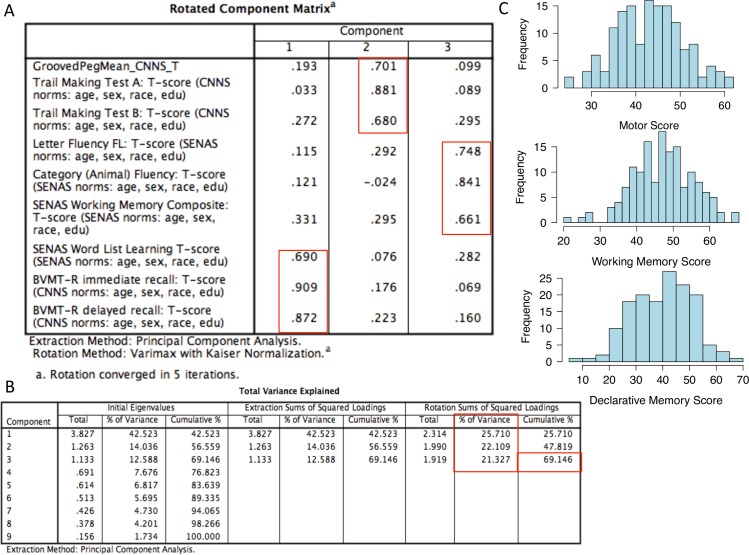
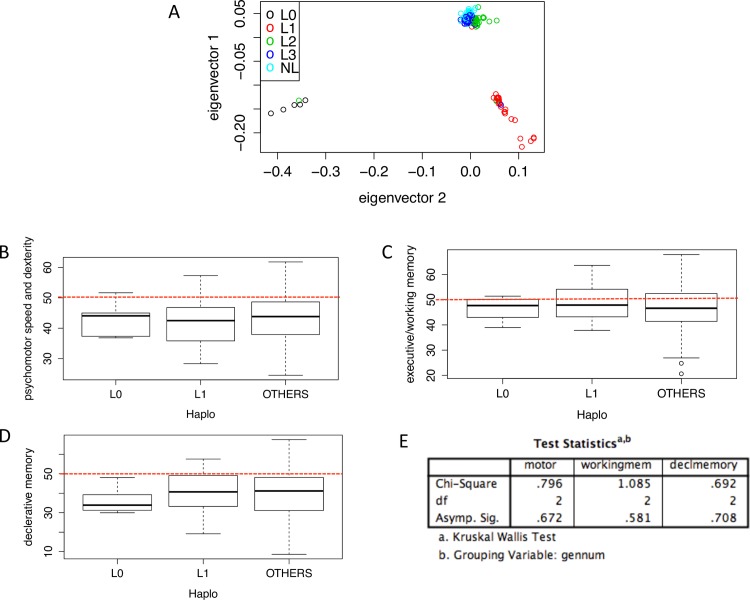
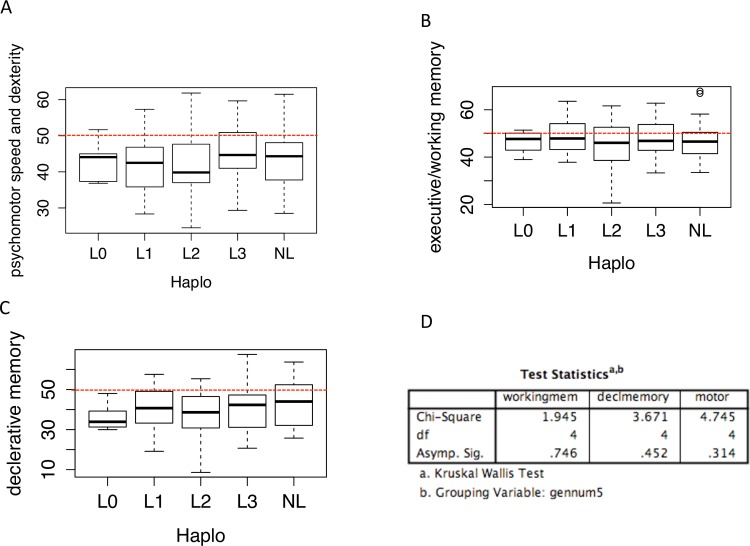
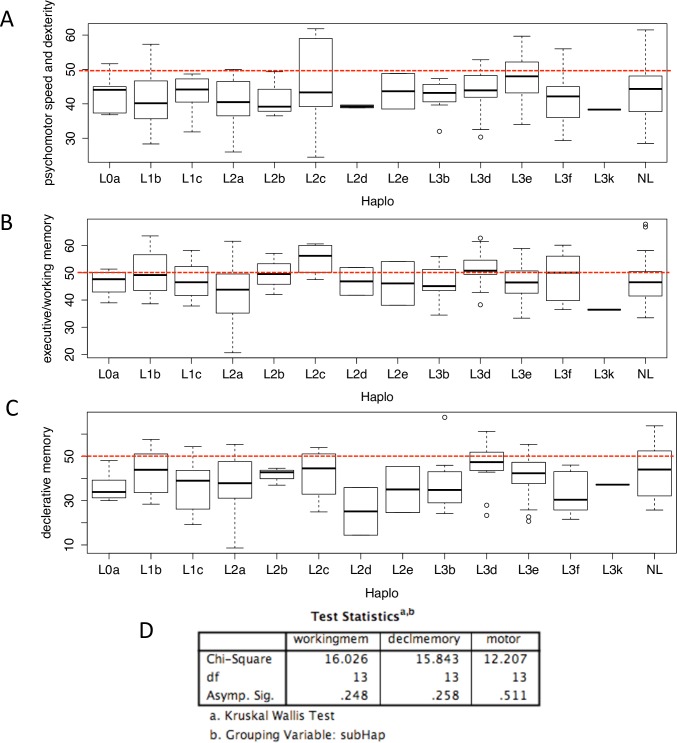
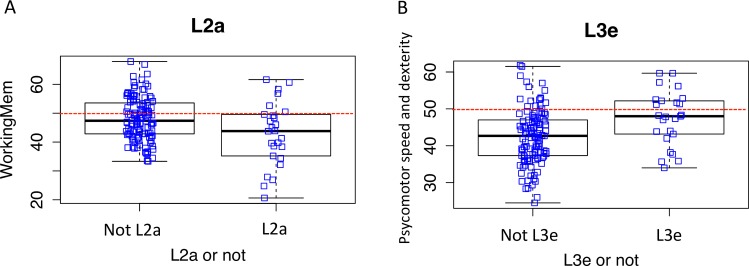
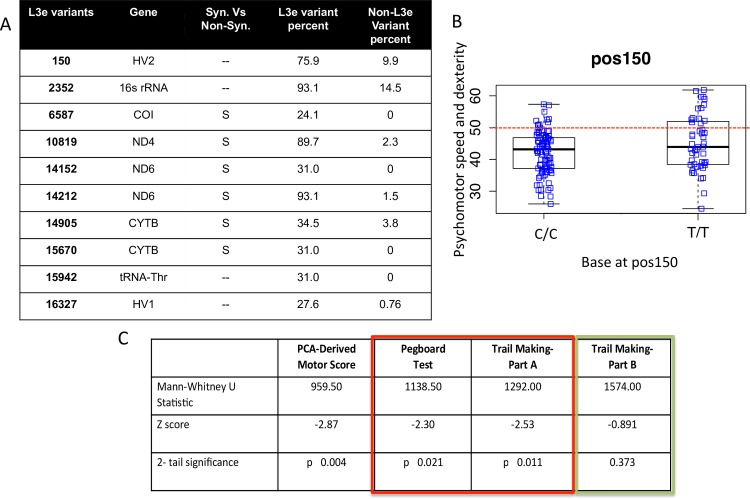
Evolutionary divergence of the mitochondrial genome has given rise to distinct haplogroups. These haplogroups have arisen in specific geographical locations and are responsible for subtle functional changes in the mitochondria that may provide an evolutionary advantage in a given environment. Based on these functional differences, haplogroups could define disease susceptibility in chronic settings. In this study, we undertook a detailed neuropsychological analysis of a cohort of long-term HIV-1-infected individuals in conjunction with sequencing of their mitochondrial genomes. Stepwise regression analysis showed that the best model for predicting both working memory and declarative memory were age and years since diagnosis. In contrast, years since diagnosis and sub-haplogroup were significantly predictive of psychomotor speed. Consistent with this, patients with haplogroup L3e obtained better scores on psychomotor speed and dexterity tasks when compared to the remainder of the cohort, suggesting that this haplogroup provides a protective advantage when faced with the combined stress of HIV-1 infection and long-term antiretroviral therapies. Differential performance on declarative memory tasks was noted for individuals with other sub-L haplogroups, but these differences were not as robust as the association between L3e and psychomotor speed and dexterity tasks. This work provides evidence that mitochondrial haplogroup is related to neuropsychological test performance among patients in chronic disease settings such as HIV-1 infection.
Conflict of interest statement
The authors have declared that no competing interests exist.
Figures
Similar articles
-
Mitochondrial DNA haplogroups and domain-specific neurocognitive performance in adults with HIV.J Neurovirol. 2021 Aug;27(4):557-567. doi: 10.1007/s13365-021-00989-7. Epub 2021 Jun 8. J Neurovirol. 2021. PMID: 34101088 Free PMC article.
-
Mitochondrial haplogroup H is related to CD4+ T cell recovery in HIV infected patients starting combination antiretroviral therapy.J Transl Med. 2018 Dec 6;16(1):343. doi: 10.1186/s12967-018-1717-y. J Transl Med. 2018. PMID: 30522500 Free PMC article.
-
Mitochondrial DNA variation and HIV-associated sensory neuropathy in CHARTER.J Neurovirol. 2012 Dec;18(6):511-20. doi: 10.1007/s13365-012-0133-y. Epub 2012 Oct 17. J Neurovirol. 2012. PMID: 23073667 Free PMC article.
-
Epidermal nerve fiber density, oxidative stress, and mitochondrial haplogroups in HIV-infected Thais initiating therapy.AIDS. 2014 Jul 17;28(11):1625-33. doi: 10.1097/QAD.0000000000000297. AIDS. 2014. PMID: 24785954 Free PMC article. Clinical Trial.
-
Mitochondrial haplogroups and peripheral neuropathy during antiretroviral therapy: an adult AIDS clinical trials group study.AIDS. 2005 Sep 2;19(13):1341-9. doi: 10.1097/01.aids.0000180786.02930.a1. AIDS. 2005. PMID: 16103764 Clinical Trial.
Cited by
-
Heterogeneity of Neuropsychological Impairment in HIV Infection: Contributions from Mild Cognitive Impairment.Neuropsychol Rev. 2017 Jun;27(2):101-123. doi: 10.1007/s11065-017-9348-2. Epub 2017 May 24. Neuropsychol Rev. 2017. PMID: 28536861 Review.
-
The association of mitochondrial DNA haplogroups with POAG in African Americans.Exp Eye Res. 2019 Apr;181:85-89. doi: 10.1016/j.exer.2019.01.015. Epub 2019 Jan 15. Exp Eye Res. 2019. PMID: 30653964 Free PMC article.
-
Mitochondrial DNA haplogroups and domain-specific neurocognitive performance in adults with HIV.J Neurovirol. 2021 Aug;27(4):557-567. doi: 10.1007/s13365-021-00989-7. Epub 2021 Jun 8. J Neurovirol. 2021. PMID: 34101088 Free PMC article.
References
-
- Palella FJ Jr, Delaney KM, Moorman AC, Loveless MO, Fuhrer J, Satten GA, et al. Declining morbidity and mortality among patients with advanced human immunodeficiency virus infection. HIV Outpatient Study Investigators. N Engl J Med. 1998;338(13):853–60. Epub 1998/03/27. 10.1056/NEJM199803263381301 . - DOI - PubMed
-
- Stoff DM, Khalsa JH, Monjan A, Portegies P. Introduction: HIV/AIDS and Aging. Aids. 2004;18 Suppl 1:S1–2. Epub 2004/04/13. . - PubMed
-
- Xu J, Ikezu T. The comorbidity of HIV-associated neurocognitive disorders and Alzheimer's disease: a foreseeable medical challenge in post-HAART era. Journal of neuroimmune pharmacology: the official journal of the Society on NeuroImmune Pharmacology. 2009;4(2):200–12. 10.1007/s11481-008-9136-0 - DOI - PMC - PubMed
MeSH terms
Grants and funding
LinkOut - more resources
Full Text Sources
Other Literature Sources
Medical
