Randomized Controlled Trial
. 2016 Oct 6;11(10):e0163832.
doi: 10.1371/journal.pone.0163832. eCollection 2016.

The Role of Vitamin D in the Transcriptional Program of Human Pregnancy

Affiliations
Randomized Controlled Trial

The Role of Vitamin D in the Transcriptional Program of Human Pregnancy

Amal Al-Garawi et al. PLoS One. .

Abstract

Background: Patterns of gene expression of human pregnancy are poorly understood. In a trial of vitamin D supplementation in pregnant women, peripheral blood transcriptomes were measured longitudinally on 30 women and used to characterize gene co-expression networks.

Objective: Studies suggest that increased maternal Vitamin D levels may reduce the risk of asthma in early life, yet the underlying mechanisms have not been examined. In this study, we used a network-based approach to examine changes in gene expression profiles during the course of normal pregnancy and evaluated their association with maternal Vitamin D levels.

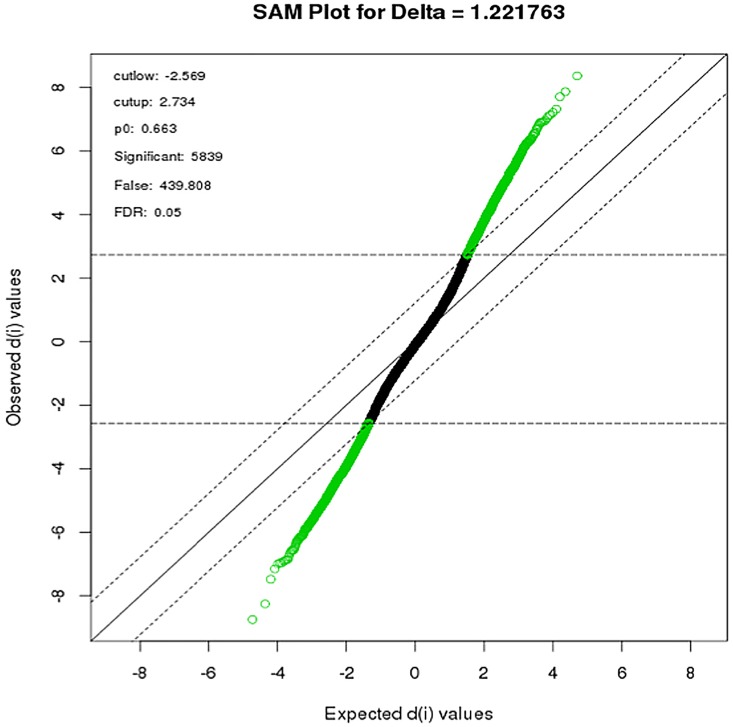
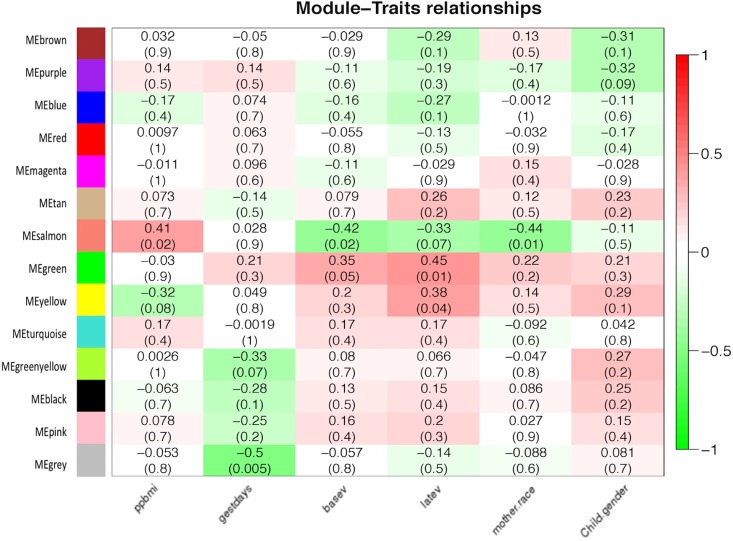
Design: The VDAART study is a randomized clinical trial of vitamin D supplementation in pregnancy for reduction of pediatric asthma risk. The trial enrolled 881 women at 10-18 weeks of gestation. Longitudinal gene expression measures were obtained on thirty pregnant women, using RNA isolated from peripheral blood samples obtained in the first and third trimesters. Differentially expressed genes were identified using significance of analysis of microarrays (SAM), and clustered using a weighted gene co-expression network analysis (WGCNA). Gene-set enrichment was performed to identify major biological pathways.

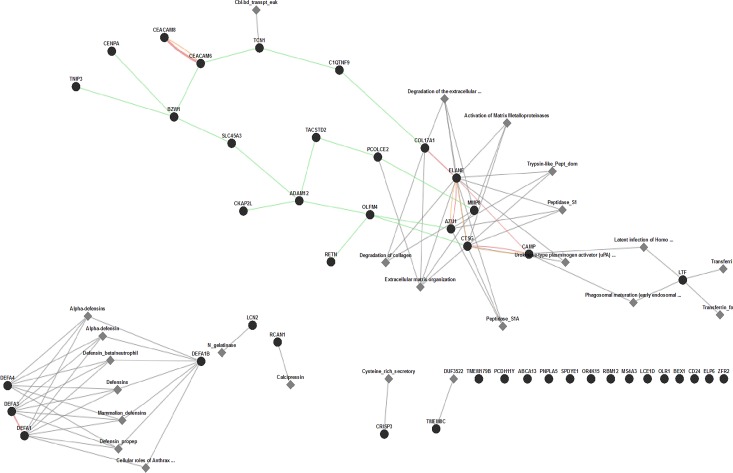
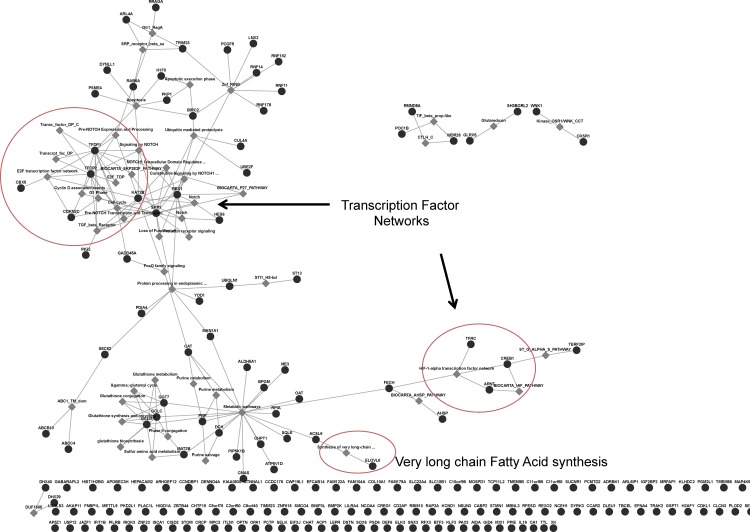
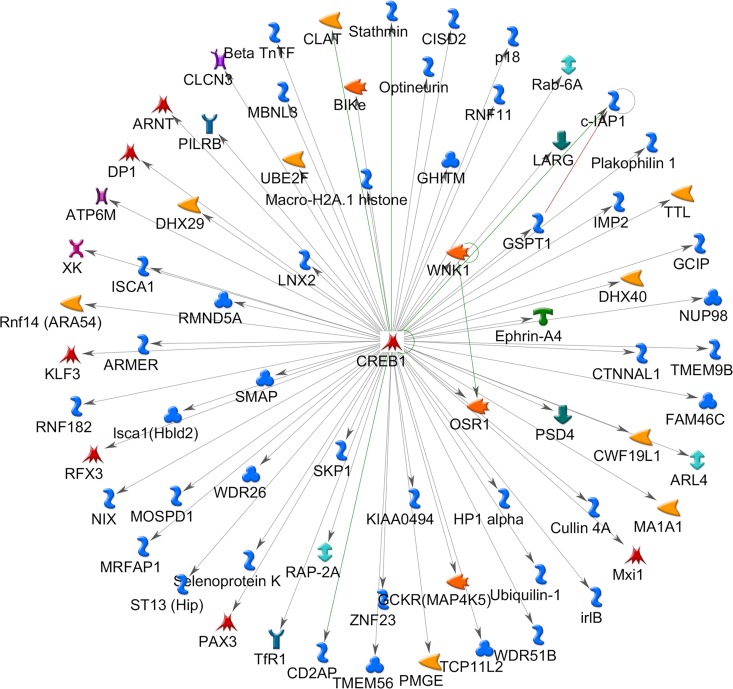
Results: Comparison of transcriptional profiles between first and third trimesters of pregnancy identified 5839 significantly differentially expressed genes (FDR<0.05). Weighted gene co-expression network analysis clustered these transcripts into 14 co-expression modules of which two showed significant correlation with maternal vitamin D levels. Pathway analysis of these two modules revealed genes enriched in immune defense pathways and extracellular matrix reorganization as well as genes enriched in notch signaling and transcription factor networks.

Conclusion: Our data show that gene expression profiles of healthy pregnant women change during the course of pregnancy and suggest that maternal Vitamin D levels influence transcriptional profiles. These alterations of the maternal transcriptome may contribute to fetal immune imprinting and reduce allergic sensitization in early life.

Trial registration: clinicaltrials.gov NCT00920621.


Conflict of interest statement

The authors have declared that no competing interests exist.

Figures

Fig 1
Fig 1. SAM plot of maternal gene expression during the course of pregnancy:
Differentially expressed gene-probes were identified by plotting the Observed test scores (di) against expected scores at a threshold of delta = 1.22 (parallel lines) and FDR = 0.05. 2734 genes had d-values greater than the expected d-value (up regulated) while 2589 had d-values lower than expected (down-regulated). Modified t-test, adjusted for multiple testing (BH), adjusted p-value <0.05.
Fig 2
Fig 2. Weighted gene coexpression network analysis and associations with clinical traits:
Weighted Co-expression Network Analysis (WGCNA) was carried out on 5839 differentially expressed probes identified by SigGenes. 14 co-expression modules were identified and, and correlated to various clinical traits. Gene network, represented by different colored coded co-expression modules (y-axis) and their association with various clinical traits (x-axis). The intensity of the colors indicates the strength of the relationship, as indicated by the scale to the right. The range of the scale (+1 to -1) indicates either positive (+1) or negative (-1) correlation with a specific clinical trait. Top number in each box corresponds to the Pearson’s correlation coefficient between a module and a specific trait, while the lower number represents its p-value. Traits: ppbmi = pre-pregnancy BMI; gestdays = gestational age; basev = Vitamin D levels in 1st trimester; latev = Vitamin D levels in 3rd trimester; mother.race = maternal race (White/African-American); Child.gender = infant gender (boy/girl). Pearson’s correlation (p<0.05).
Fig 3
Fig 3. Functional Pathway Enrichment of Genes in Salmon Module.
Gene maps constructed based on evidence from genetic (green line), physical (red line) and predicted (yellow line) interaction. The distance between groups of genes reflects the strength of their relationship and groups of genes that are more closely related are clustered together. Functional Pathway analysis revealing most enriched pathways based on InterPro, Pathway Commons and Transcription Factor target databases. The resulting visual map represents known functional pathways involving salmon gene nodes. Black circle = nodes, grey diamonds = enriched functional pathways
Fig 4
Fig 4. Functional Pathway Enrichment of Genes in Green Module.
Functional Pathway analysis of genes in green module revealing most enriched pathways based on InterPro, Pathway Commons and Transcription Factor target databases. The distance between groups of genes reflects the strength of their relationship and groups of genes that are more closely related are clustered together. Black circle = nodes, grey diamonds = enriched functional pathways
Fig 5
Fig 5. Transcription factor enrichment analysis of Green module genes.
CREB1 transcription factor network depicting CREB1 in center and known interactions among 72 genes demonstrating various functionality within the green module. Hypergeometric test adjusted for multiple comparisons using Benjamini & Hochberg (p<0.05).

References

    1. Barker DJ, Osmond C. Diet and coronary heart disease in England and Wales during and after the second world war. Journal of epidemiology and community health. 1986;40(1):37–44. Epub 1986/03/01. 10.1136/jech.40.1.37 - DOI - PMC - PubMed
    1. Peters JL, Boynton-Jarrett R, Sandel M. Prenatal environmental factors influencing IgE levels, atopy and early asthma. Current opinion in allergy and clinical immunology. 2013;13(2):187–92. Epub 2013/02/07. 10.1097/ACI.0b013e32835e82d3 . - DOI - PubMed
    1. Burke H, Leonardi-Bee J, Hashim A, Pine-Abata H, Chen Y, Cook DG, et al. Prenatal and passive smoke exposure and incidence of asthma and wheeze: systematic review and meta-analysis. Pediatrics. 2012;129(4):735–44. Epub 2012/03/21. 10.1542/peds.2011-2196 . - DOI - PubMed
    1. Montefort S, Ellul P, Montefort M, Caruana S, Grech V, Agius Muscat H. The effect of cigarette smoking on allergic conditions in Maltese children (ISAAC). Pediatric allergy and immunology: official publication of the European Society of Pediatric Allergy and Immunology. 2012;23(5):472–8. Epub 2012/03/23. 10.1111/j.1399-3038.2012.01276.x . - DOI - PubMed
    1. Xu CR, Feeney AJ. The epigenetic profile of Ig genes is dynamically regulated during B cell differentiation and is modulated by pre-B cell receptor signaling. Journal of immunology. 2009;182(3):1362–9. Epub 2009/01/22. 10.4049/jimmunol.182.3.1362 - DOI - PMC - PubMed

Publication types

Associated data