Review
. 2017 Jan 18;23(4):725-751.
doi: 10.1002/chem.201603884. Epub 2016 Dec 5.

NMR Hyperpolarization Techniques of Gases

Affiliations
Review

NMR Hyperpolarization Techniques of Gases

Danila A Barskiy et al. Chemistry. .

Abstract

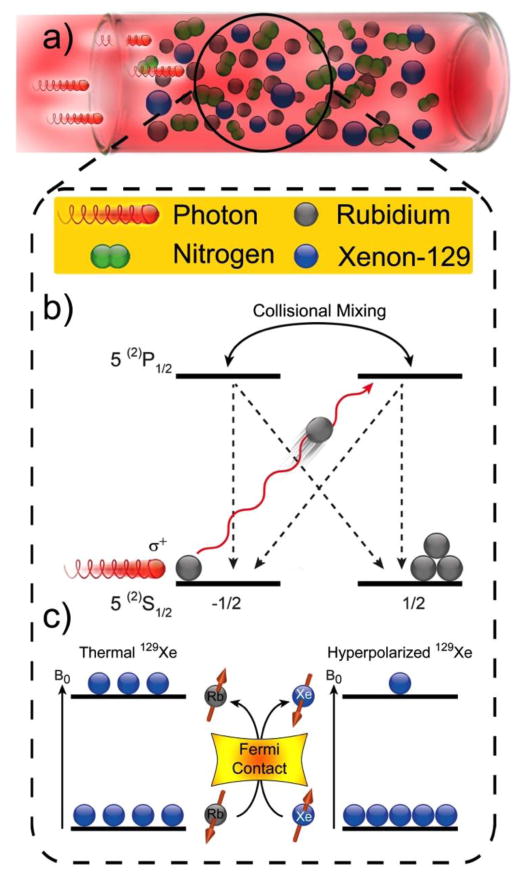
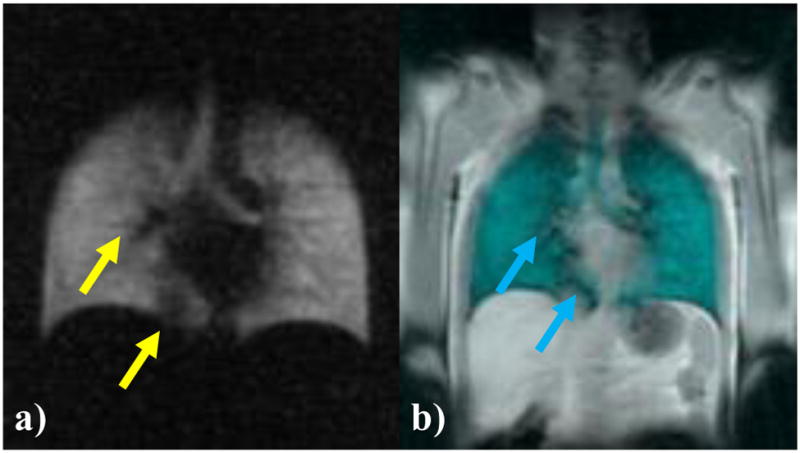
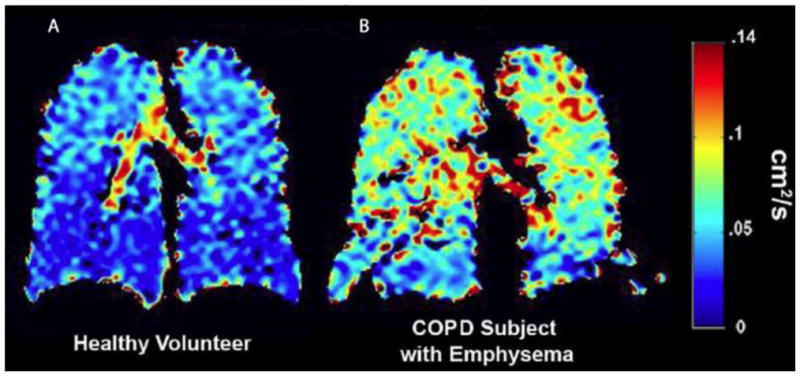
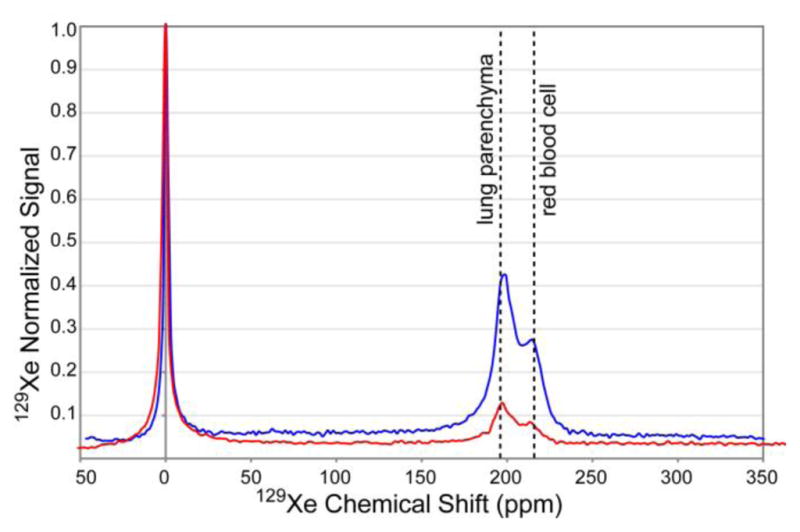
Nuclear spin polarization can be significantly increased through the process of hyperpolarization, leading to an increase in the sensitivity of nuclear magnetic resonance (NMR) experiments by 4-8 orders of magnitude. Hyperpolarized gases, unlike liquids and solids, can often be readily separated and purified from the compounds used to mediate the hyperpolarization processes. These pure hyperpolarized gases enabled many novel MRI applications including the visualization of void spaces, imaging of lung function, and remote detection. Additionally, hyperpolarized gases can be dissolved in liquids and can be used as sensitive molecular probes and reporters. This Minireview covers the fundamentals of the preparation of hyperpolarized gases and focuses on selected applications of interest to biomedicine and materials science.

Keywords: MRI; NMR; Xe-129; gas; hyperpolarization; propane.


Figures

Figure 1
Figure 1
Schematic representations of SEOP.[2b, 4] (a) SEOP cell containing a noble gas (here, Xe), buffer gases (e.g. N2), and a small quantity of vaporized alkali metal (here, Rb); the cell is irradiated by circularly polarized laser light that can be absorbed by the alkali metal atoms. (b) The first step of SEOP: in order to conserve angular momentum, photon absorption results in selective population depletion from one Rb ground electronic state (neglecting Rb nuclear spin for simplicity). Although gas-phase collisions work to equalize the excited-state populations (and hence, the ground-state repopulation rates), continuous depletion of one state by the laser leaves the AM vapor electronically spin-polarized. (c) The second step of SEOP: Gas-phase collisions occasionally allow spin order to be transferred from the AM atom electrons to the noble gas nuclei via Fermi contact hyperfine interactions, thereby hyperpolarizing the noble gas over time. Reproduced with permission from Ref. [36] © John Wiley & Sons, Ltd., 2015.
Figure 2
Figure 2
129Xe-MRI of a healthy volunteer. a) Coronal plane 25 mm slice 129Xe-MR ventilation image of a healthy adult male, with 129Xe appearing bright. The upper airways are delineated. b) Coronal plane 25 mm slice fused 129Xe-MR ventilation and proton co-registration image, with 129Xe appearing green. The two black regions pointed out in the fused image (yellow arrows) are due to a diaphragmatic eventration and pulmonary vasculature, clearly defined on the fused image (blue arrows). J. Thorpe, B. Haywood, M. Barlow, S. Safavi & I. Hall - University of Nottingham (Unpublished work).
Figure 3
Figure 3
ADC map of a healthy volunteer and a patient with COPD. a) Healthy volunteer with a low mean ADC of 0.037±0.021 cm2/s, indicating normal alveolar microstructure. b) Patient with COPD with high ADC values (0.068±0.028 cm2/s) in the parenchyma, indicating alveolar destruction. Reproduced with permission from Ref. [96] © John Wiley & Sons, Ltd., 2011.
Figure 4
Figure 4
129Xe NMR spectra recorded from two healthy volunteers. Two dotted lines have been placed to represent the expected dissolved state peaks, the left most line representing the expected ~196 ppm lung parenchyma peak, and the right most line representing the expected 216 ppm red blood cell peak. S. Hardy, B. Haywood, M. Barlow, S. Safavi & I. Hall - University of Nottingham (Unpublished work).
Figure 5
Figure 5
129Xe brown adipose tissue (BAT) temperature map overlaid on a sagittal 1H image. These temperature maps were obtained by using the lipid-dissolved xenon signal as a temperature probe. The temperature coefficient of the lipid-dissolved xenon chemical shift was measured to be −0.2 ppm/°C.
Figure 6
Figure 6
Caged Xe biosensor concept, and Hyper-CEST detection. a) Different Xe hosts confer different chemical shifts to the bound atoms that enable readout at distinct resonance frequencies. b) Xe inside a molecular host changes its resonance frequency upon binding to a target structure. c) Selective Hyper-CEST saturation at one of these frequencies causes a cloud of depolarized Xe around the respective host. The reduced signal from free Xe represents an amplified information from the small amount of cages. d) Sweeping the saturation pulse over a certain frequency range and subsequent observation of the magnetization from free Xe yields a Hyper-CEST spectrum for comparing the performance of different hosts.
Figure 7
Figure 7
Gas vesicles as genetically encodable HyperCEST reporters detectable at pM concentrations. (a) Diagram of a gas vesicle: a hollow gas nano-compartment (solid shading) surrounded by a gas-permeable protein shell (ribbed shading). (b) Transmission electron micrographs of individual GVs purified from Halobacterium NRC-1 in their intact (left) and collapsed (right) state. (c) Diagram of 129Xe CEST between bulk aqueous solvent (left) and GVs (hexagons) either in isolation or inside a cell (gray). (d) Frequency-dependent saturation spectra for intact (red) and collapsed (black) GVs. (e) Saturation contrast image of a three-compartment phantom containing 400 pM GVs, 100 pM GVs and buffer. Reprinted by permission from Macmillan Publishers Ltd: Nature Chemistry,[171] copyright 2014.
Figure 8
Figure 8
Parahydrogen conversion. Passage of H2 gas over a paramagnetic catalyst, given sufficient contact time, converts the ortho-H2 fraction to para-H2 fraction as a function of temperature.
Figure 9
Figure 9
a) Molecular diagram of parahydrogen (para-H2) addition to the substrate performed with a homogeneous or heterogeneous catalyst. b) PASADENA effect: nuclear spin energy level diagram of para-H2 at high magnetic field (left), An AX spin system is formed upon pairwise addition of para-H2 to the unsaturated substrate at high magnetic field and corresponding 1H NMR spectrum (right). c) ALTADENA effect: nuclear spin energy level diagram of para-H2 at low magnetic field (left), An AB spin system is formed upon pairwise addition of para-H2 to the unsaturated substrate at low magnetic field, An AX spin system is obtained after adiabatic transfer of the reaction product from low to high magnetic field. The corresponding 1H NMR spectrum is shown at right.
Figure 10
Figure 10
ALTADENA 1H NMR spectra of a gaseous stream during bubbling of parahydrogen (a) and normal H2 (b) through the solution of [Rh(I)(NBD)L]+BF4 in D2O at 70–80 °C. The broad signal labeled “H2” belongs to ortho-H2 gas: the resonances labeled with open circles correspond to norbornane. c) Diagram of the experimental setup with the NMR detection performed in the high field. Reprinted with permission from Kovtunov, K. V.; et al. Anal. Chem. 2014, 86, 6192.[214]
Figure 11
Figure 11
Heterogeneous pairwise hydrogenation of propene to propane with para-H2 over Rh/TiO2 catalyst with preservation of spin order of parahydrogen in the final HP product.
Figure 12
Figure 12
(a) Schematic representation of the experimental setup for using PHIP to produce HP propane via heterogeneous hydrogenation of propene with parahydrogen. (b) 1H MRI FLASH image of HP propane flowing into a 10 mm NMR tube via 1/16 in. OD Teflon capillary. Note that the NMR tube is shown schematically and its length does not match the actual scale of the 2D MR image. Reprinted with permission from Kovtunov, K. V.; et al. Tomography 2016, 2, 49.[221]
Figure 13
Figure 13
High-resolution 3D gradient echo (GRE) MRI at 4.7 T. a) 3D MRI of flowing HP propane gas (~20 mM concentration) with 0.5×0.5×0.5 mm3 spatial and 17.7 s temporal resolution and 32×32×32 mm3 field of view. b) The corresponding image of (stationary) thermally polarized tap water (55 M). Reprinted with permission from Kovtunov, K. V.; et al. J. Phys. Chem. C 2014, 118, 28234.[222]
Figure 14
Figure 14
RD MRI of flow of HP 129Xe through a rock sample. (a) The rock sample is inside a large RF coil used to encode spatial information into spin coherences, and the signal is read out by a smaller and more sensitive coil around the outlet tubing, with optimized filling factor. (b) 3D TOF images. The silhouettes represent the rock sample. TOF, i.e., the time instant the signal is detected after the encoding, is shown above the images. Reprinted with permission from Granwehr, J.; Harel, E.; Han, S.; Garcia, S.; Pines, A.; Sen, P. N.; Song, Y. Q. Phys. Rev. Lett. 95, 075503 (2005). Copyright (2005) by the American Physical Society.
Figure 15
Figure 15
(a) RD MRI setup of a simplified microfluidic system consisting of a capillary leading through the encoding and detection coils. TOF RD MRI visualization of (a) HP propane and (b) water flow in the capillary (outlined in white), revealing much more extensive dispersion of liquid than that of gas molecules. TOF (ms) is shown at the bottom of the panels. The panels on the left are sums of the other panels.[231a]
Figure 16
Figure 16
RD MRI of HP propane in microfluidic chips with (a) a widened channel in the middle part and (b) ladder-like channels (outlined in white). These images are the sum of the panels measured at different TOF instances, and they expose, e.g., manufacturing imperfections. Flow velocities extracted from TOF data are shown in (b). Reproduced with permission from Ref. [231a] © John Wiley & Sons, Ltd., 2010.
Figure 17
Figure 17
RD MRI visualization of reaction progress inside a catalyst layer packed in a thin capillary. (a) Sample setup. 2D TOF images of HP propane resulting from the hydrogenation reaction in the reactors of (a) 800 and (b) 150 μm in diameter. The reactors are outlined by a white dashed line in the figures. TOF (ms) is shown at the bottom of the panels. The panels on the left are the sums of all other panels in each series.[231c]

References

    1. Nikolaou P, Coffey A, Barlow M, Rosen M, Goodson B, Chekmenev E. Anal Chem. 2014;86:8206–8212. - PMC - PubMed
    2. Witte C, Schröder L. NMR Biomed. 2013;26:788–802. - PubMed
    3. Ardenkjaer-Larsen J, Fridlund B, Gram A, Hansson G, Hansson L, Lerche M, Servin R, Thaning M, Golman K. Proc Natl Acad Sci USA. 2003;100:10158–10163. - PMC - PubMed
    1. Goodson BM, Whiting N, Coffey AM, Nikolaou P, Shi F, Gust B, Gemeinhardt ME, Shchepin RV, Skinner JG, Birchall JR, Barlow MJ, Chekmenev EY. In: Hyperpolarization Methods for MRS. Griffiths J, Bottomley P, Wasylishen RE, editors. Vol. 4. John Wiley & Sons, Ltd; West Sussex, UK: 2015. pp. 797–810.
    2. Nikolaou P, Goodson B, Chekmenev E. Chem Eur J. 2015;21:3156–3166. - PMC - PubMed
    3. Goodson B. J Magn Reson. 2002;155:157–216. - PubMed
    1. Hirsch ML, Kalechofsky N, Belzer A, Rosay M, Kempf JG. J Am Chem Soc. 2015;137:8428–8434. - PubMed
    1. Walker T, Happer W. Rev Mod Phys. 1997;69:629.
    1. Ward HR. Acc Chem Res. 1972;5:18–24.