

Metastasis in Adult Brain Tumors
- PMID: 27712796
- PMCID: PMC5104196
- DOI: 10.1016/j.nic.2016.06.008
Metastasis in Adult Brain Tumors
Abstract
Metastatic cancer to the central nervous system is primarily deposited by hematogenous spread in various anatomically distinct regions: calvarial, pachymeningeal, leptomeningeal, and brain parenchyma. A patient's overall clinical status and the information needed to make treatment decisions are the primary considerations in initial imaging modality selection. Contrast-enhanced MR imaging is the preferred imaging modality. Morphologic MR imaging is limited to delineating anatomic deraignment of tissues. Dynamic susceptibility contrast-enhanced perfusion and diffusion-weighted physiology-based MR imaging sequences have been developed that complement morphologic MR imaging by providing additional diagnostic information.
Keywords: Brain; DSC perfusion; MR Imaging; Metastasis.
Copyright © 2016 Elsevier Inc. All rights reserved.
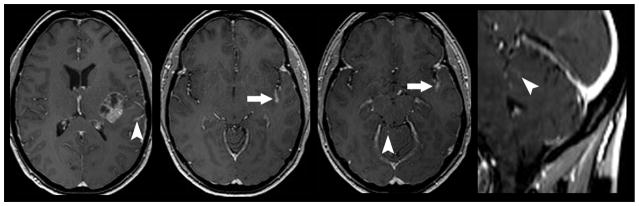
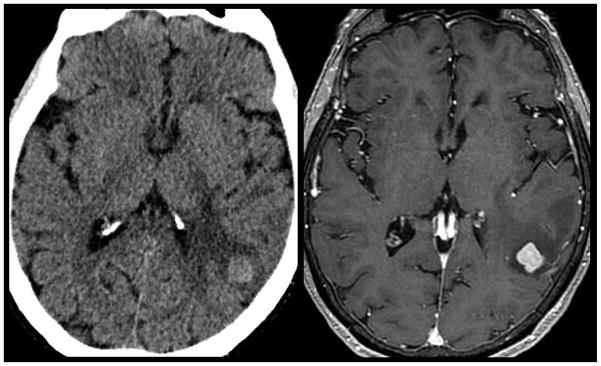
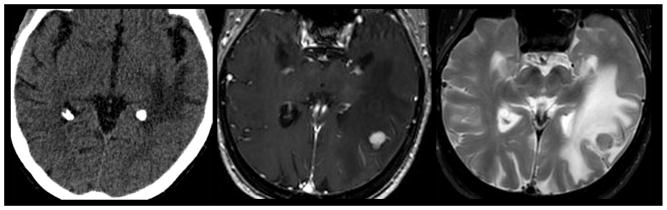
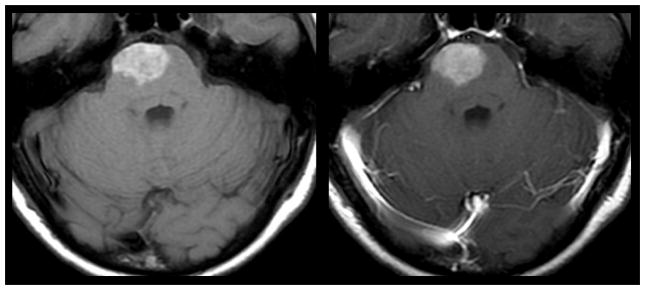
Figures
References
-
- Barnholtz-Sloan JS, Sloan AE, Davis FG, Vigneau FD, Lai P, Sawaya RE. Incidence proportions of brain metastases in patients diagnosed (1973 to 2001) in the metropolitan Detroit cancer surveillance system. J Clin Oncol. 2004;22:2865–2872. - PubMed
-
- Nussbaum ES, Djalilian HR, Cho KH, Hall WA. Brain metastases. Histology, multiplicity, surgery, and survival. Cancer. 1996;78(8):1781–1788. - PubMed
-
- Das A, Hochberg FH. Clinical presentation of intracranial metastases. Neurosurg Clin N Am. 1996;7(3):377–391. - PubMed
-
- Beasley KD, Toms SA. The molecular pathobiology of metastasis to the brain. A review. Neurosurg Clin N Am. 2011;22:7–14. - PubMed
Publication types
MeSH terms
Substances
Grants and funding
LinkOut - more resources
Full Text Sources
Other Literature Sources
Medical
