. 2016 Oct 7:7:12963.
doi: 10.1038/ncomms12963.

Bimodal antagonism of PKA signalling by ARHGAP36

Affiliations

Bimodal antagonism of PKA signalling by ARHGAP36

Rebecca L Eccles et al. Nat Commun. .

Abstract

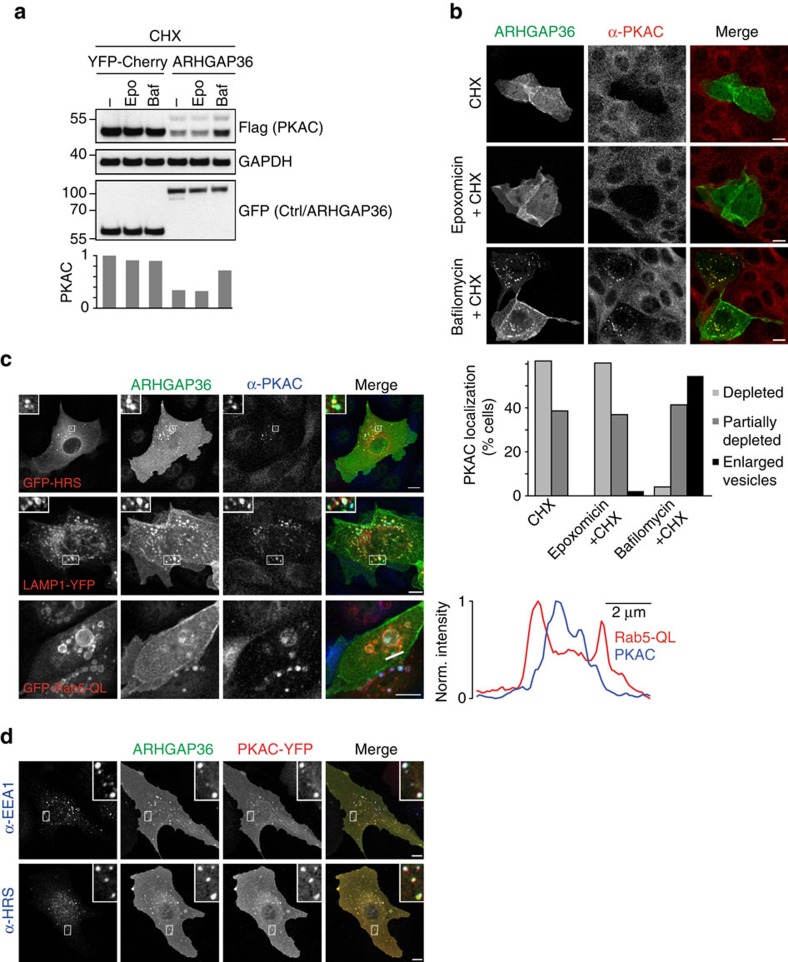
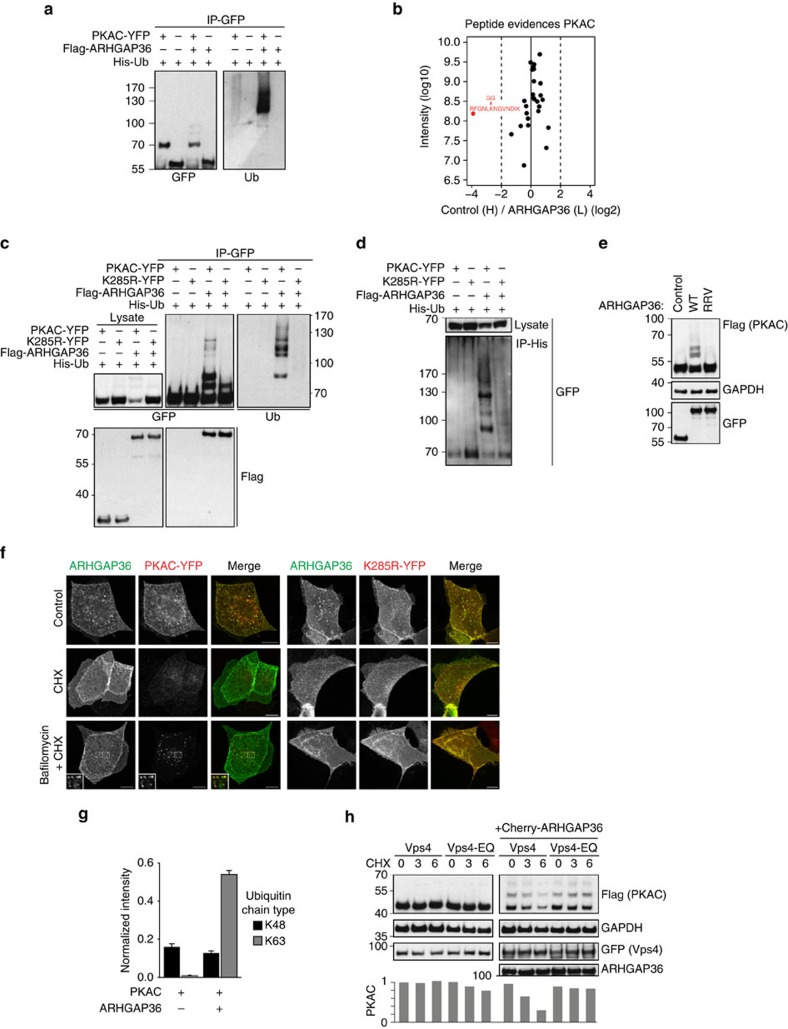
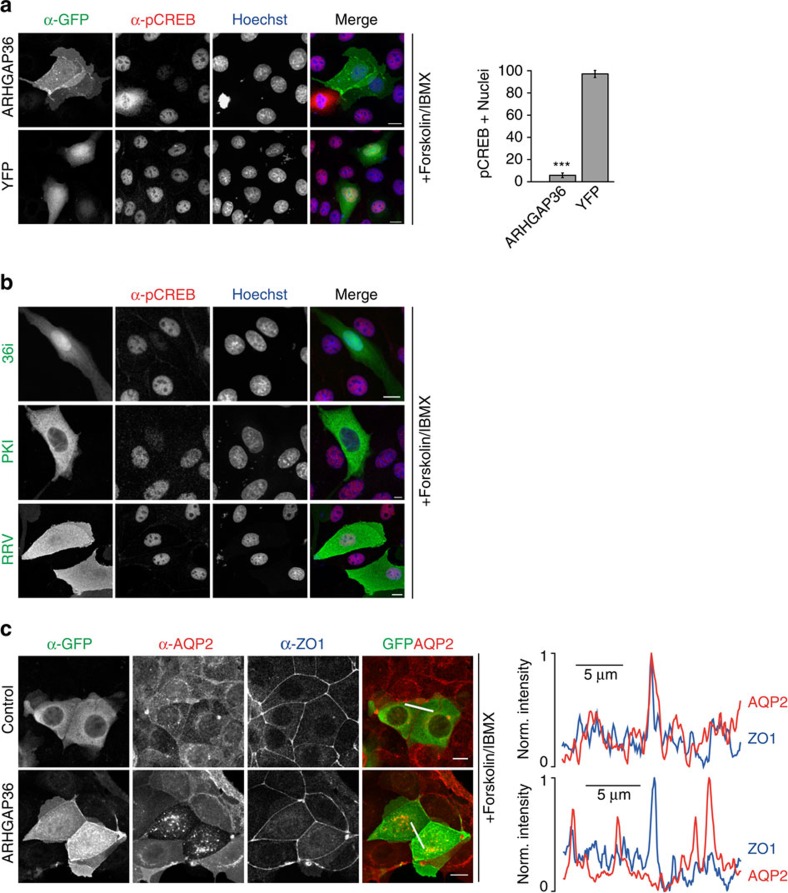
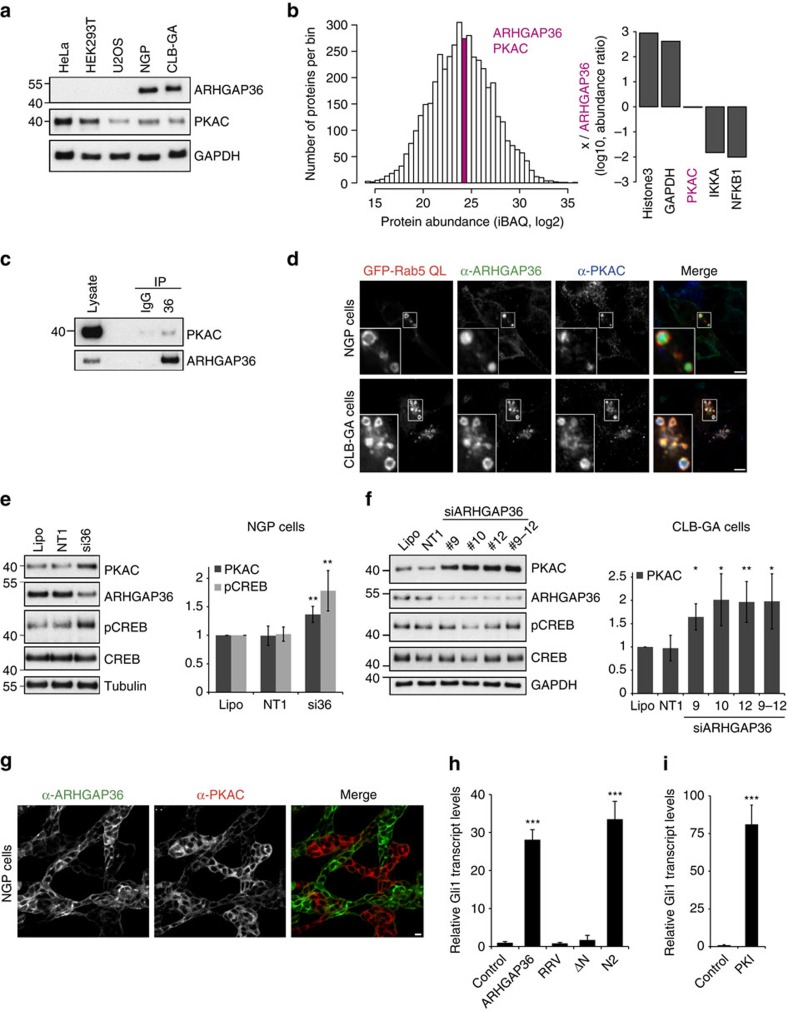
Protein kinase A is a key mediator of cAMP signalling downstream of G-protein-coupled receptors, a signalling pathway conserved in all eukaryotes. cAMP binding to the regulatory subunits (PKAR) relieves their inhibition of the catalytic subunits (PKAC). Here we report that ARHGAP36 combines two distinct inhibitory mechanisms to antagonise PKA signalling. First, it blocks PKAC activity via a pseudosubstrate motif, akin to the mechanism employed by the protein kinase inhibitor proteins. Second, it targets PKAC for rapid ubiquitin-mediated lysosomal degradation, a pathway usually reserved for transmembrane receptors. ARHGAP36 thus dampens the sensitivity of cells to cAMP. We show that PKA inhibition by ARHGAP36 promotes derepression of the Hedgehog signalling pathway, thereby providing a simple rationale for the upregulation of ARHGAP36 in medulloblastoma. Our work reveals a new layer of PKA regulation that may play an important role in development and disease.


Figures

Figure 1
Figure 1. ARHGAP36 interacts with PKAC.
(a) Schematic representation of human ARHGAP36 isoform 2 (UniProt ID: Q6ZRI8-2). (b) HEK293T cells were transfected with PKAC-YFP and Flag-ARHGAP36 or Flag-Cherry control. Lysates were immunoprecipitated using a Flag antibody and immunoblotted with GFP or Flag antibodies. Note the reduction of PKAC in presence of ARHGAP36. (c) HEK293T cells were transfected with YFP-ARHGAP36 or YFP-Cherry control. Lysates were immunoprecipitated using a GFP antibody and immunoblotted with GFP or PKAC antibodies. As in b, note the reduction of PKAC in the presence of ARHGAP36. (d) Confocal live micrographs of MDCK cells expressing CFP-ARHGAP36 and PKAC-YFP, either alone or together. Scale bars, 10μm. (e) FLIM–FRET measurements in MDCK cells expressing PKAC-YFP (donor) either alone, or together with mCherry-ARHGAP36 (acceptor) before and after acceptor photobleaching. Shown are YFP and mCherry confocal images and pseudocoloured donor fluorescence lifetime maps. Scale bars, 10μm. Right panel: corresponding histograms of the prebleach (red) and postbleach (blue) Venus-YFP lifetime values together with the donor only control sample (black).
Figure 2
Figure 2. ARHGAP36 interacts with PKAC via a pseudosubstrate domain.
(a) HEK293T cells were transfected with PKAC-YFP together with Flag-tagged wild-type ARHGAP36 (WT), 195–516 (ΔN), 1–194 (N) or Flag-Cherry control. Lysates were immunoprecipitated using a GFP antibody and immunoblotted using GFP or Flag antibodies. (b) Confocal live micrographs of MDCK cells expressing PKAC-YFP together with CFP-ΔN, CFP-N or CFP-N2 (118–194). Nuclear enrichment of ARHGAP36-N2, bottom left, may be facilitated by the arginine-rich sequence. Scale bars, 10 μm. (c) Immobilized peptide ‘spots', overlapping 25-mer peptides each shifted along by 5 aa in the entire ARHGAP36 sequence, were probed for interaction with GST-PKAC and immunoblotted using a GST antibody. The sequence of the spot with strongest interaction is shown. (d) Alanine and aspartate scans of the spot indicated in c were treated the same as in c. Asterisk indicates wild-type sequence spot. (e) Alignment of human ARHGAP36 with the human isoforms of PRKAR and PKI revealing its pseudosubstrate motif RRxAY. (f) Confocal live micrographs of MDCK cells coexpressing CFP-ARHGAP36-RRV and PKAC-YFP. Scale bars, 10 μm. (g) Average Venus-YFP fluorescence lifetimes of MDCK cells expressing PKAC-YFP alone or together with mCherry-ARHGAP36, -ΔN or -RRV, or PKAC-EEE-YFP (E127A/E170A/E230A) together with mCherry-ARHGAP36 (n≥4 each). Error bars denote mean±s.d. ***P<0.001, *P<0.05; NS, not significant; Student's T-test versus PKAC-YFP donor alone. (h) ITC measurements were performed in the presence of 2 mM ATP analogue adenylyl-imidodiphosphate (AMPPNP). A concentration of 30 μM His-PKAC solution (cell) was titrated with 507 μM PKI or 351 μM 36i (syringe) until saturation was reached using 8 or 6 μl injections, respectively (the first injection was always carried out with half the volume and omitted from data analysis). 36i and PKI bound to PKAC●AMPPNP with almost identical affinities. The measured values are in a similar range as previously reported for the PKAC–PKI interaction in the presence of other ATP analogues or ADP.
Figure 3
Figure 3. ARHGAP36 inhibits PKAC.
(a) Recombinant PKAC (25 ng) was incubated with 10 μM scrambled, 36i or PKI peptide, and its activity determined by its ability to phosphorylate the substrate peptide PepTag A1. Phosphorylated and non-phosphorylated peptide were separated by agarose electrophoresis, and densitometrically analysed. Representative gel shown. Recombinant PKAC activity is shown as the ratio of phosphorylated to non-phosphorylated peptide (mean of eight repeats±s.e.m., ***P<0.001, Student's T-test versus all three controls). (b) AKAR4-NES FRET sensor was expressed together with Cherry control, Cherry-ARHGAP36 (WT), the indicated mutants or 36i-Cherry or PKI-Cherry in HEK293T cells. Cells were serum starved for 5 h, treated with 10 μM Forskolin and 100 μM IBMX for 30 min, and subsequently imaged. Mean FRET emission ratio (acceptor intensity/donor intensity) of three independent experiments normalized to control±s.d. ***P<0.001, NS, not significant, versus control and RRV. (c) Representative images of HEK293T cells expressing AKAR4-NES FRET sensor together with Cherry control, Cherry-ARHGAP36 (WT) or Cherry-ARHGAP36-RRV. Cells were treated as in b. Shown are YFP intensity images and pseudocoloured FRET ratio images (acceptor intensity/donor intensity) reflecting the relative PKA activity levels. Scale bars, 100 μm. The histograms show the pixel distribution within the FRET emission ratio images.
Figure 4
Figure 4. ARHGAP36 downregulates PKAC levels.
(a) MDCK cells transfected with YFP-ARHGAP36, or a YFP control, were fixed after 8 or 24 h and subjected to immunofluorescence using antibodies against GFP and PKAC. Images were collected by confocal microscopy. Scale bars, 10 μm. (b) HEK293T cells were transfected with YFP-ARHGAP36 or YFP-Cherry control for 24 h. Lysates were immunoblotted with the indicated antibodies. (c) HEK293T cells were transfected with YFP-ARHGAP36 or YFP control. Lysates were immunoblotted with antibodies against RIα, RIβ RIIα, RIIβ, GAPDH and GFP. (d) MDCK cells transfected with CFP-PKI were fixed after 24 h and subjected to immunofluorescence as in a. Scale bar, 10 μm. (e) MDCK cells transfected with YFP-ΔN (195–516), YFP-N (1–194), YFP-N2 (118–195), YFP-RRV or Cherry-36i were fixed after 24 h and subjected to immunofluorescence as in a. 36i signal was not amplified using antibodies. Scale bars, 10 μm.
Figure 5
Figure 5. ARHGAP36 targets PKAC for lysosomal degradation.
(a) HEK293T cells were transfected with PKAC-Flag and YFP-ARHGAP36 or YFP-Cherry control as indicated. Before collecting, cells were pretreated for 30 min with epoxomicin (50 nM) or bafilomycin (100 nM), before cycloheximide (CHX; 50 μg ml−1) addition for a further 6 h. Lysates were immunoblotted with the indicated antibodies. Flag-PKAC levels were densitometrically evaluated and normalized to the first lane shown. (b) MDCK cells were transfected with YFP-ARHGAP36 or YFP control for 8 h and, where indicated, were pretreated for 30 min with epoxomycin (100 nM) or bafilomycin (100 nM), before CHX (1 μg ml−1) addition for a further 8 h. Cells were then fixed after a total of 16 h transfection and subjected to immunofluorescence using antibodies against GFP and PKAC. Images were collected by confocal microscopy. Scale bars, 10 μm. Graph shows the percentage of YFP-ARHGAP36-transfected cells with the respective phenotype, 100 cells counted per condition. (c) Confocal micrographs of MDCK cells transfected with Flag-ARHGAP36 together with GFP-HRS, LAMP1-YFP or GFP-Rab5-QL. Cells were fixed and subjected to immunofluorescence using antibodies against GFP, Flag and PKAC. Scale bars, 10 μm. For Rab5-QL, line scan fluorescence intensity profiles are shown on the right. In red: Rab5-QL, in blue: PKAC. (d) Confocal micrographs of U2OS cells transfected with PKAC-YFP and Flag-ARHGAP36. Cells were fixed and subjected to immunofluorescence using antibodies against GFP, Flag, EEA1 and HRS. Scale bars, 10 μm.
Figure 6
Figure 6. ARHGAP36 induces PKAC ubiquitylation and engagement with the ESCRT pathway.
(a) HEK293T cells were transfected with PKAC-YFP or YFP-Cherry control, Flag-ARHGAP36 and His-Ubiquitin as indicated. Lysates were subjected to GFP IP. (b) SILAC-labelled HEK293T cells were transfected with PKAC-Flag in the presence or absence of YFP-ARHGAP36. Lysates were subjected to Flag IP. Normalized heavy/light ratio plot of the peptide evidences matching PRKAC. Only one peptide, highlighted in red, was upregulated in the presence of ARHGAP36 and was the only ubiquitylated PRKAC peptide identified. (c) The same as in a except where indicated PKAC-K285R-YFP was transfected and a Flag-Cherry control for Flag-ARHGAP36 was used. (d) The same as in c except lysates were subjected to His IP and immunoblotted with anti-GFP. (e) HEK293T cells were transfected with PKAC-Flag and CFP-ARHGAP36, the RRV mutant or CFP-Cherry control. Lysates were immunoblotted with the indicated antibodies. (f) Confocal micrographs of MDCK cells transfected with PKAC-YFP or PKAC-K285R-YFP and Flag-ARHGAP36. Twelve hours after transfection, cells were pretreated for 30 min with bafilomycin (100 nM), before cycloheximide (CHX; 1 μg ml−1) addition for a further 5 h. Cells were fixed and subjected to immunofluorescence using anti-GFP and anti-Flag. Scale bars, 10 μm. (g) HEK293T cells were transfected with PKAC-YFP in the presence or absence of Flag-ARHGAP36 and subjected to GFP IP followed by SRM-MS-based relative quantification of polyubiquitin linkage-type peptides. Data were normalized using the signal intensity of PKAC derived from a shotgun MS analysis of the same samples. Samples were measured in duplicate and the top two transitions used for quantification. The error bars represent the s.d. of the four calculated area ratios. (h) HEK293T cells were transfected with GFP-Vps4-WT or GFP-Vps4-EQ, PKAC-Flag and Cherry-ARHGAP36 or Cherry control as indicated. Cells were treated with CHX (50 μg ml−1) and collected at the indicated time points. Flag-PKAC levels were densitometrically evaluated and normalized to the first lane shown.
Figure 7
Figure 7. ARHGAP36 suppresses PKA signalling.
(a) MDCK cells expressing YFP-ARHGAP36 or YFP control in low-serum conditions were treated with 10 μM Forskolin and 100 μM IBMX for 20 min, fixed and subjected to immunofluorescence using antibodies against GFP and phospho-CREB. Images were collected by confocal microscopy. Scale bars, 10 μm. Quantitative analysis of nuclear phospho-CREB staining in cells expressing the indicated constructs (n>100 for each of three independent experiments, shown as mean±s.e.m., ***P<0.001, Student's T-test). (b) As in a, except cells were transfected with Cherry-36i, CFP-PKI or CFP-ARHGAP36-RRV. (c) MCD4 cells stably expressing aquaporin-2 (AQP2) were transfected with YFP-ARHGAP36 or YFP control in low-serum conditions. Twelve hours post transfection, cells were treated with 10 μM Forskolin for 20 min. Fixed cells were subjected to immunofluorescence using antibodies against GFP, AQP2 and the tight junction protein ZO-1, to visualize the plasma membrane at cell–cell contact sites. Images were collected by confocal microscopy. Scale bars, 10 μm. Line scan fluorescence intensity profiles are shown on the right. In red: AQP2, in blue: ZO-1.
Figure 8
Figure 8. ARHGAP36 is expressed in neuroblastoma cells and promotes aberrant activation of the Hedgehog pathway.
(a) An amount of 10 μg lysate of the indicated cell lines was immunoblotted with the indicated antibodies. ARHGAP36 is only present in NGP and CLB-GA neuroblastoma cells. The predominant isoform seems to be isoform 3, expected size 46 kDa. (b) Histogram displays the distribution of the relative abundance of all measured proteins (n=4448). ARHGAP36 and PKAC are within the same bin (pink). Bar plot shows the log 10 abundance of the indicated proteins relative to ARHGAP36, GAPDH (437-fold) and PKAC (0.95-fold). PKAC is the summed total of PRKACA and PRKACB. (c) NGP cell lysates were immunoprecipitated with an ARHGAP36 antibody or IgG rabbit control, and immunoblotted for ARHGAP36 or PKAC. 75% less lysate and eluate was run for ARHGAP36. (d) Confocal micrographs of NGP or CLB-GA cells transfected with GFP-Rab5-QL. Fixed cells were subjected to immunofluorescence using GFP, ARHGAP36 and PKAC antibodies. Scale bar, 5 μm. (e) Representative immunoblot of NGP cells treated with SMARTpool short interfering RNA (siRNA) against ARHGAP36 (si36) for 24 h. Cells were stimulated with 10 μM Forskolin and 100 μM IBMX for 30 min before collecting. Lysates were immunoblotted with the indicated antibodies. Lipo: reagent only control. NT1: non-targeting oligo control. Bands were densitometrically evaluated, normalized first to tubulin then to Lipo. Mean of five independent experiments±s.d. **P<0.01, Student's T-test compared with NT1. (f) Representative immunoblot of CLB-GA cells treated with individual or combined siRNA oligos against ARHGAP36 for 48 h. Bands were densitometrically evaluated, normalized first to tubulin then to Lipo. Mean of four independent experiments±s.d. **P<0.01 or *P<0.05, Student's T-test compared with NT1. (g) Confocal micrographs of NGP cells subjected to immunofluorescence using antibodies against ARHGAP36 and PKAC. Scale bar, 10 μm. (h) NIH3T3 cells transfected with the indicated CFP-tagged constructs for 15 h were serum starved for a further 48 h before collecting. Gli1 mRNA levels measured by quantitative PCR with reverse transcription were normalized to β-actin. Data shown as mean of three repeats±s.e.m., ***P<0.001, Student's T-test compared with control (i) As in h, except cells were transfected with CFP-PKI.

References

    1. Taylor S. S., Ilouz R., Zhang P. & Kornev A. P. Assembly of allosteric macromolecular switches: lessons from PKA. Nat. Rev. Mol. Cell Biol. 13, 646–658 (2012). - PMC - PubMed
    1. Almeida M. Q. & Stratakis C. A. How does cAMP/protein kinase A signaling lead to tumors in the adrenal cortex and other tissues? Mol. Cell. Endocrinol. 336, 162–168 (2011). - PMC - PubMed
    1. Gold M. G., Gonen T. & Scott J. D. Local cAMP signaling in disease at a glance. J. Cell Sci. 126, 4537–4543 (2013). - PMC - PubMed
    1. Goh G. et al.. Recurrent activating mutation in PRKACA in cortisol-producing adrenal tumors. Nat. Genet. 46, 613–617 (2014). - PMC - PubMed
    1. Cao Y. et al.. Activating hotspot L205R mutation in PRKACA and adrenal Cushing's syndrome. Science 344, 913–917 (2014). - PubMed

Publication types

MeSH terms

LinkOut - more resources