. 2016 Oct 7:6:34755.
doi: 10.1038/srep34755.

The phasor-FLIM fingerprints reveal shifts from OXPHOS to enhanced glycolysis in Huntington Disease

Affiliations

The phasor-FLIM fingerprints reveal shifts from OXPHOS to enhanced glycolysis in Huntington Disease

Sara Sameni et al. Sci Rep. .

Abstract

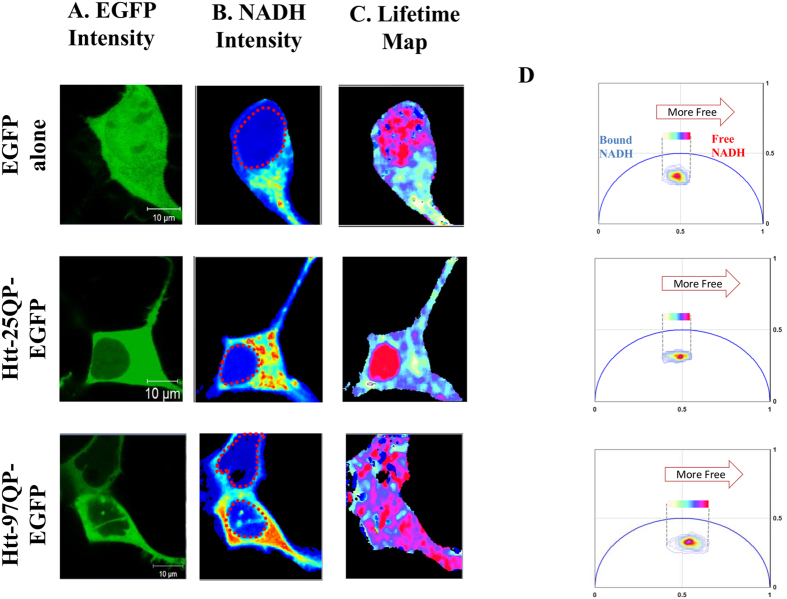
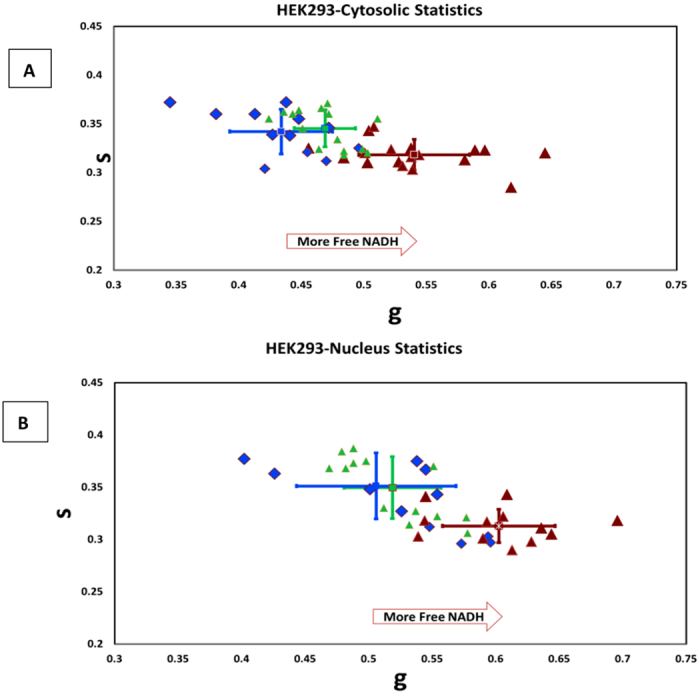
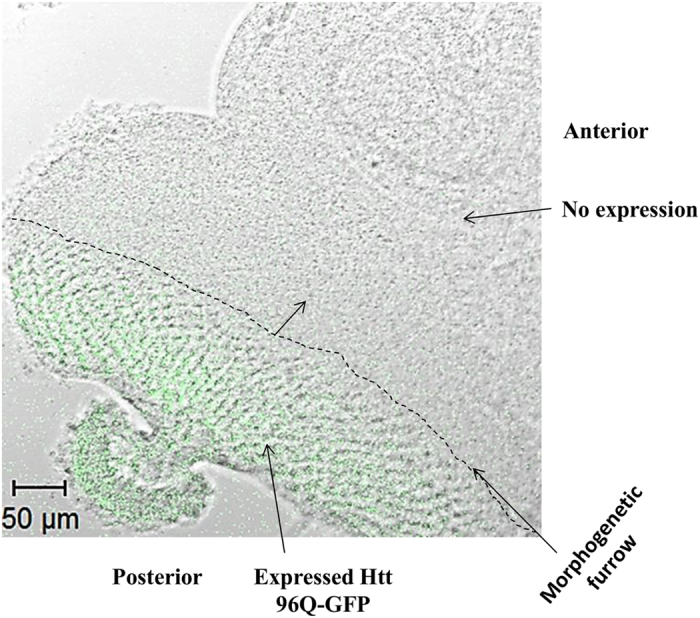
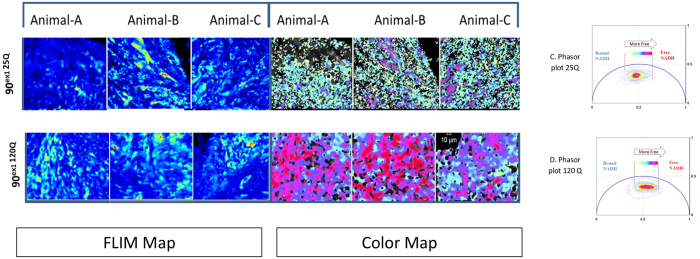
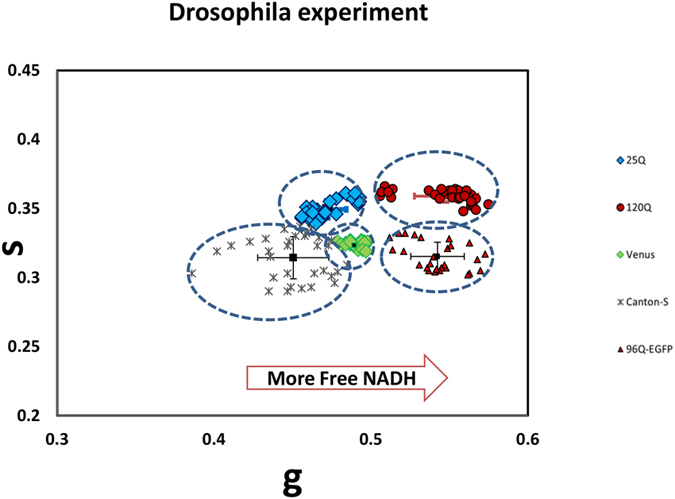
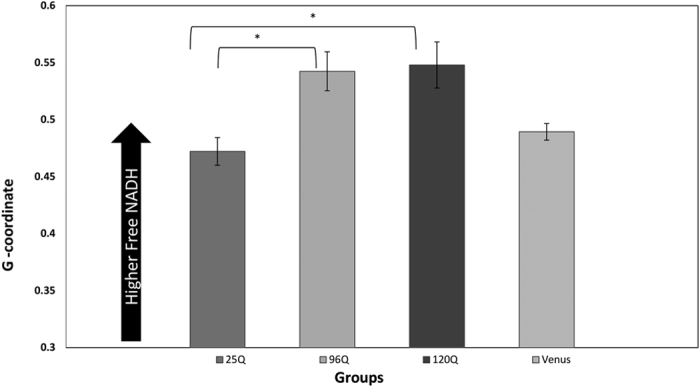
Huntington disease (HD) is an autosomal neurodegenerative disorder caused by the expansion of Polyglutamine (polyQ) in exon 1 of the Huntingtin protein. Glutamine repeats below 36 are considered normal while repeats above 40 lead to HD. Impairment in energy metabolism is a common trend in Huntington pathogenesis; however, this effect is not fully understood. Here, we used the phasor approach and Fluorescence Lifetime Imaging Microscopy (FLIM) to measure changes between free and bound fractions of NADH as a indirect measure of metabolic alteration in living cells. Using Phasor-FLIM, pixel maps of metabolic alteration in HEK293 cell lines and in transgenic Drosophila expressing expanded and unexpanded polyQ HTT exon1 in the eye disc were developed. We found a significant shift towards increased free NADH, indicating an increased glycolytic state for cells and tissues expressing the expanded polyQ compared to unexpanded control. In the nucleus, a further lifetime shift occurs towards higher free NADH suggesting a possible synergism between metabolic dysfunction and transcriptional regulation. Our results indicate that metabolic dysfunction in HD shifts to increased glycolysis leading to oxidative stress and cell death. This powerful label free method can be used to screen native HD tissue samples and for potential drug screening.


Figures

Figure 1
Figure 1. Panel A shows confocal images obtained using the 488 nm laser to excite EGFP directly.
In panel B NADH emission was obtained with 740 nm two-photon excitation. NADH is detected with a blue filter (442/46 nm) in one channel and EGFP emission with a green filter (520/35 nm). Nuclei of the cells are shown with dashed red circle. Panel C represents lifetime maps of NADH colored according to the color scale in the phasor plot in panels D. When cells express the expanded Htt 97Qp, there is a significant shift toward the shorter lifetime indicating a higher glycolytic state. Panel D also shows the phasor plot for each representative cell. The phasor histogram of the cell transfected with 97Q is shifted to the direction of free NADH. Scale bar on the image is 10 μm.
Figure 2
Figure 2
(A) Scatter plot of NADH cell phasor FLIM in the cytoplasmic pool of the Httex1p25Q (N = 12, in blue) expressing cells compared to the Httex1p97Q cells in red (N = 18). EGFP control is plotted in green triangle (N = 15). Each point represents the average lifetime plotted in the phasor coordinates. Using image segmentation the cytoplasmic region for each cell is selected. Expanded cells (97Q) shows higher free to bound NADH ratio (shifted toward right). (B) Similar plot was obtained for individual cell nuclei of the Httex1p25Q cells compared to Httex1p97Q cells. Cells transfected with 97Q are further shifted towards the right side of the plot indicating an increase of free NADH in the nucleus.
Figure 3
Figure 3. Tiled images of ELAV GAL4 X UAS Httexon1p Q96-GFP Drosophila eye disc.
Bright field image merged with FITC shown here (Scale bar on the image is 50 um).
Figure 4
Figure 4. Unexpanded ELAV-GAL4 X UASQ25 vs. expanded ELAV-GAL4 X UASQ120 expressing flies results are depicted here.
NADH emission obtained with 740 nm two-photon excitation is shown under the intensity map. Lifetime color map of NADH is depicted on the right (color map). Shorter lifetime is color coded with red here while longer lifetime on the phasor plot is associated with cyan. As it is shown here Htt 120Q cells are characterized with a distinct population shifted toward shorter lifetime (red) that has a higher ratio of free to bound NADH. Panels C&D show the phasor plot for 25Q and 120 Q respectively. The phasor histogram is shifted toward the direction of free NADH (glycolysis) in the expanded form 120Q compared to unexpanded 25Q. Scale bar is 10 um.
Figure 5
Figure 5. Scatter plot of the NADH phasor FLIM showing average g and s phasor values for each animals eye disc ROI (N) for total of 15 animals and a total of N = 149 ROI measurements.
The blue diamond refers to 25Q (N = 30), green diamond Venus control (N = 28), gray asterisk wildtype with no HTT (Canton-S, N = 32).Tissue with expanded expression 120Q (N = 32, in red circle) and 96Q-EGFP (N = 27, in red triangles) indicates shortening of the lifetime towards the glycolytic state, shifted to the right.
Figure 6
Figure 6. Summary of the data analysis for live tissue of drosophila eye disc (expanded 96Q (N = 27), 120Q (N = 32), unexpanded 25Q (N = 30), and control (Venus, N = 28) are depicted here.
Arrow bar shows the direction of Free NADH. Expanded Htt(both 96Q and 120Q) are characterized with significant increased ratio of free to bound NADH(more Glycolytic) compared to unexpanded Htt (25Q).

References

    1. Ayala-Peña S. Role of oxidative DNA damage in mitochondrial dysfunction and Huntington’s disease pathogenesis. Free Radical Biology and Medicine 62, 102–110 (2013). - PMC - PubMed
    1. Heikal A. A. Intracellular coenzymes as natural biomarkers for metabolic activities and mitochondrial anomalies. Biomarkers in medicine 4, 241–263 (2010). - PMC - PubMed
    1. Podolsky S., Leopold N. & Sax D. Increased frequency of diabetes mellitus in patients with Huntington’s chorea. The Lancet 299, 1356–1359 (1972). - PubMed
    1. Hurlbert M. S. et al.. Mice transgenic for an expanded CAG repeat in the Huntington’s disease gene develop diabetes. DIABETES 48, 649–651, doi: 10.2337/diabetes.48.3.649 (1999). - DOI - PubMed
    1. Oláh J. et al.. Increased glucose metabolism and ATP level in brain tissue of Huntington’s disease transgenic mice. FEBS Journal 275, 4740–4755, doi: 10.1111/j.1742-4658.2008.06612.x (2008). - DOI - PubMed

Publication types