. 2016 Oct 7:6:34793.
doi: 10.1038/srep34793.

Zika virus infection during the period of maximal brain growth causes microcephaly and corticospinal neuron apoptosis in wild type mice

Affiliations

Zika virus infection during the period of maximal brain growth causes microcephaly and corticospinal neuron apoptosis in wild type mice

Wen-Chin Huang et al. Sci Rep. .

Abstract

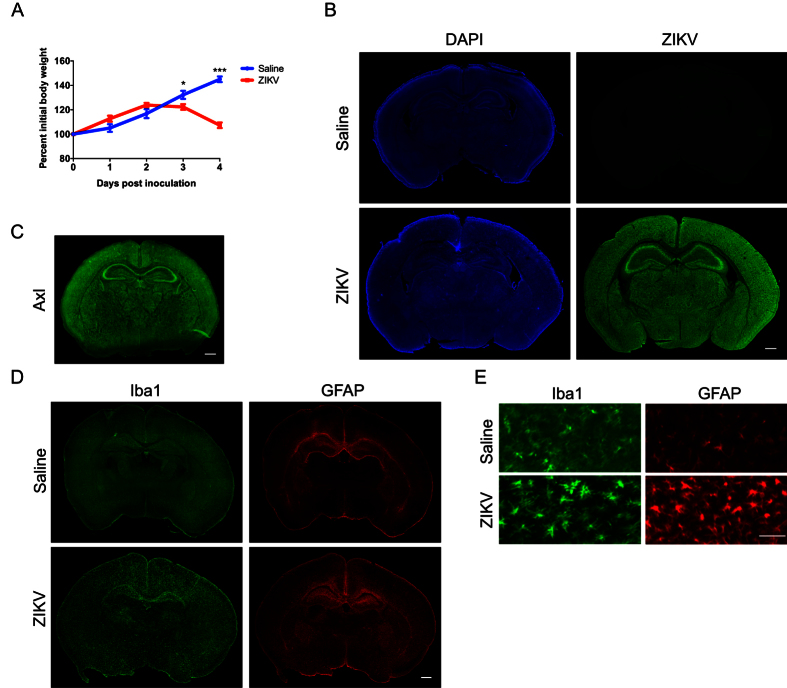
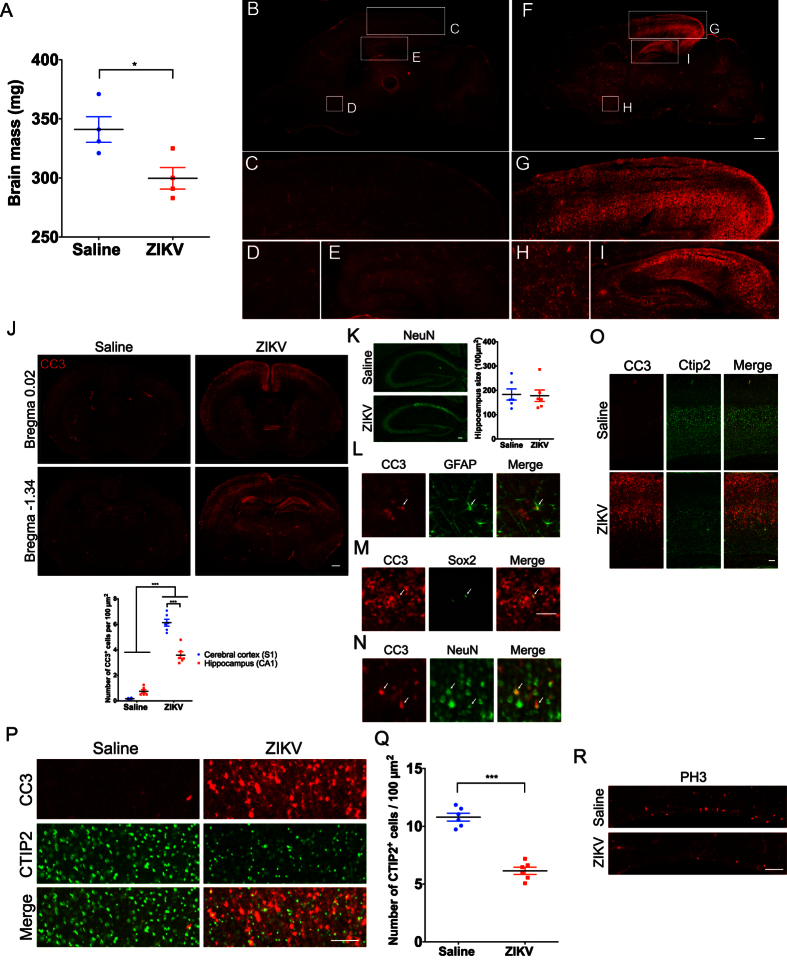
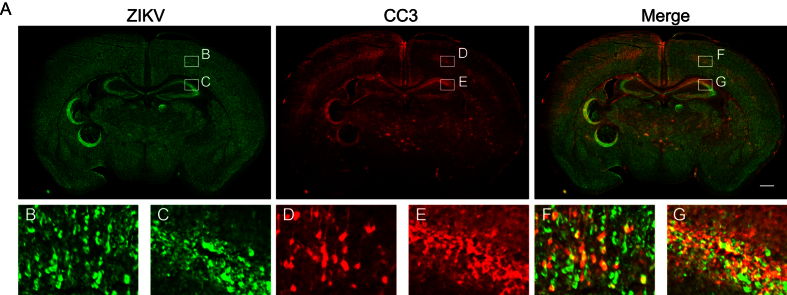
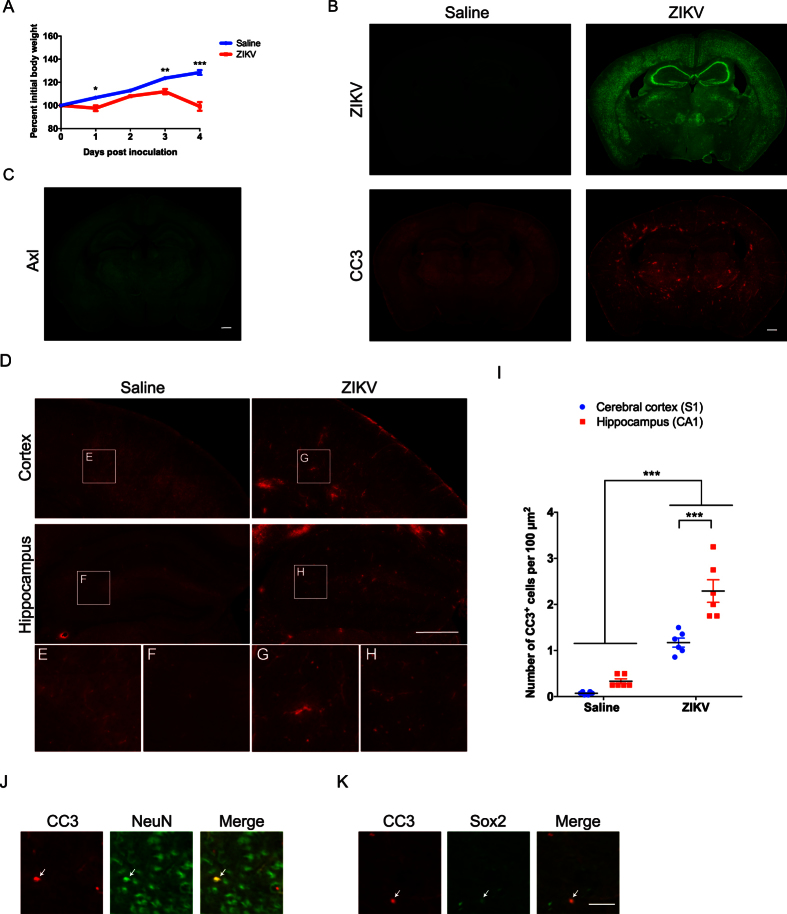
Zika virus (ZIKV) infection in pregnant women has been established as a cause of microcephaly in newborns. Here we test the hypothesis that neurodevelopmental stages when the brain is undergoing rapid growth are particularly vulnerable to the effects of ZIKV infection. We injected ZIKV intracranially into wild type C57BL/6 mice at two different time points: early postnatal development, when the brain is growing at its maximal rate, and at weaning, when the brain has largely reached adult size. Both time points showed widespread immunoreactivity for ZIKV and cleaved caspase 3 (CC3, a marker of apoptosis) throughout the brain. However, in early postnatal ZIKV injected mice, some brain areas and cell types display particularly large increases in apoptosis that we did not observe in older animals. Corticospinal pyramidal neurons, a cell type implicated in human microcephaly associated with ZIKV infection, are an example of one such cell type. Proliferating cells in the ventricular zone stem cell compartment are also depleted. These findings are consistent with the hypothesis that periods of rapid brain growth are especially susceptible to neurodevelopmental effects of ZIKV infection, and establish a valuable model to investigate mechanisms underlying neurodevelopmental effects of ZIKV infection and explore candidate therapeutics.


Conflict of interest statement

The authors declare no competing financial interests.

Figures

Figure 1
Figure 1. Intracranial injection of ZIKV results in widespread infection and activation of glia cells.
Wild type C57BL/6 mice were injected intracranially with saline or ZIKV (MR766) at one week of age (postnatal day 7, P7), and brains were collected 4 days post-inoculation (dpi) for immunohistochemistry. (A) Graph showing percentage of initial body weight of saline or ZIKV injected mice at over 4dpi. Two-Way ANOVA revealed main effects on interaction, F(4,56) = 44.88, p < 0.001, time points, F(4,56) = 70.50, p < 0.001, treatments, F(1,14) = 7.42, p = 0.017. Sidak’s post hoc tests were used. *p < 0.05, and ***p < 0.001. N = 8 animals per group. (B) Images showing anti-ZIKV (green) and DAPI (blue) staining in saline and ZIKV injected wild type mouse brains. Scale bar: 500 μm. (C) Images showing anti-Axl (green) staining in a wild-type mouse brain at postnatal day 8. Scale bar: 500 μm. (D) Images showing anti-Iba1 (green) and anti-GFAP (red) staining in saline and ZIKV injected wild type mouse brains. Scale bar: 500 μm. (E) Higher magnification of anti-Iba1 (green) and anti-GFAP (red) staining in saline and ZIKV infected wild type mouse brains. Scale bar: 50 μm. Iba1-postive microglia exhibited morphology consistent with activation in ZIKV infected mice. Images are representative of 5-6 sections per animals from 6 animals per group (saline and ZIKV injected).
Figure 2
Figure 2. ZIKV infection results in decreased brain mass, non-uniform apoptosis, decreased CTIP2+ corticospinal neurons and depletion of proliferating cells in the ventricular zone.
Brains of mice injected intracranially with saline or ZIKV at P7 and collected 4dpi for immunohistochemistry. (A) Graph showing reduced brain mass in animals injected with ZIKV at P7 as compared to saline injected controls. Independent sample t-tests were used. *p < 0.05. N = 4 animals per group. (B,F) Sagittal images of saline (B) and ZIKV (F) injected wild type mouse brains immunostained with anti-cleaved caspase 3 (CC3). Scale bar: 500 μm. Lettered boxes (C-E and G-I) in these images are magnified in corresponding panels below: occipital cortex (C,G), striatum (D,H), and hippocampus (E,I). ZIKV infected mouse brain showed widespread apoptosis, with occipital cortex and hippocampus showing particularly high levels of CC3+ cells. (J) Coronal images of saline and ZIKV injected wild type mouse brains stained with anti-CC3. Scale bar: 500 μm. CC3+ cells were enriched in upper layer II and layer V of the cerebral cortex, and CA1 regions of the hippocampus. Quantification of CC3+ cells in the primary somatosensory cortex (S1) and CA1 regions of the hippocampus. Two-way ANOVA and Tukey’s post hoc tests were used. F(1,20) = 59.58, p < 0.001 (interaction), F(1,20) = 470.4, p < 0.001 (treatment), and F(1,20) = 23.45, p < 0.001 (brain regions). ***p < 0.001. N = 6 animals per group. (K) Images showing NeuN staining (green) in the hippocampus of saline and ZIKV infected mouse brains. The size of the hippocampus is similar between saline and ZIKV injected mice. Independent sample t-tests were used. N = 6 animals per group. Scale bar: 100 μm. (L–N) Double immunostaining of anti-CC3 (red) with anti-GFAP (astrocyte marker, green) (L), anti-Sox2 (neural progenitor cell marker, green) (M), and anti-NeuN (neuronal marker, green) (N) in ZIKV infected mouse brains. Arrows indicate double labeled cells. Scale bar: 50 μm. (O) Images showing anti-CC3 (red) and anti-CTIP2 (green) staining in the motor cortex of saline and ZIKV injected wild type mice. Scale bar: 100 μm. (P) Images showing anti-CC3 (red) and anti-CTIP2 (green) staining in layer V of the motor cortex in saline and ZIKV injected wild type mice. Scale bar: 100 μm. Some, but not all, CC3+ cells were co-labeled with anti-CTIP2, a marker for subcortical-projecting neurons in the layer V cortex. ZIKV infected mice displayed reduced density of CTIP2+ neurons. Images are representative of 5-6 sections per animals from 6 animals per group (saline and ZIKV). (Q) Quantification of CTIP2+ cells in saline or ZIKV injected mouse brains. Independent sample t-tests were used. ***p < 0.001. N = 6 animals per group. (R) Images showing anti-phospho-histone H3 (PH3) staining in the ventricular zone of saline and ZIKV injected wild type mice. ZIKV infected mice displayed a reduced number of PH3+ cells. Scale bar: 100 μm.
Figure 3
Figure 3. Partial overlap between cleaved caspase 3 and ZIKV immunolabeled brain cells.
Brains of mice injected intracranially with saline or ZIKV at P7 and collected 4dpi for immunohistochemistry. Anti-CC3 staining is shown in red, and anti-ZIKV is shown in green. (A) Coronal image of a ZIKV infected mouse brain. Scale bar: 500 μm. Lettered boxes (B–G) in these images are magnified in corresponding panels below: cortex (B,D,F), and hippocampus (C,E,G). Some, but not all, CC3+ cells were positive for ZIKV. Images are representative of 5-6 sections per animals from 6 animals.
Figure 4
Figure 4. ZIKV infection in three-week-old mice results in a relatively uniform pattern of apoptosis.
Wild type C57BL/6 mice were injected intracranially with saline or ZIKV at three weeks of age (P21), and brains were collected 4dpi for immunohistochemistry. (A) Graph showing percent initial body weight of saline or ZIKV infected mice over 4dpi. Two-Way ANOVA revealed main effects on interaction, F(4, 16) = 38.84, p < 0.001, time points, F(4, 16) = 71.56, p < 0.001, treatments, F(1, 4) = 28.02, p < 0.01. Sidak’s post hoc tests were used. *p < 0.05, **p < 0.01, and ***p < 0.001. N = 3 mice per group. (B) Coronal images of saline or ZIKV injected mouse brain. Anti-ZIKV staining is shown in green, and anti-CC3 is shown in red. Scale bar: 500 μm. (C) Images showing anti-Axl (green) immunostaining in a wild-type mouse brain at postnatal day 21. Scale bar: 500 μm. (D) Anti-CC3 staining in the cerebral cortex and hippocampus. Scale bar: 500 μm. Lettered boxes (E–H) in these images are magnified in corresponding panels below. ZIKV injected mouse brain exhibited increased CC3+ cells compared to saline injected ones, but the degree of apoptosis was less severe than that of one week old ZIKV injected mice. Images are representative of 4-5 sections per animals from 2 animals. (I) Quantification of CC3+ cells in the primary somatosensory cortex (S1) and CA1 regions of the hippocampus. Two-way ANOVA and Tukey’s post hoc tests were used. F(1, 20) = 10.12, p < 0.01 (interaction), F(1, 20) = 129.0, p < 0.001 (treatment), and F(1, 20) = 26.28, p < 0.001 (brain regions). ***p < 0.001. N = 6 brain sections from 3 animals per group. (J,K) Double immunostaining of anti-CC3 (red) with anti-NeuN (neuronal marker, green) (J), and anti-Sox2 (neural progenitor cell marker, green) (K) in ZIKV infected mouse brains. Arrows indicate double staining cells. Scale bar: 50 μm.

References

    1. Brasil P. et al.. Zika Virus Outbreak in Rio de Janeiro, Brazil: Clinical Characterization, Epidemiological and Virological Aspects. PLoS Negl Trop Dis 10, e0004636, 10.1371/journal.pntd.0004636 (2016). - DOI - PMC - PubMed
    1. Brasil P. et al.. Zika Virus Infection in Pregnant Women in Rio de Janeiro - Preliminary Report. N Engl J Med, 10.1056/NEJMoa1602412 (2016). - DOI - PMC - PubMed
    1. Calvet G. et al.. Detection and sequencing of Zika virus from amniotic fluid of fetuses with microcephaly in Brazil: a case study. Lancet Infect Dis, 10.1016/S1473-3099(16)00095-5 (2016). - DOI - PubMed
    1. Cauchemez S. et al.. Association between Zika virus and microcephaly in French Polynesia, 2013-15: a retrospective study. Lancet, 10.1016/S0140-6736(16)00651-6 (2016). - DOI - PMC - PubMed
    1. Mlakar J. et al.. Zika Virus Associated with Microcephaly. N Engl J Med 374, 951–958, 10.1056/NEJMoa1600651 (2016). - DOI - PubMed

Publication types