. 2016 Oct 7:6:35100.
doi: 10.1038/srep35100.

Translation Elongation Factor eEF1A2 is a Novel Anticancer Target for the Marine Natural Product Plitidepsin

Affiliations

Translation Elongation Factor eEF1A2 is a Novel Anticancer Target for the Marine Natural Product Plitidepsin

Alejandro Losada et al. Sci Rep. .

Abstract

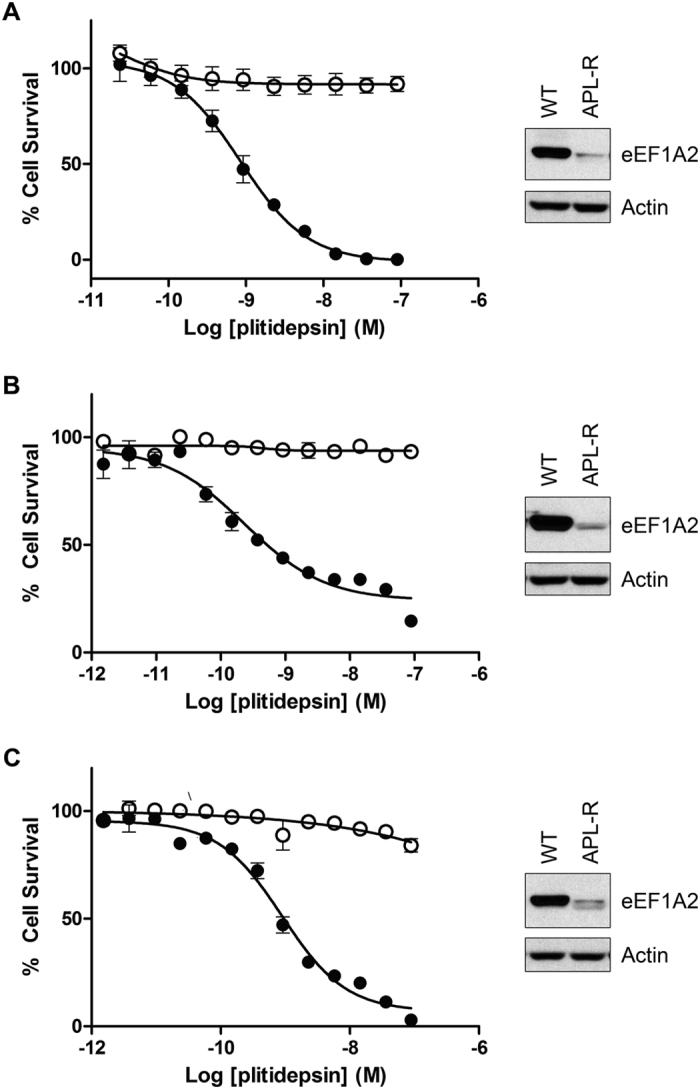
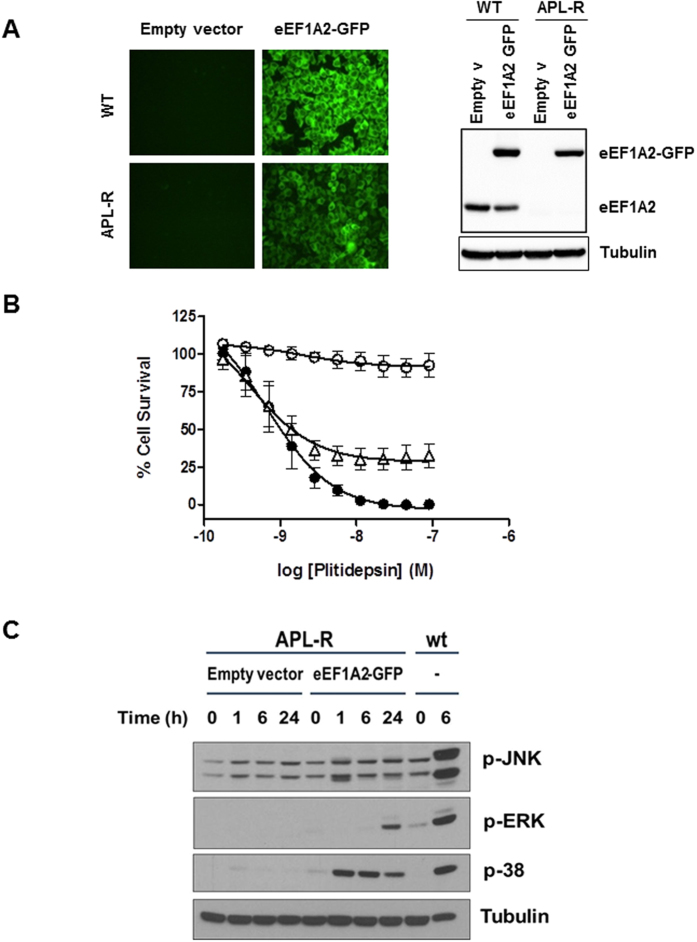
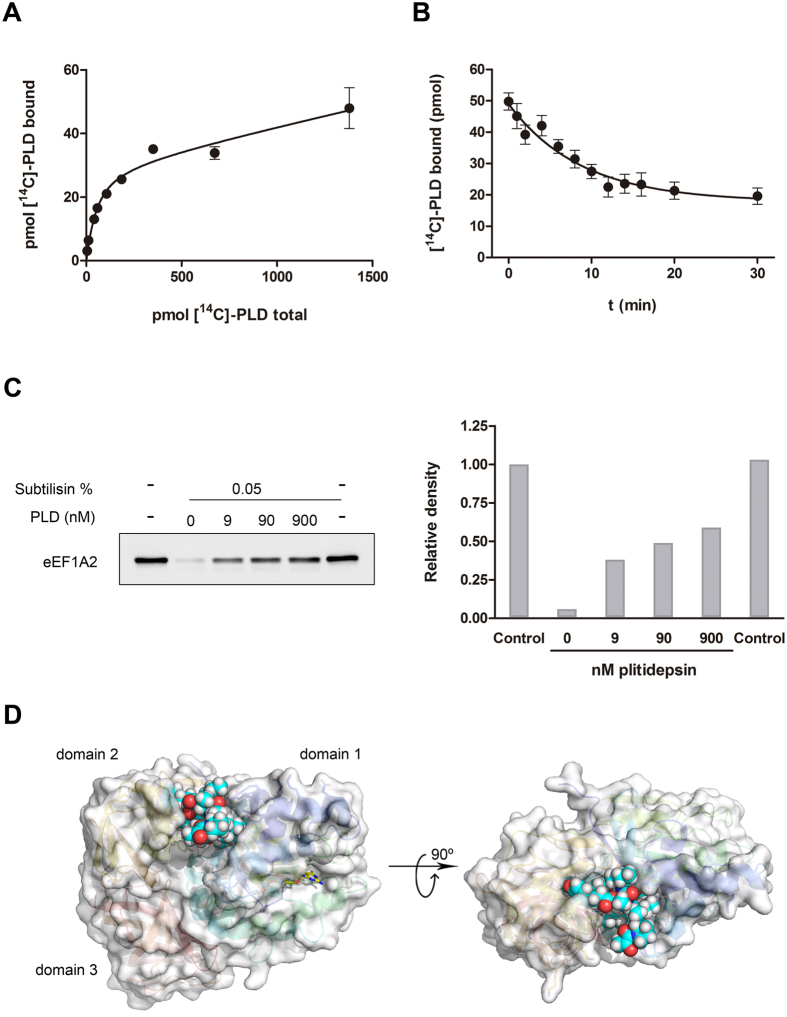
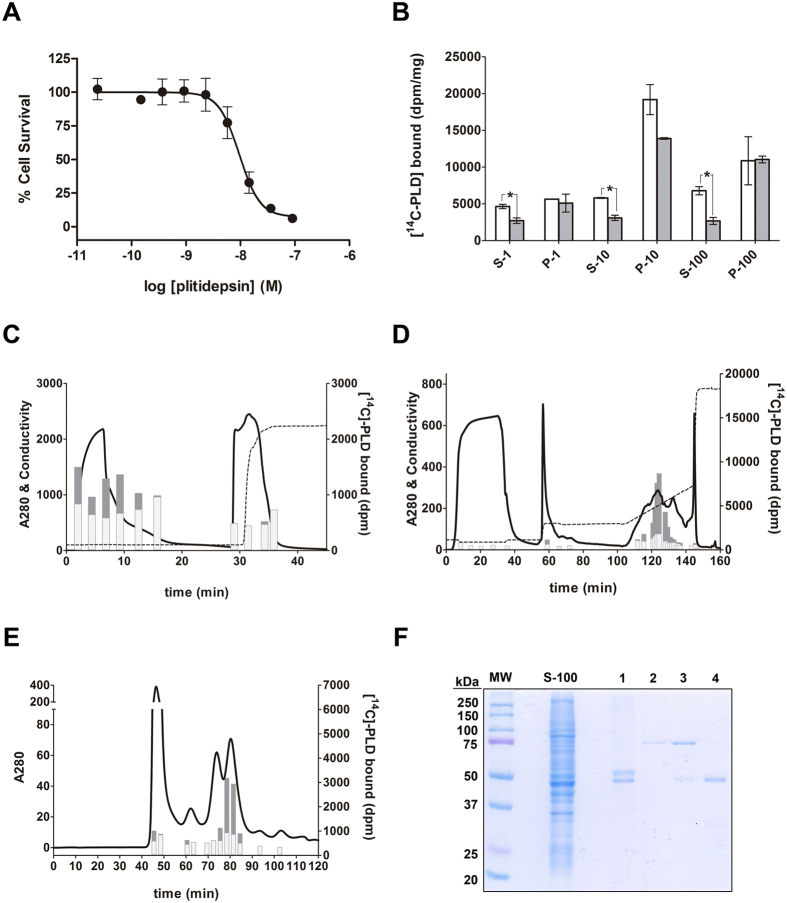
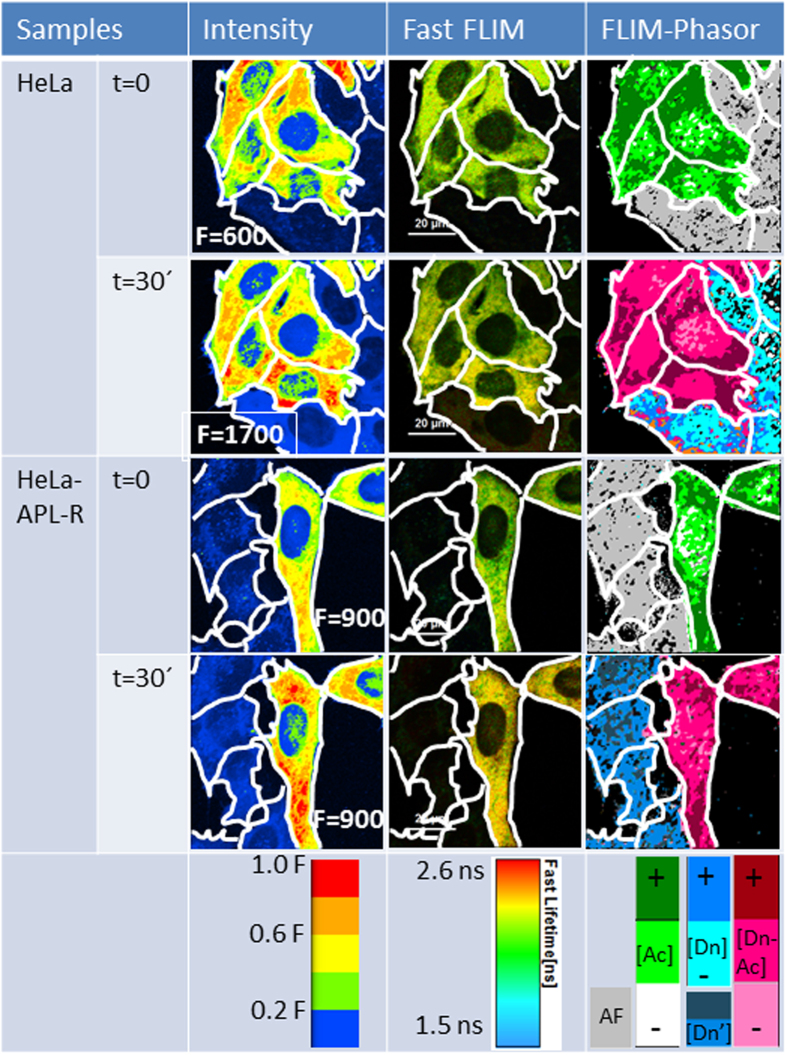
eEF1A2 is one of the isoforms of the alpha subunit of the eukaryotic Elongation Factor 1. It is overexpressed in human tumors and is endowed with oncogenic properties, favoring tumor cell proliferation while inhibiting apoptosis. We demonstrate that plitidepsin, an antitumor agent of marine origin that has successfully completed a phase-III clinical trial for multiple myeloma, exerts its antitumor activity by targeting eEF1A2. The drug interacts with eEF1A2 with a KD of 80 nM and a target residence time of circa 9 min. This protein was also identified as capable of binding [14C]-plitidepsin in a cell lysate from K-562 tumor cells. A molecular modelling approach was used to identify a favorable binding site for plitidepsin at the interface between domains 1 and 2 of eEF1A2 in the GTP conformation. Three tumor cell lines selected for at least 100-fold more resistance to plitidepsin than their respective parental cells showed reduced levels of eEF1A2 protein. Ectopic expression of eEF1A2 in resistant cells restored the sensitivity to plitidepsin. FLIM-phasor FRET experiments demonstrated that plitidepsin localizes in tumor cells sufficiently close to eEF1A2 as to suggest the formation of drug-protein complexes in living cells. Altogether, our results strongly suggest that eEF1A2 is the primary target of plitidepsin.


Conflict of interest statement

Alejandro Losada, María José Muñoz-Alonso, Juan Fernando Martínez-Leal, Juan Manuel Domínguez and Carlos M. Galmarini are employees and shareholders of Pharma Mar S.A. M.Pilar Lillo and Federico Gago have received a research grant from Pharma Mar S.A.

Figures

Figure 1
Figure 1. Plitidepsin-resistant cells lose expression of eEF1A2 protein.
Cell growth inhibition curves were obtained after 72 h of exposure to several plitidepsin concentrations for HeLa and HeLa-APL-R cervical cancer cells (A), NCI-H460 and NCI-H460-APL-R non-small cell lung cancer cells (B) and HGC27 and HGC27-APL-R gastric carcinoma cells (C). In all cases eEF1A2 protein levels were analyzed by Western Blot as shown in the right hand side of each graph. ● wild type cells, ○ APL-R cells.
Figure 2
Figure 2. Ectopic expression of eEF1A2 in HeLa-APL-R cells restores sensitivity to plitidepsin.
(A) HeLa and HeLa-APL-R cells were stably transfected with an expression vector encoding for eEF1A2-GFP fusion protein. Clones homogeneously expressing the GFP were selected. The levels of expression of eEF1A2 were analyzed by Western blot using specific antibodies. The position of the endogenous and the GFP-fusion proteins are indicated. HeLa-APL-R cells showed lower levels of eEF1A2 protein than HeLa cells. Levels of expression attained after transfection were similar to the endogenous levels. (B) Antiproliferative activity of plitidepsin in HeLa (●), HeLa-APL-R (○), or in the HeLa-APL-R subline stably transfected with a plasmid encoding eEF1A2-GFP (∆). Concentration-response curves were performed at 72 h. Cell growth was determined by the MTT method and expressed as percentage of control cell survival. (C) HeLa and HeLa-APL-R cells overexpressing eEF1A2-GFP were exposed to plitidepsin (450 nM) for the indicated times and protein expression analyzed by Western blot with the appropriate antibodies.
Figure 3
Figure 3. Interaction of [14C]-plitidepsin with eEF1A2 purified from rabbit skeletal muscle.
(A) Saturation binding curve. Protein and radioligand were incubated for 1 h at room temperature and samples were processed as described in the text. Dots represent the mean of triplicate experiments with error bars representing S.D. The line shows the best fit to the mathematical equation derived by Swillens accounting for ligand depletion and non-specific binding. (B) Dissociation kinetics of [14C]-plitidepsin from eEF1A2. The experiment was performed as described in the text, and the experimental points were fitted to a single exponential decay equation by non-linear regression. Dots represent the mean of triplicate determinations with error bars denoting S.D., the line shows to the best fit to the exponential equation. (C) Plitidepsin protects eEF1A2 against proteolysis in DARTS assays. HeLa protein extracts were incubated with plitidepsin (APL) at the indicated concentrations for 1h. Extracts were then digested with the indicated concentrations of subtilisin for 30 min at room temperature. Samples were resolved by SDS-PAGE and the degradation of eEF1A2 analyzed by Western blot; quantitation of the bands from the DARTS assay was performed with the ImageJ software. (D) Molecular model showing the proposed mode of binding of plitidepsin (CPK) at the domain1-domain 2 interface of GTP-bound eEF1A2 (protein residues enveloped by a semitransparent solvent-accessible surface and GTP in domain 1 shown as sticks).
Figure 4
Figure 4. Identification of the plitidepsin-binding protein in a K-562 cells lysate.
(A) Growth inhibition curve for K-562 chronic myelogenous leukemia cells after 72 h of exposure to several plitidepsin concentrations. (B) Subcellular fractions from K-562 cells were obtained and binding to [14C]-plitidepsin measured as detailed under “Materials and methods” using a 20-fold excess of unlabeled plitidepsin to determine the levels of non-specific binding (grey bars) that were compared to the levels of total binding (white bars) observed in the absence of unlabeled drug. In the horizontal axis “P” and “S” mean “pellet” and “supernatant”, respectively, with the figure aside denoting the relative centrifugal force (in thousands of g) used to obtain such fraction. Data (in dpm per mg of protein) represent the mean of three independent samples with error bars showing S.D. * means p < 0.05. (C) Anion-exchange chromatography on DEAE, flow rate 5 mL/min. (D) Cation-exchange chromatography on SP, flow rate 2.5 mL/min. (E) Size exclusion chromatography on Superdex 200, flow rate 4 mL/min. Representative fractions (4-mL) from each portion of the eluates were analyzed for their binding to [14C]-plitidepsin in the presence (grey bars, non-specific binding) or absence (black bars, total binding) of a 20-fold excess of unlabeled drug. Only fractions showing significant specific binding to the radioligand were pooled and progressed to the next chromatographic step. In all cases absorbance is expressed in mAU and conductivity in mS/cm. (F) PAGE-SDS of fractions from the size exclusion chromatography shown in panel D. MW, molecular weight markers; S-100 is the initial S-100 sample from the K-562 cells lysate; samples 1, 2, 3 and 4 correspond to the peaks eluting at 48, 63, 74, and 80 min respectively in the chromatogram displayed in panel E.
Figure 5
Figure 5. Cellular localization of plitidepsin-eEF1A2 complexes in living HeLa cells by steady-state fluorescence, fast FLIM and FLIM-phasor FRET imaging approaches.
First column: Normalized steady-state fluorescence intensity images of representative HeLa and HeLa-APL-R cells transfected with eEF1A2-GFP, at time zero (t = 0) and after 30 minutes of treatment with 10 nM plitidepsin-DMAC, using a false five color intensity scale with F = maximum number of fluorescence photons per pixel. Acquisition time was 1.2 ms/pixel. Second column: Fast-FLIM images of the same cells from SymphoTime 64 Program (PicoQuant, GmbH), using a false rainbow scale (1.5–2.6 ns). Third column: FLIM-phasor images of the same cells from the SimFCS package. At time zero, only the Ac (eEF1A2-GFP) and autofluorescence (AF) signals are present. Grey represents AF; white, light green and dark green represent eEF1A2-GFP at low, medium and high concentration respectively; light and dark Cyan represent plitidepsin-DMAC species at low and high concentration, respectively in HeLa cells; Blue: plitidepsin-DMAC species in HeLa-APL-R cells; light, dark pink and garnet: plitidepsin-DMAC/eEF1A2-GFP FRET complexes.

References

    1. Abbas W., Kumar A. & Herbein G. The eEF1A Proteins: At the Crossroads of Oncogenesis, Apoptosis, and Viral Infections. Front Oncol 5, 75 (2015). - PMC - PubMed
    1. Li Z. et al.. Eef1a2 promotes cell growth, inhibits apoptosis and activates JAK/STAT and AKT signaling in mouse plasmacytomas. PLoS One 5, e10755 (2010). - PMC - PubMed
    1. Mateyak M. K. & Kinzy T. G. eEF1A: thinking outside the ribosome. J Biol Chem 285, 21209–21213 (2010). - PMC - PubMed
    1. Sun Y. et al.. Up-regulation of eEF1A2 promotes proliferation and inhibits apoptosis in prostate cancer. Biochem Biophys Res Commun 450, 1–6 (2014). - PubMed
    1. Hotokezaka Y. et al.. Interaction of the eukaryotic elongation factor 1A with newly synthesized polypeptides. J Biol Chem 277, 18545–18551 (2002). - PubMed

Publication types