. 2016 Oct 7:6:34589.
doi: 10.1038/srep34589.

Differential transcriptional responses to Ebola and Marburg virus infection in bat and human cells

Affiliations

Differential transcriptional responses to Ebola and Marburg virus infection in bat and human cells

Martin Hölzer et al. Sci Rep. .

Erratum in

  • Corrigendum: Differential transcriptional responses to Ebola and Marburg virus infection in bat and human cells.
    Hölzer M, Krähling V, Amman F, Barth E, Bernhart SH, Carmelo VA, Collatz M, Doose G, Eggenhofer F, Ewald J, Fallmann J, Feldhahn LM, Fricke M, Gebauer J, Gruber AJ, Hufsky F, Indrischek H, Kanton S, Linde J, Mostajo N, Ochsenreiter R, Riege K, Rivarola-Duarte L, Sahyoun AH, Saunders SJ, Seemann SE, Tanzer A, Vogel B, Wehner S, Wolfinger MT, Backofen R, Gorodkin J, Grosse I, Hofacker I, Hoffmann S, Kaleta C, Stadler PF, Becker S, Marz M. Hölzer M, et al. Sci Rep. 2017 Jan 11;7:39421. doi: 10.1038/srep39421. Sci Rep. 2017. PMID: 28074834 Free PMC article. No abstract available.

Abstract

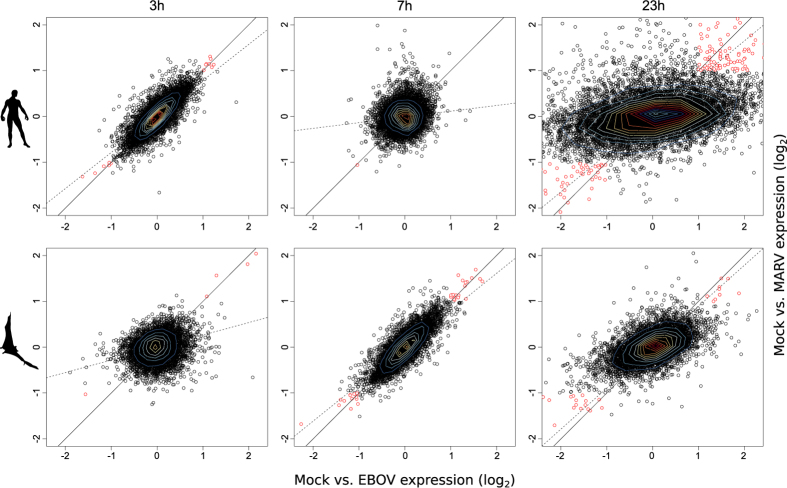
The unprecedented outbreak of Ebola in West Africa resulted in over 28,000 cases and 11,000 deaths, underlining the need for a better understanding of the biology of this highly pathogenic virus to develop specific counter strategies. Two filoviruses, the Ebola and Marburg viruses, result in a severe and often fatal infection in humans. However, bats are natural hosts and survive filovirus infections without obvious symptoms. The molecular basis of this striking difference in the response to filovirus infections is not well understood. We report a systematic overview of differentially expressed genes, activity motifs and pathways in human and bat cells infected with the Ebola and Marburg viruses, and we demonstrate that the replication of filoviruses is more rapid in human cells than in bat cells. We also found that the most strongly regulated genes upon filovirus infection are chemokine ligands and transcription factors. We observed a strong induction of the JAK/STAT pathway, of several genes encoding inhibitors of MAP kinases (DUSP genes) and of PPP1R15A, which is involved in ER stress-induced cell death. We used comparative transcriptomics to provide a data resource that can be used to identify cellular responses that might allow bats to survive filovirus infections.


Figures

Figure 1
Figure 1. Monitoring sample preparation.
(A) HuH7 and R06E-J cells were infected with MARV or EBOV (MOI = 3) or left uninfected (Mock). Samples were collected after 3, 7 and 23 h post infection (p.i.). (B) RNA of infected and uninfected cells was isolated at 3, 7 and 23 h p.i., checked for quality and quantity, and filovirus-specific real time PCR was performed according to Panning et al.. (C,D) To determine the number of infected cells, immunofluorescence analyses were performed with infected cells grown on one coverslip within each well used for RNA preparation. Infected cells were visualized (red) using mouse monoclonal antibodies against EBOV (C) or MARV (D) nucleoproteins and fluorescently tagged secondary antibodies. DAPI staining was used to visualize cell nuclei (blue). Ct-cycle threshold.
Figure 2
Figure 2. Methods pipeline.
(1) Data acquisition: Total RNA from HuH7 and R06E-J cell lines 3, 7 and 23 h p.i. was depleted of ribosomal RNA and sequenced. We controlled the quality and trimmed the data with PrinSeq and FastQC. (2) For bat RNA, we assembled a de novo transcriptome by adding pooled MiSeq to HiSeq data using various assembly tools and parameter settings. (3) Mapping was performed for Mock-, EBOV-, and MARV-treated cells onto human/bat genomes and the bat transcriptome with segemehl and TopHat. (4) Differential gene expression analysis was performed by counting uniquely mapped reads and applying a DESeq analysis. The results were used for clustering and scatter/group plot analyses. (5) Homology searches in bats were performed for all significantly differentially expressed genes from (4) and for the genes that were presumed to be involved in the response to infection based on the literature and an enriched pathway analysis. The R. aegyptiacus genome and coding sequences from P. vampyrus were used to validate and detect homologous sequences in the bat transcriptome. Detected homologs were used for the differential gene-expression analysis. We also investigated the quality of the transcriptome assembly by comparing the human and R. aegyptiacus genomes with the corresponding assembly. (6) During the manual inspection, we identified the synonyms of gene names and noted their existence in the relevant pathways. Each candidate gene was manually investigated in the IGV and UCSC browsers for the human and bat samples from all time points. We report the conservation of genes according to the 100 Species Vertebrate Multiz Alignment to chimp, mouse, dog, elephant and chicken sequences. We searched for nucleotide modifications (differential SNPs, posttranscriptional modifications), intronic transcripts and regulators, alternative splicing and isoforms, and upstream and downstream transcript characteristics.
Figure 3
Figure 3. Human HuH7 cells support an earlier onset of filoviral RNA synthesis than bat R06E-J cells.
Attachment of the virions to the cell surface leads to cell mediated macropinocytosis. Within one hour after attachment to the host cell, Ebola is endocytosed, viral transcription can be detected at 2–4 h p.i., and newly synthesized proteins can be detected via IFA at 6–10 h p.i. Mature nucleocapsids primed for transport are present at 10–12 h p.i. (Materials and Methods). The first replication cycle is finished after 15–18 h, when virions are released from the host cells. Host cells die between 2 to 7 days. Between 3 and 7 h p.i. of EBOV-infected R06E-J cells, we observed an ~4.8X increase in the number of reads that mapped uniquely to the EBOV genome. This indicates that EBOV genes are rapidly replicated and transcribed in the bat cells in the first 4 h p.i. (see Table S2 for normalized read counts). We observed a further 41X increase in reads between 7 and 23 h p.i. in R06E-J cells. So, this RNA synthesis rate slows down within this next 16 h (compared to 4.8X4 ≃ 530X). In comparison, unique reads mapping to the EBOV genome in HuH7 cells increased 15.6X between 3 and 7 h p.i. and a further 15.5X in the following 16 h. This result indicates a significant increase in the RNA synthesis rate of viral RNAs in the first few hours and a marked decrease in the following hours.
Figure 4
Figure 4. Significantly regulated genes in cells infected with EBOV or MARV.
(A) Number of strongly regulated human genes after infection with EBOV or MARV. There were only a few genes that were significantly regulated (padj <0.1) at 3 and 7 h p.i. in both EBOV- and MARV-infected cells compared with their expression in Mock-treated cells. At 23 h p.i., the number of regulated genes was higher (1,678) in EBOV-infected cells than in cells infected with MARV. Adding these ~1,600 strongly regulated genes to the findings from analyses comparing the different time points or viruses resulted in approximately 2,500 genes being identified as significantly differentially transcribed. (B) Heat map of row-scaled log2-fold changes in expression in infected HuH7 and R06E-J-samples against the corresponding Mock samples (e.g., column three shows the fold change between HuH7 Mock-treated cells and HuH7 EBOV-treated cells at 23 h p.i.). The input matrix is scaled within the rows to visualize changes in expression at the gene level. Fold changes are based on unique genome read counts of H. sapiens and R. aegyptiacus. Genes without a clear homologous sequence in the R. aegyptiacus genome or transcriptome assembly are marked with a star. We identified homologous locations (LOC107508087, LOC107515336, LOC107498547) for three genes that were not directly annotated in the R. aegyptiacus genome (EP300, RPS17L, MX1). These locations were identified using our de novo transcriptome assembly (red boxes). We indicated the molecular function of each gene based on the color scheme presented in (D). (C) Highly regulated genes in EBOV- and MARV-infected HuH7 and R06E-J cells. FC – log2-fold change based on DESeq normalized read counts. See Supplement (Tables S5 and S6) and corresponding entries for detailed information. (D) The PANTHER database (v11.0) was used to assign molecular functions to each of the 64 genes in (B) We further subdivided the dominant group of genes that we identified to have a general binding function. During filovirus infections, the most prominent regulatory effects were observed for genes encoding transcription factors, those regulating the NFκB and MAPK pathways, their DUSP inhibitors and growth factors (Figure ES2A and Tables S5 and S6, full tables in the electronic supplement). In addition, changes were also observed for genes that regulate protein translation (RPS17, PPP1R15A), ubiquitination (TRAF6, SQSTM1), autophagocytosis (SQSTM1) and cation transport (CHAC1, ATP2B4). We also observed the strong up-regulation of genes that are involved in energy transfer (e.g., RASGEF1B). Details can be found in Tables S5–S8.
Figure 5
Figure 5. Motif activity response analysis.
The table shows the top significant motifs after the infection of HuH7 cells with EBOV (red) or MARV (blue) compared with the response in Mock controls. Regulated motifs are predicted to target (1) the cell cycle (E2F1..5.p2) by down-regulating CDC6, PCNA and MCM6; (2) NFκB -signaling (NFKB1_REL_RELA.p2) by targeting CXCL isoforms, ELF3, NFκB isoforms, FOSL2 and JUN; (3) EGR1 expression in EBOV-infected cells (KLF12.p2, YY1.p2 and others); or (4) chromatin organization in MARV-infected cells (NRF1.p2, YY1.p2 and others). For selected motifs, the inferred activity changes (points +/−1 SD) after EBOV or MARV infection relative to the corresponding Mock controls are shown for the different time points (3, 7 or 23 h p.i.) adjacent to and below the table. Selected regulatory motifs, the associated genes and their important targets (including their fold change between two time points) can be viewed in Section ES5 and are summarized in File ES5D.
Figure 6
Figure 6. Common gene regulation patterns after filovirus infection.
The scatter plots demonstrate the fold changes in expression as determined by DESeq of coding and non-coding RNAs in MARV- and EBOV-infected cells compared with expression in Mock controls 3, 7 and 23 h after EBOV and MARV infections. We observed similar expression patterns in HuH7 cells at 3h p.i. and in the bat cell line 7 h p.i., suggesting that the progress of filovirus infection is slower in R06E-J cells. The scatter plot derived from the differential expression analysis of HuH7 cells at 23 h p.i. shows the large number of differentially expressed genes. A detailed view of the figures (including genes outside of the plotted range of fold changes) can be found in the electronic supplement, Figure ES4B. Genes demonstrating a similar expression after infection with EBOV and MARV and with an abs (log2 (FC)) > 1 are marked in red. Black line: y = x; Dotted line: regression line.
Figure 7
Figure 7. Effects of filovirus infections on JAK/STAT, PPP1R15A, and DUSP pathways.
(A) The JAK/STAT pathway. The JAK/STAT pathway shows a common trend in expression levels: STAT1, STAT2 and JAK2 were up-regulated (↑) between 3 and 7 h p.i. and then down-regulated (↓) between 7 and 23 h p.i. in EBOV-infected HuH7 cells. The cytokine receptor IFNGR2 is not regulated between 3 and 7 h (=) and shows a 2X up-regulation between 7 and 23 h (2↑) (Figure ES6.22). (B) The PPP1R15A pathway. Growth arrest and DNA damage 34 (GADD34, officially known as PPP1R15A) can be rapidly induced by several types of cellular stress. In R06E-J cells, PPP1R15A was slightly up-regulated (2X) due to EBOV infection after 23 h; in HuH7 cells, we observed a strong up-regulation (45X) in EBOV-infected cells and no up-regulation in MARV-infected cells. (C) The DUSP pathway. DUSP1, 8 and 10 demonstrate the highest specificity for MAPKs (MAPK14 and MAPK8). DUSP1 is localized in the nucleus, whereas DUSP8 and DUSP10 are also available in the cytosol. The nuclear DUSPs are thought to be inducible phosphatases, and the implications of DUSPs during viral infections have been demonstrated for DUSP1, which is up-regulated during Epstein-Barr virus and vaccinia virus infections. In response to the vaccinia virus, DUSP1 is actively involved in antiviral countermeasures of the host cell via the regulation of MAPK phosphorylation. Legend. Boxes indicate up/down-regulation from 3 to 7 h and from 7 to 23 h p.i. in EBOV-infected HuH7 cells (red); MARV-infected HuH7 cells (green); and EBOV-infected R06E-J cells (blue). For cases where the expression level changed by more than 15%, an arrow indicates the direction of regulation (↑/↓). When the expression level changed by more than 100% (2-fold change in transcription), the number beside the arrow indicates the fold change. “=” indicates expression changes of <15%. Squares around gene names indicate differential expression within the HuH7 cell line (red), between EBOV- and MARV-infected cells (green) and between HuH7 and R06E-J cells (blue).
Figure 8
Figure 8. The filovirus infection network.
EBOV and MARV keyplayers in HuH7 and R06E-J cells on transcriptional level and their interactions on protein level are displayed. We combined significant differentially expressed genes from known pathways and the literature. Nearly all of the highly deregulated keyplayers of most significant pathways of this study (e.g. MAPK, NFκB, JAK/STAT and DUSP) are part of this filovirus infection network. We are not able to connect all genes (e.g. SKP2 inhibiting CDKN1B, CYCE and CDKN1A). We found seven members of the DUSP pathway (DUSP1, 4, 5, 6, 8, 10 and 16) being highly deregulated and involved in many interactions, mostly repressing MAPK8, MAPK1/MAPK3 and MAPK14. We found several transcription factors (e.g. FOS, JUN, ATF3) being up-regulated during EBOV infection on high levels. Cilloniz et al. performed global gene expression analysis of spleen samples of mice infected with different mouse-adapted EBOVs. Here, we mainly confirm the results for HuH7 cells. Yellow background—receptors and associated proteins; blue background—nuclear proteins; red boxes—significant differentially expression in HuH7 cells between 3, 7 and 23 h; green boxes—significant differentially expression between EBOV and MARV; blue boxes—significant differentially expression between HuH7 and R06E-J cells. A detailed picture, gene descriptions and gene regulations can be viewed at Figure ES6.1.

References

    1. Feldmann H., Klenk H. D. & Sanchez A. Molecular biology and evolution of filoviruses. Arch. Virol. Suppl. 7, 81–100 (1993). - PubMed
    1. Pourrut X. et al.. Large serological survey showing cocirculation of Ebola and Marburg viruses in Gabonese bat populations, and a high seroprevalence of both viruses in Rousettus aegyptiacus. BMC Infect. Dis. 9, 159 (2009). - PMC - PubMed
    1. Saez A. M. et al.. Investigating the zoonotic origin of the West African Ebola epidemic. EMBO Mol Med (2014). - PMC - PubMed
    1. Towner J. S. et al.. Marburg virus infection detected in a common African bat. PLoS ONE 2, e764 (2007). - PMC - PubMed
    1. Towner J. S. et al.. Isolation of genetically diverse Marburg viruses from Egyptian fruit bats. PLoS Pathog. 5, e1000536 (2009). - PMC - PubMed

Publication types