

Review
doi: 10.6004/jadpro.2016.7.1.8.
Epub 2016 Jan 1.
An Introduction to Survival Statistics: Kaplan-Meier Analysis
Affiliations
- PMID: 27713848
- PMCID: PMC5045282
- DOI: 10.6004/jadpro.2016.7.1.8
Item in Clipboard
Review
An Introduction to Survival Statistics: Kaplan-Meier Analysis
J Adv Pract Oncol.
2016 Jan-Feb.
No abstract available
Figures
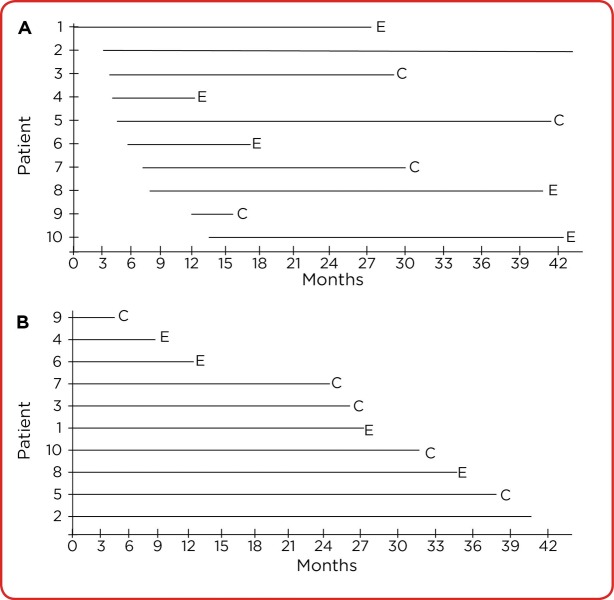
(A) Hypothetical first patients assigned to arm A as they sequentially enter the study. Each patient’s serial time (on study) ends with an E (for death in this example) or a C (for censored). If the data analysis is completed at the end of the period marked by the right border of the x-axis, all patients who have not died or already been censored are censored at that point. (B) The same hypothetical patients are arranged from shortest to longest serial time before K-M analysis, allowing us to see the initial intervals that will be graphed on the horizontal (time) axis.
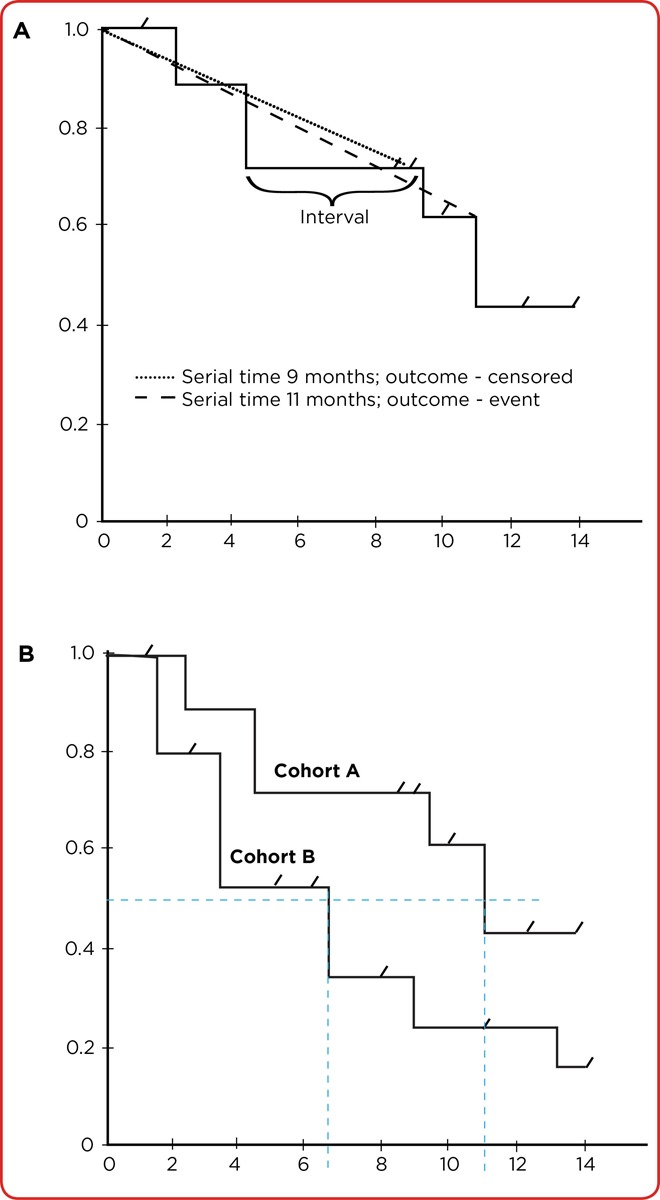
(A) A hypothetical Kaplan-Meier curve of one cohort (arm). Each horizontal portion is the interval between the studied event between one and the next subject in that arm. Only the event influences the interval length, whereas tick marks indicate censored subjects. (B) Median survival (from experiencing the studied event) can be estimated in both arms by drawing a line on the y-axis at 0.5 (50%). Locating the point at which each intersects 0.5 shows median survival is approximately 6.5 months in cohort B and 11 months in cohort A.
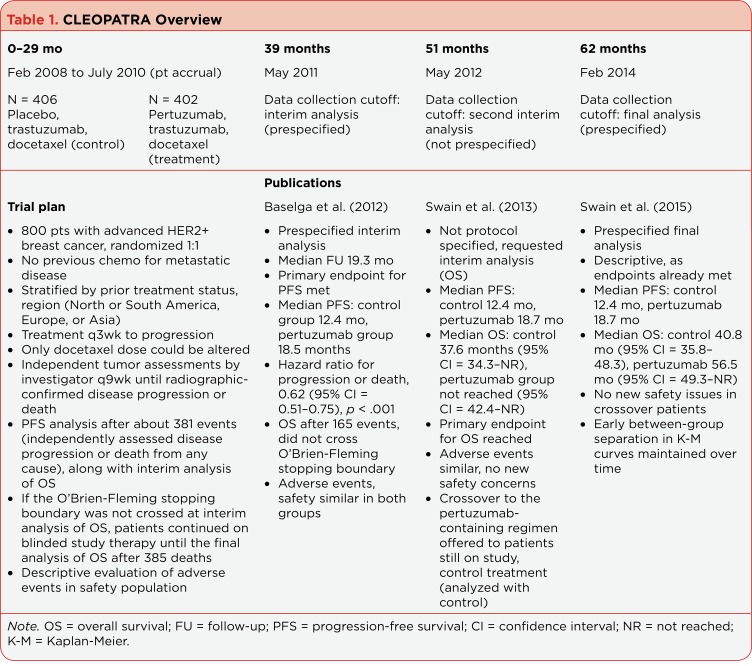
CLEOPATRA Overview
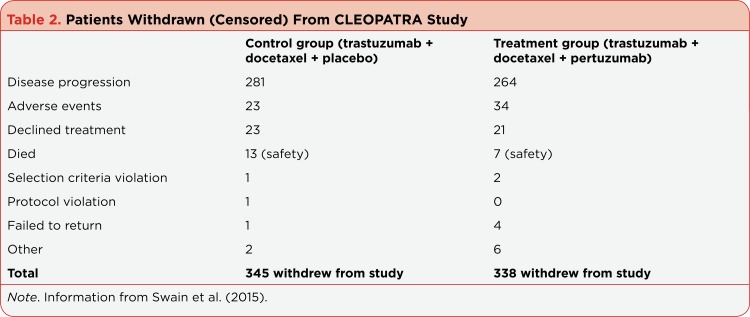
Patients Withdrawn (Censored) From CLEOPATRA Study
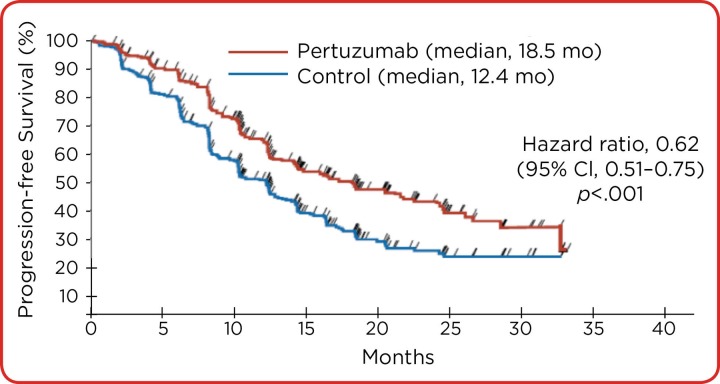
Kaplan-Meier estimates of progression- free survival in patients in the intention to- treat population in the CLEOPATRA trial. Tick marks designate the times of events. This highlights the importance of carefully reading legends, particularly in Kaplan-Meier curves in which tick marks or dots usually indicate censored individuals. Adapted from Baselga et al. (2012).
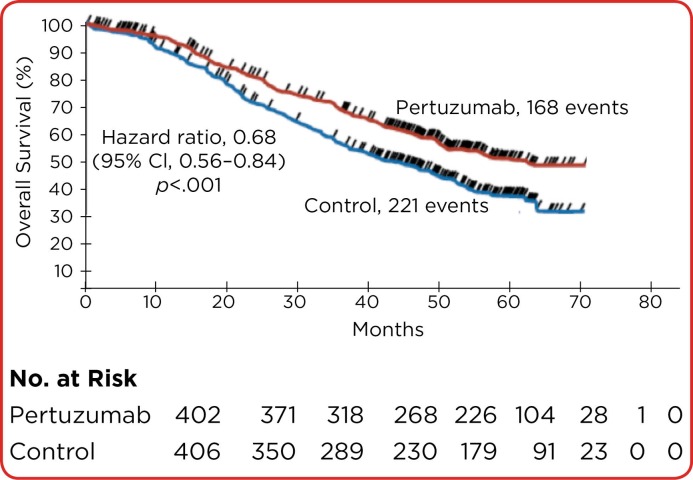
Kaplan-Meier estimates of overall survival in the intention-to-treat population in the CLEOPATRA trial. In this curve, tick marks indicate censored patients. Because this curve shows overall survival, censored patients most likely experienced progressive disease, and some of the early ones were probably docetaxel-related toxicity. If we look at the plot and estimate overall survival, our calculations will be close to what was found in the statistical analysis (56.5 months in the pertuzumab group and 30.8 months in the control group). Note that the number at risk decreases as the curve moves to the right, and most patients have been censored or died. According to recommendations, analysis after 60 months would not be recommended because of decreased accuracy. Adapted from Swain et al. (2015).
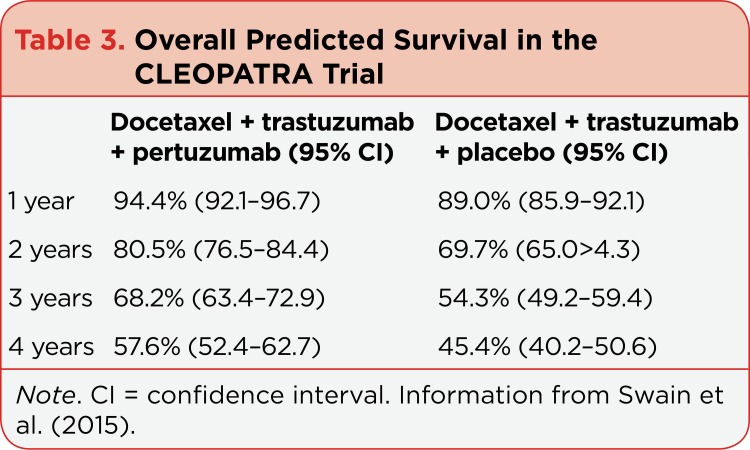
Overall Predicted Survival in the CLEOPATRA Trial
References
-
- Baselga José, Cortés Javier, Kim Sung-Bae, Im Seock-Ah, Hegg Roberto, Im Young-Hyuck, Roman Laslo, Pedrini José Luiz, Pienkowski Tadeusz, Knott Adam, Clark Emma, Benyunes Mark C, Ross Graham, Swain Sandra M. Pertuzumab plus trastuzumab plus docetaxel for metastatic breast cancer. The New England journal of medicine. 2012;366:109–119. - PMC - PubMed
-
- Bollschweiler Elfriede. Benefits and limitations of Kaplan-Meier calculations of survival chance in cancer surgery. Langenbeck’s archives of surgery / Deutsche Gesellschaft für Chirurgie. 2003;388:239–244. - PubMed
-
- Brant J M, Beck S. L, Dudley W N, Cobb P, Pepper G, Miaskowski C. Symptom trajectories in posttreatment cancer survivors. . Cancer Nursing. 2011;34(1):67–77. - PubMed
-
- Dudley William N, McGuire Deborah B, Peterson Douglas E, Wong Bob. Application of multilevel growth-curve analysis in cancer treatment toxicities: the exemplar of oral mucositis and pain. Oncology nursing forum. 2009;36:E11–19. - PubMed
Publication types
LinkOut - more resources
Full Text Sources
Other Literature Sources