. 2016 Oct 5;2(10):e1600873.
doi: 10.1126/sciadv.1600873. eCollection 2016 Oct.

Relative impacts of mitigation, temperature, and precipitation on 21st-century megadrought risk in the American Southwest

Affiliations

Relative impacts of mitigation, temperature, and precipitation on 21st-century megadrought risk in the American Southwest

Toby R Ault et al. Sci Adv. .

Abstract

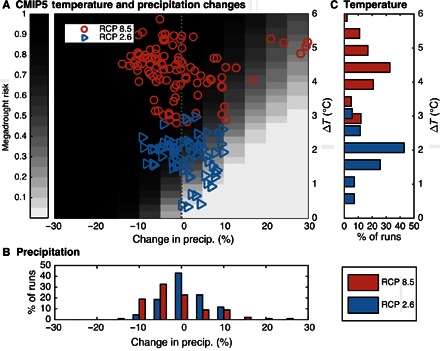
Megadroughts are comparable in severity to the worst droughts of the 20th century but are of much longer duration. A megadrought in the American Southwest would impose unprecedented stress on the limited water resources of the area, making it critical to evaluate future risks not only under different climate change mitigation scenarios but also for different aspects of regional hydroclimate. We find that changes in the mean hydroclimate state, rather than its variability, determine megadrought risk in the American Southwest. Estimates of megadrought probabilities based on precipitation alone tend to underestimate risk. Furthermore, business-as-usual emissions of greenhouse gases will drive regional warming and drying, regardless of large precipitation uncertainties. We find that regional temperature increases alone push megadrought risk above 70, 90, or 99% by the end of the century, even if precipitation increases moderately, does not change, or decreases, respectively. Although each possibility is supported by some climate model simulations, the latter is the most common outcome for the American Southwest in Coupled Model Intercomparison 5 generation models. An aggressive reduction in global greenhouse gas emissions cuts megadrought risks nearly in half.

Keywords: Megadrought; climate change; climate risk; hydroclimate; mitigation.


Figures

Fig. 1
Fig. 1. Megadrought risk estimates for the American Southwest shown with model-projected changes in mean hydroclimate.
(A to C) Megadrought risk estimates for the American Southwest (shading) shown with model-projected changes in mean hydroclimate under the RCP 8.5 (high emissions) scenario for (A) annual precipitation and JJA soil moisture (PDSI, 30-cm soil moisture, and 2-m soil moisture) in the CESM LENS, (B) annual precipitation from all CMIP5 models, and (C) JJA soil moisture indicators derived from a 17-model subset of CMIP5 for which all variables needed to compute these quantities were available (7). In all panels, the interquartile range of the ensemble is shown (the full range is shown in the Supplementary Materials). Model-based variables are normalized to unit variance over a historical reference period (1951–2000) and compared with midcentury changes (2051–2080). The shading shows the 2D PDF of megadrought risk for combinations of changes in the mean (Δμ) and variability (δσ) of a normalized drought indicator time series [z′(t)].
Fig. 2
Fig. 2. Megadrought risk expressed as a function of both mean precipitation and temperature for the American Southwest compared with projected changes in temperature and precipitation.
(A) Megadrought risk expressed as a function of both mean precipitation and temperature for the American Southwest (shading) compared with projected changes in temperature and precipitation (symbols) for two scenarios: RCP 2.6 (low emissions, blue triangles) and RCP 8.5 (high emissions, red circles). CMIP5 estimates of change are expressed as the difference between the historical reference period (1951–2000) and the midcentury average (2051–2080). The megadrought risk surface (shading) is the average of all 2D PDFs calculated at each grid point in the Southwest for each combination of temperature and precipitation change. JJA PDSI is used as the reference normalized drought indicator time series [z′(t)]. The vertical dashed line marks no change in precipitation. (B) Marginal distribution of precipitation change in CMIP5 models, binned at 5% intervals from −30 to +30% of historical climatology. (C) Marginal distribution of temperature changes, binned at 0.5°C intervals from zero to six.
Fig. 3
Fig. 3. Megadrought risk estimates for fixed mean precipitation changes, shown as a function of mean annual temperature and compared with CMIP5 projections of mean warming from 2051 to 2100 compared to 1951 to 2000.
Contours show risks for constant levels of mean precipitation change (ΔP), derived from the 2D PDF in Fig. 2. The dashed lines denote the median warming (again comparing 2051–2100 to 1951–2000) from RCP 2.6 (1.9°C) and RCP 8.5 (4.5°C) and their corresponding risks assuming no change in precipitation (ΔP = 0%).
Fig. 4
Fig. 4. Maps of megadrought risk for the American Southwest under different levels of warming, and the required increase in precipitation to compensate for that warming.
(A to C) Maps of megadrought risk for the entire American Southwest domain at constant (historical) precipitation climatology (ΔP = 0%) and various levels of warming. These estimates are based on the Monte Carlo procedure of observational and reanalysis data, not on CMIP5 (see Materials and Methods). (D to F) Increases in precipitation (blue shading) needed to maintain megadrought risks below 50% for different levels of regional warming. Contours map the projected changes in precipitation derived from the multimodel CMIP5 mean and are shown for reference at each level of temperature change.

References

    1. Acuna-Soto R., Stahle D. W., Cleaveland M. K., Therrell M. D., Megadrought and megadeath in 16th century Mexico. Emerg. Infect. Dis. 8, 360–362 (2002). - PMC - PubMed
    1. Woodhouse C. A., Overpeck J. T., 2000 years of drought variability in the central United States. Bull. Am. Meteorol. Soc. 79, 2693–2714 (1998).
    1. Buckley B. M., Anchukaitis K. J., Penny D., Fletcher R., Cook E. R., Sano M., Le C. N., Wichienkeeo A., Minh T. T., Hong T. M., Climate as a contributing factor in the demise of Angkor, Cambodia. Proc. Natl. Acad. Sci. U.S.A. 107, 6748–6752 (2010). - PMC - PubMed
    1. Shanahan T. M., Overpeck J. T., Anchukaitis K. J., Beck J. W., Cole J. E., Dettman D. L., Peck J. A., Scholz C. A., King J. W., Atlantic forcing of persistent drought in West Africa. Science 324, 377–380 (2009). - PubMed
    1. Benson L., Petersen K., Stein J., Anasazi (pre-Columbian Native-American) migrations during the middle-12th and late-13th centuries—Were they drought induced? Clim. Change 83, 187–213 (2007).

LinkOut - more resources