. 2016 Dec 21;13(1):125-133.
doi: 10.1039/c6sm01603k.

Shape oscillations of particle-coated bubbles and directional particle expulsion

Affiliations

Shape oscillations of particle-coated bubbles and directional particle expulsion

Vincent Poulichet et al. Soft Matter. .

Abstract

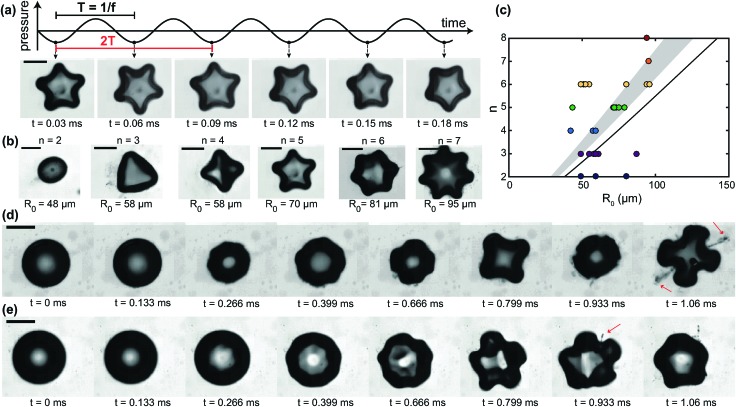
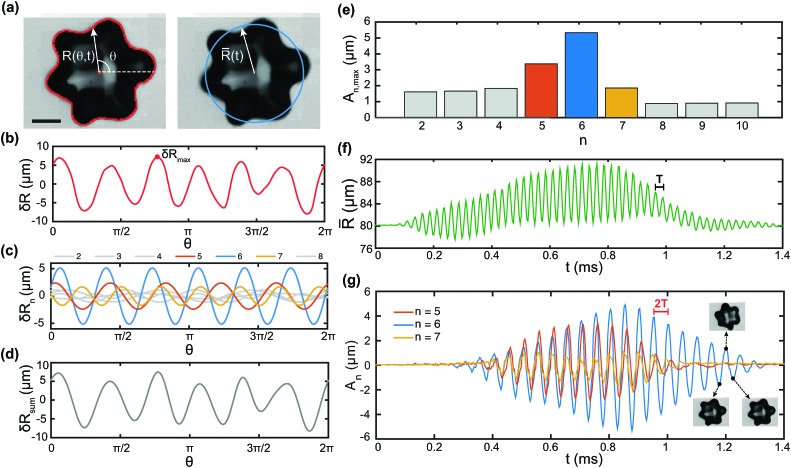
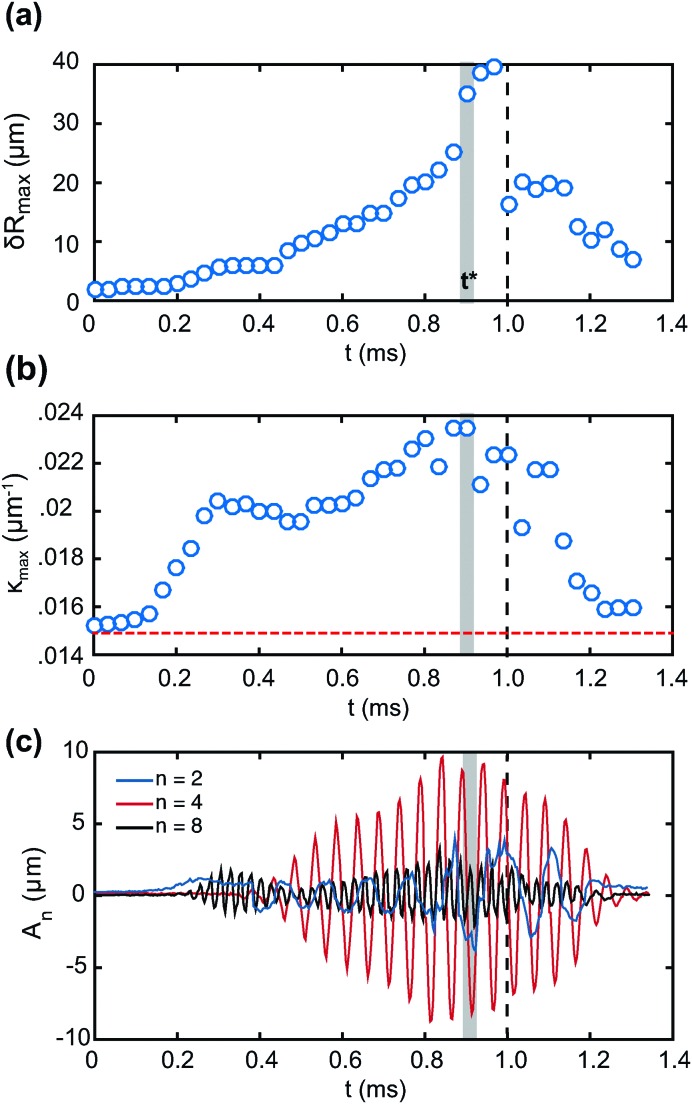
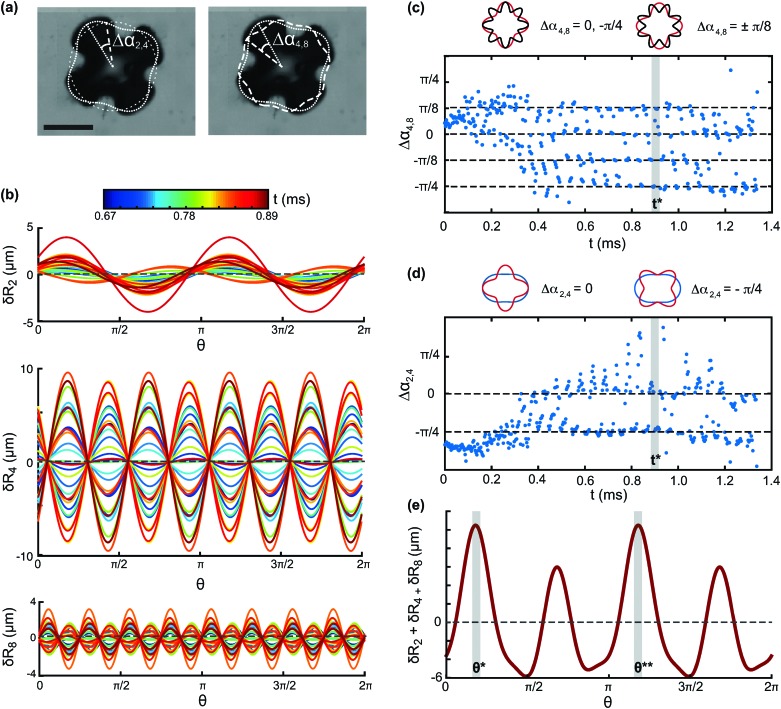
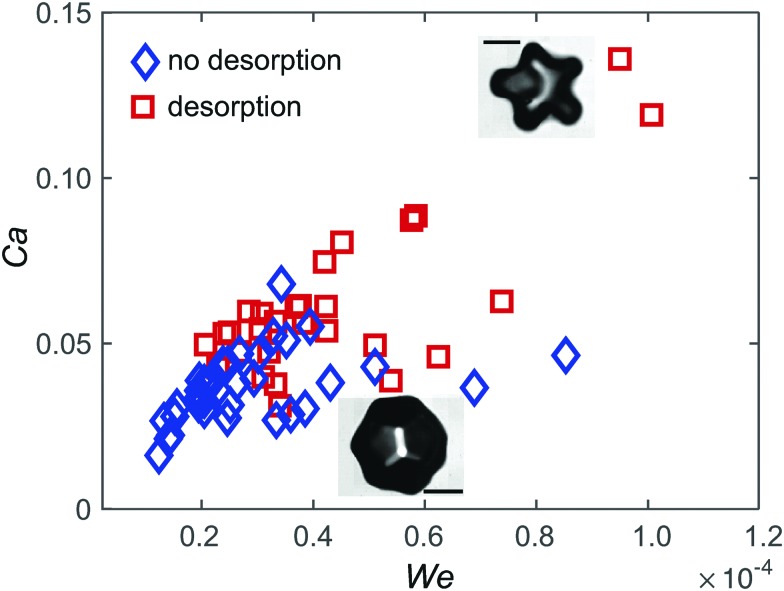
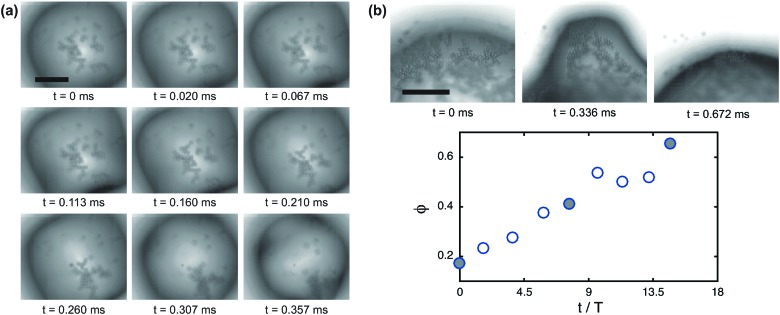
Bubbles stabilised by colloidal particles can find applications in advanced materials, catalysis and drug delivery. For applications in controlled release, it is desirable to remove the particles from the interface in a programmable fashion. We have previously shown that ultrasound waves excite volumetric oscillations of particle-coated bubbles, resulting in precisely timed particle expulsion due to interface compression on a ultrafast timescale [Poulichet et al., Proc. Natl. Acad. Sci. U. S. A., 2015, 112, 5932]. We also observed shape oscillations, which were found to drive directional particle expulsion from the antinodes of the non-spherical deformation. In this paper we investigate the mechanisms leading to directional particle expulsion during shape oscillations of particle-coated bubbles driven by ultrasound at 40 kHz. We perform high-speed visualisation of the interface shape and of the particle distribution during ultrafast deformation at a rate of up to 104 s-1. The mode of shape oscillations is found to not depend on the bubble size, in contrast with what has been reported for uncoated bubbles. A decomposition of the non-spherical shape in spatial Fourier modes reveals that the interplay of different modes determines the locations of particle expulsion. The n-fold symmetry of the dominant mode does not always lead to desorption from all 2n antinodes, but only those where there is favourable alignment with the sub-dominant modes. Desorption from the antinodes of the shape oscillations is due to different, concurrent mechanisms. The radial acceleration of the interface at the antinodes can be up to 105-106 ms-2, hence there is a contribution from the inertia of the particles localised at the antinodes. In addition, we found that particles migrate to the antinodes of the shape oscillation, thereby enhancing the contribution from the surface pressure in the monolayer.


Figures

Fig. 1
Fig. 1. Shape oscillations of particle-coated bubbles and directional particle expulsion. (a) A particle-coated bubble undergoing shape oscillations with mode n = 5. The period of the ultrasonic driving is T = 1/f; the period of the shape oscillation is 2T, corresponding to a frequency f/2. (b) Examples of shape oscillations of particle-coated bubbles with different modes n observed in experiment. R 0 is the resting radius of the bubble. (c) Mode number n versus resting radius R 0. The experimental data (circles) show that the system does not exhibit mode selectivity. The solid line is the theoretical prediction from eqn (1) for an uncoated bubble. The shaded area is the prediction from eqn (1) for the typical range of surface tension of particle-coated bubbles. (d) Growth of shape oscillations (n = 4) during driving by ultrasound, followed by directional particle desorption from 2 of the 8 antinodes. (e) Another example of directional particle desorption driven by shape oscillations with n = 5 (see ESI, Movie S1). All scale bars: 80 μm.
Fig. 2
Fig. 2. Mode decomposition of shape oscillations. (a) Image analysis gives the bubble contour and centre of mass, from which the radial amplitude R(θ,t) is obtained (left). The mean radius R(t) is computed from eqn (2) (right). Scale bar: 80 μm. (b) Deviation from spherical shape, δR(θ) = R(θ) – R, for the frame shown. (c) Fourier decomposition of δR(θ), where δR n(θ) is the contribution of mode n, for the first 8 modes. (d) Deviation from spherical shape reconstructed from the sum of the first 8 modes only. (e) Maximum amplitude of the first 10 modes, showing that the three dominant modes are n = 5, 6, 7. (f) Time evolution of the mean radius R(t). The mean radius oscillates with period T = 1/f. (g) Time evolution of the amplitude of modes n = 5, 6, 7. Every second peak corresponds to the same bubble shape, consistent with subharmonic behaviour with period 2T (frequency f/2).
Fig. 3
Fig. 3. (a) Time evolution of the maximum deviation from spherical shape. The shaded area corresponds to the desorption event and the dashed line corresponds to the end of the ultrasound driving. (b) Time evolution of the maximum interface curvature. The horizontal dashed line represents the curvature of the bubble at rest. (c) Time evolution of the amplitude of the three main modes, n = 2, 4 and 8. The three modes exhibit different frequencies, indicating that the dynamics are non-linear.
Fig. 4
Fig. 4. (a) Contours of modes n = 2, 4 and 8 overlaid on the overall bubble shape. Δα 2,4 and Δα 4,8 are the phase differences between the modes. Scale bar: 80 μm. (b) Time evolution of the three modes. Different times correspond to different colour (see colorbar). (c) Time evolution of the phase difference between modes 4 and 8, Δα 4,8. The two modes align with their antinodes in phase. The shaded area corresponds to the time of desorption. (d) Time evolution of the phase difference between modes 2 and 4, Δα 2,4. The phase difference behaves erratically in time, but the two modes are aligned at the time of desorption (shaded area). (e) Superposition of modes n = 2, 4 and 8 at the time of desorption. The shaded areas mark the locations of the two desorption plumes, which are found to correspond to the locations of maximum deviation from spherical shape.
Fig. 5
Fig. 5. Phase diagram for directed particle desorption driven by shape oscillations. The Weber number, We, and the capillary number, Ca, compare respectively the inertial and viscous force on a particle with the capillary force holding the particle at the interface. The diamonds correspond to experiments where desorption is not observed, the squares to desorption events. The scale bars in the insets are 80 μm.
Fig. 6
Fig. 6. Migration of particles to the antinodes of shape oscillations. (a) Image sequence of a bubble undergoing shape oscillations (n = 4). Over 20 cycles of oscillations the particles accumulate at one of the antinodes (see ESI, Movie S2). Scale bar: 40 μm. (b) Particle tracking shows the net increase in surface coverage φ at an antinode (n = 5) over several periods of oscillation. The time axis is normalised by the period of the ultrasound driving, T. The frames in the image sequence correspond to the filled symbols in the graph. Scale bar: 50 μm.

References

    1. Aveyard R., Binks B. P., Clint J. H. Adv. Colloid Interface Sci. 2003;100–102:503–546.
    1. Binks B. P., Horozov T. S. Angew. Chem., Int. Ed. 2005;44:3722–3725. - PubMed
    1. Binks B. P. Curr. Opin. Colloid Interface Sci. 2002;7:21–41.
    1. Dinsmore A. D., Hsu M. F., Nikolaides M. G., Marquez M., Bausch A. R., Weitz D. A. Science. 2002;298:1006–1009. - PubMed
    1. Kam S. I., Rossen W. R. J. Colloid Interface Sci. 1999;213:329–339. - PubMed