. 2016 Dec;173(24):3502-3521.
doi: 10.1111/bph.13646. Epub 2016 Nov 16.

Role of oxidative stress in oxaliplatin-induced enteric neuropathy and colonic dysmotility in mice

Affiliations

Role of oxidative stress in oxaliplatin-induced enteric neuropathy and colonic dysmotility in mice

Rachel M McQuade et al. Br J Pharmacol. 2016 Dec.

Abstract

Background and purpose: Oxaliplatin is a platinum-based chemotherapeutic drug used as a first-line therapy for colorectal cancer. However, its use is associated with severe gastrointestinal side-effects resulting in dose limitations and/or cessation of treatment. In this study, we tested whether oxidative stress, caused by chronic oxaliplatin treatment, induces enteric neuronal damage and colonic dysmotility.

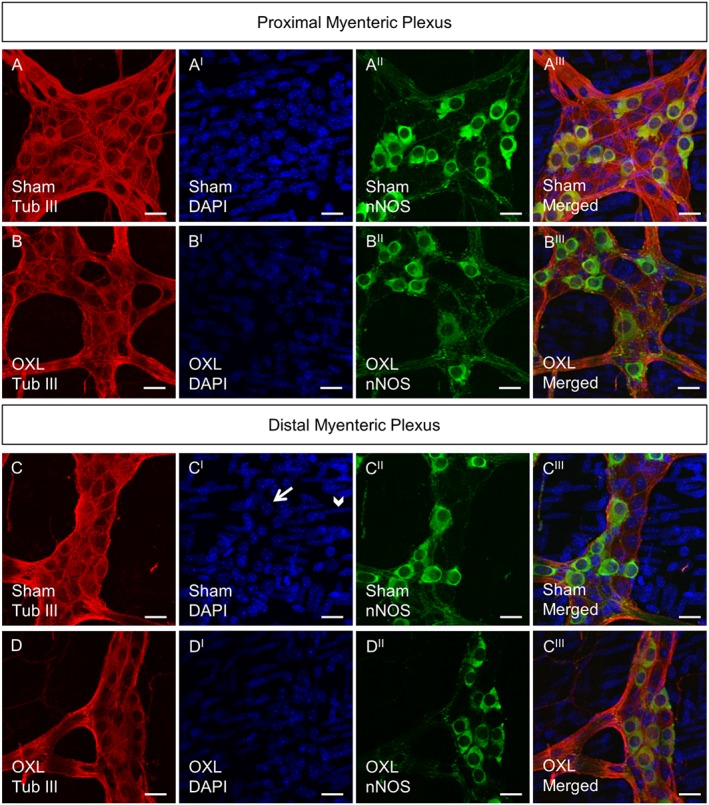
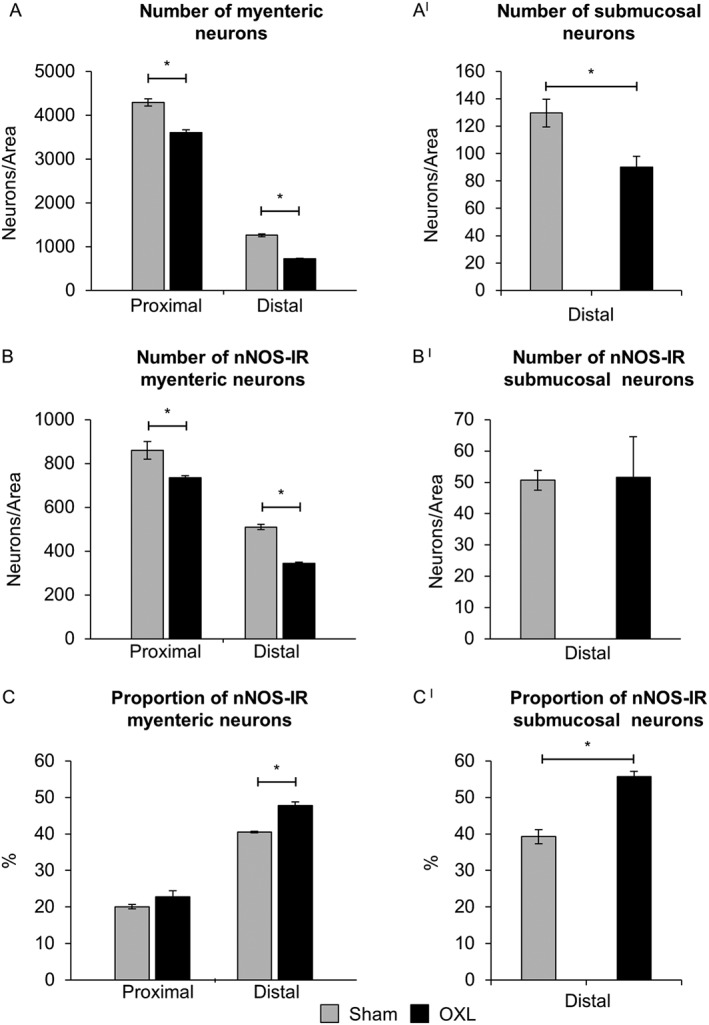
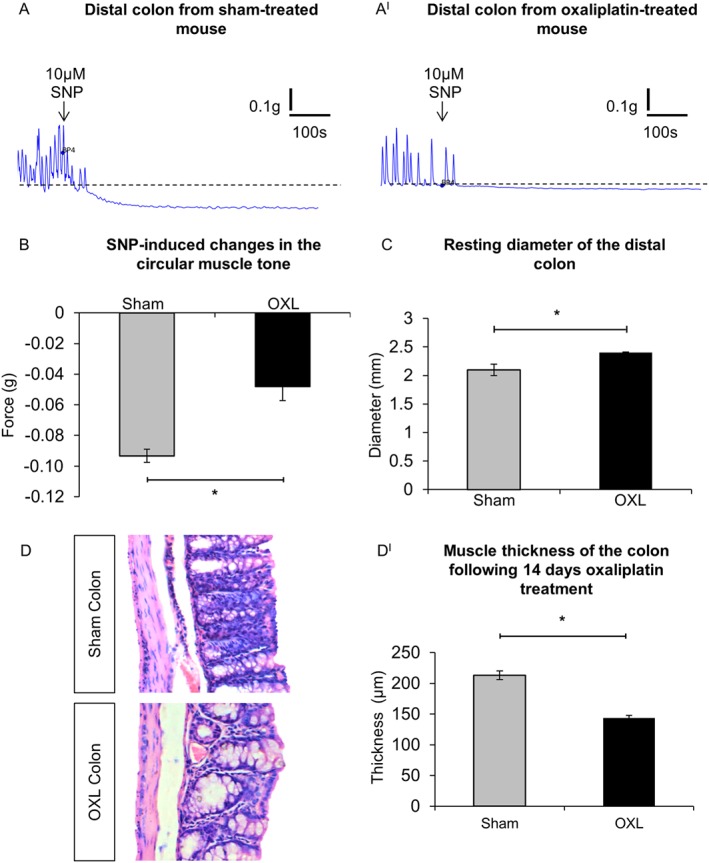
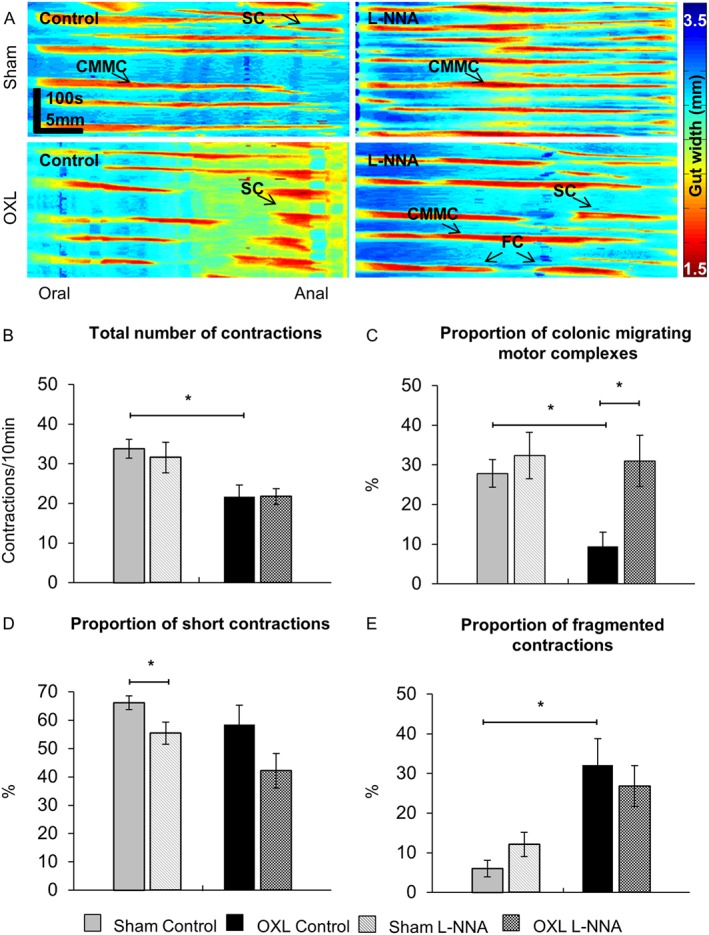
Experimental approach: Oxaliplatin (3 mg·kg-1 per day) was administered in vivo to Balb/c mice intraperitoneally three times a week. The distal colon was collected at day 14 of treatment. Immunohistochemistry was performed in wholemount preparations of submucosal and myenteric ganglia. Neuromuscular transmission was studied by intracellular electrophysiology. Circular muscle tone was studied by force transducers. Colon propulsive activity studied in organ bath experiments and faeces were collected to measure water content.

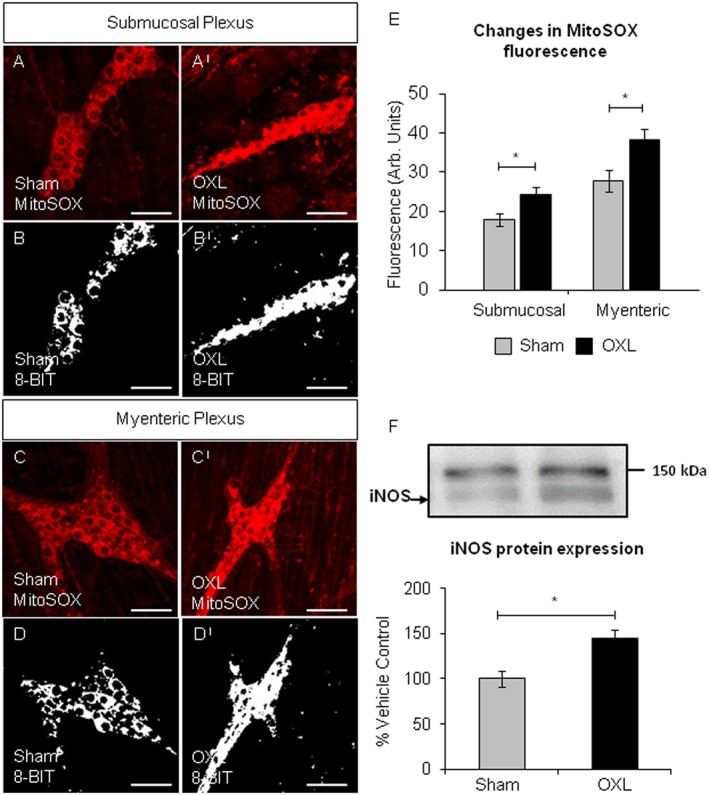
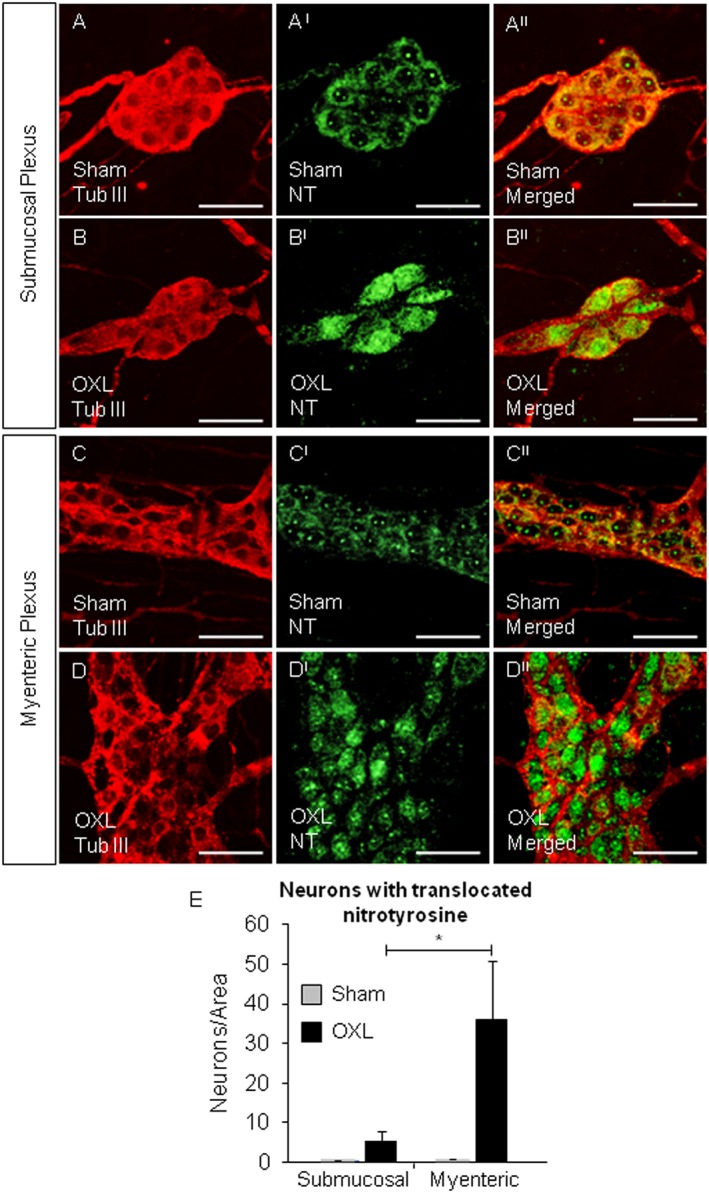
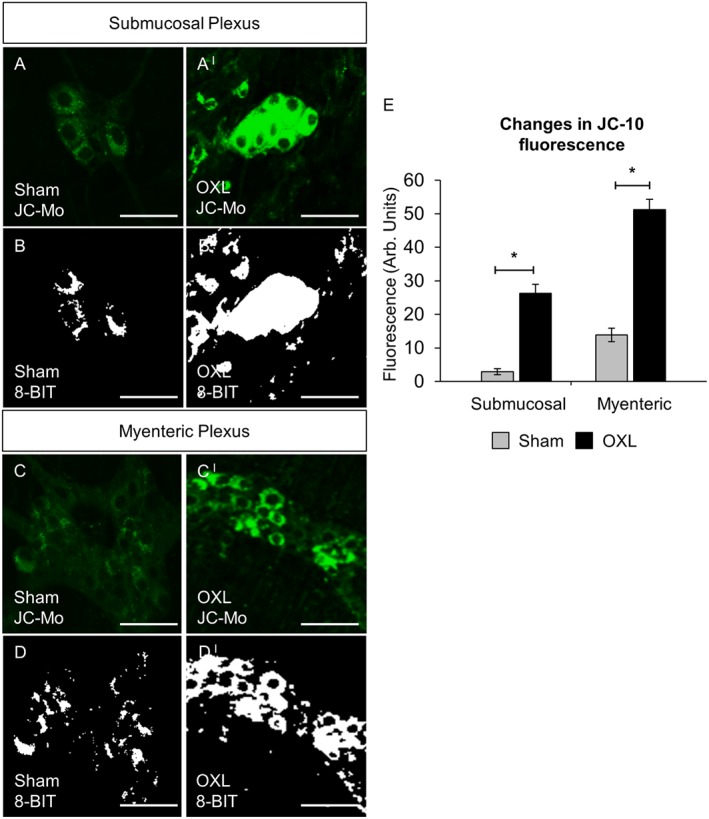
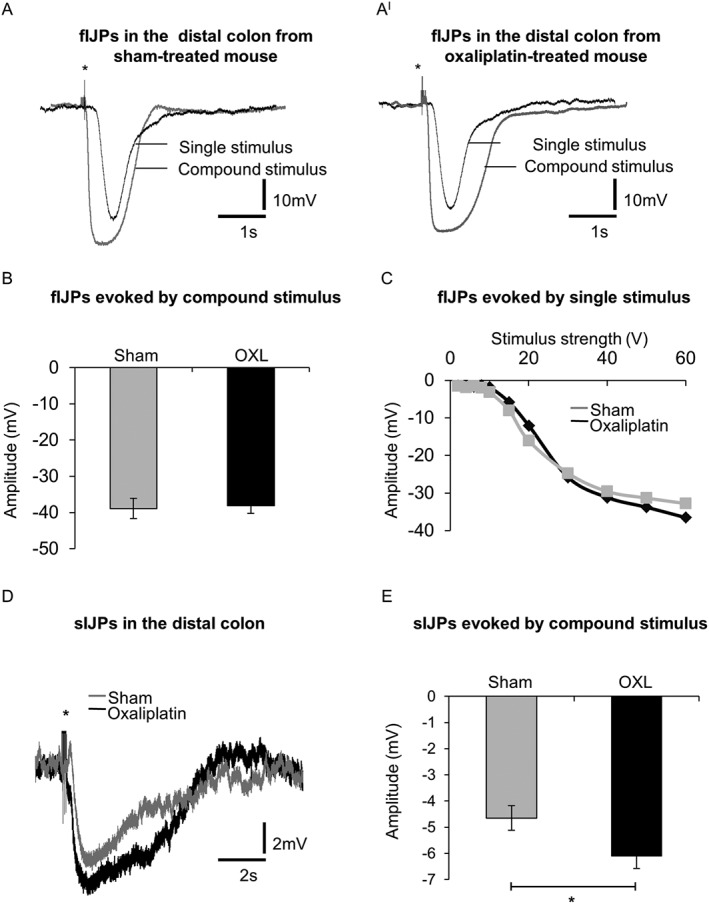
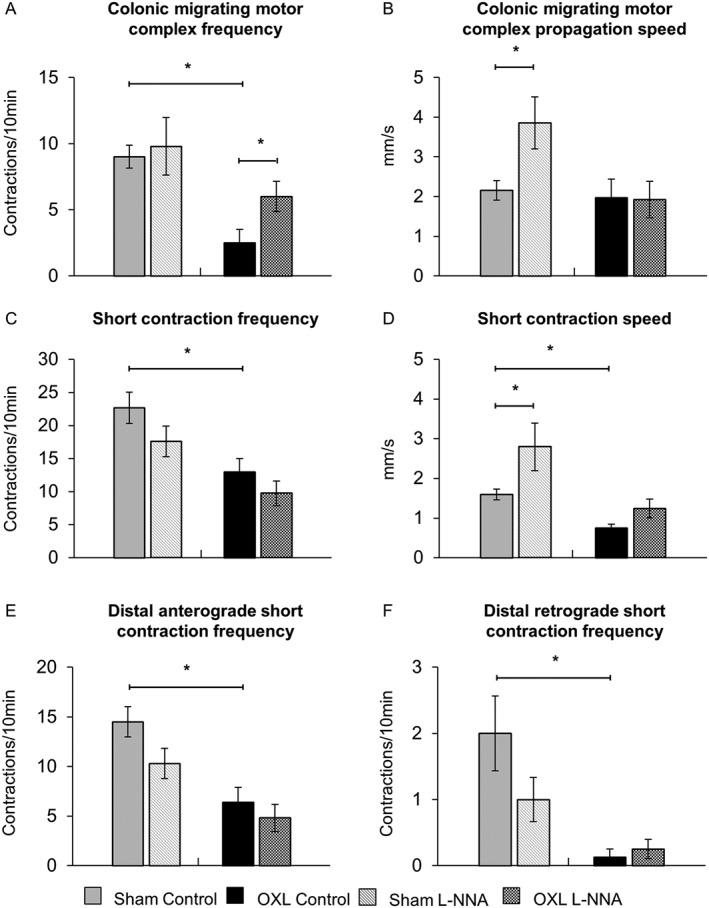
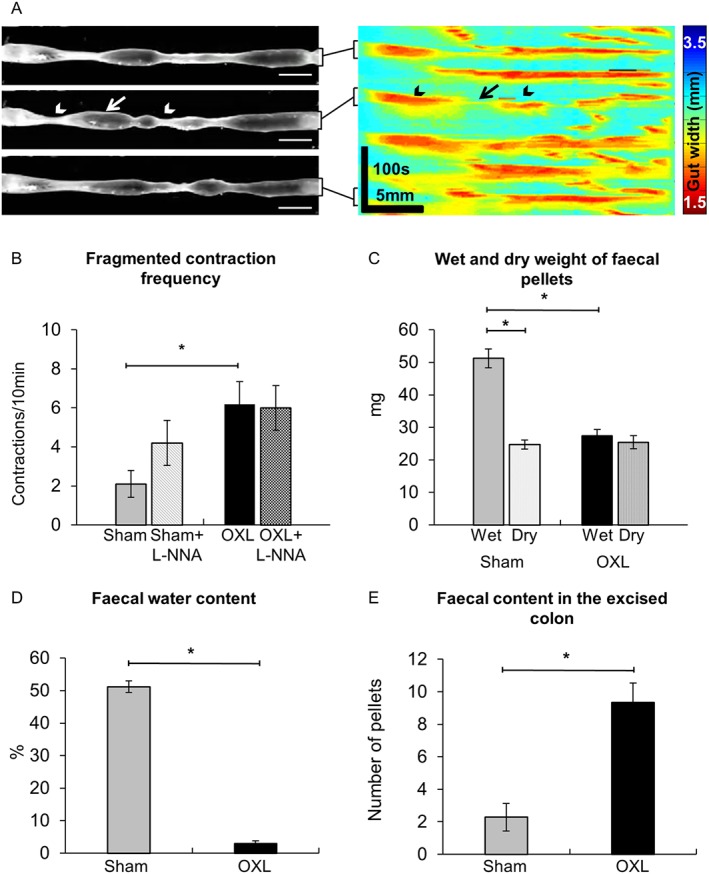
Key results: Chronic in vivo oxaliplatin treatment resulted in increased formation of reactive oxygen species (O2 -), nitration of proteins, mitochondrial membrane depolarisation resulting in the release of cytochrome c, loss of neurons, increased inducible NOS expression and apoptosis in both the submucosal and myenteric plexuses of the colon. Oxaliplatin treatment enhanced NO-mediated inhibitory junction potentials and altered the response of circular muscles to the NO donor, sodium nitroprusside. It also reduced the frequency of colonic migrating motor complexes and decreased circular muscle tone, effects reversed by the NO synthase inhibitor, Nω-Nitro-L-arginine.

Conclusion and implications: Our study is the first to provide evidence that oxidative stress is a key player in enteric neuropathy and colonic dysmotility leading to symptoms of chronic constipation observed in oxaliplatin-treated mice.


Figures

Figure 1
Figure 1
Whole‐mount preparations of myenteric neurons in the proximal and distal colon following 14 days of in vivo oxaliplatin treatment. Myenteric neurons labelled with anti‐β‐tubulin III antibody (Tub III, red) counterstained with DAPI (blue) that labels neuronal nuclei within the ganglion (arrow) and smooth muscle cell nuclei outside the ganglion (arrowhead) (CI). nNOS‐IR neurons (green). Scale bar = 20 μm.
Figure 2
Figure 2
Effect of in vivo oxaliplatin treatment on total number of neurons and average number and proportion of nNOS‐IR enteric neurons. Average number of myenteric neurons in the proximal and distal colon and submucosal neurons was counted per 2 mm2 in the distal colon from day 14 sham and oxaliplatin‐treated mice (A,AI). Average number of nNOS‐IR neurons (B,BI) in myenteric and submucosal ganglia counted within 2 mm2 area. Proportion of nNOS‐IR neurons to the total number of myenteric and submucosal neurons (C,CI). Data presented as mean ± SEM. *P < 0.05, significantly different as indicated; n = 6 mice per group per time point.
Figure 3
Figure 3
Mitochondrial superoxide in the colonic submucosal and myenteric ganglia and iNOS protein expression. Fluorescent and binary images of wholemount preparations of submucosal (A,AI and B,BI) and myenteric (C,CI and D,DI) ganglia labelled with MitoSOX™ Red in the colons from day 14 sham and oxaliplatin‐treated mice. Scale bar = 50 μm. (E) Quantification of the levels of mitochondrial superoxide production visualized by fluorescent probe in submucosal and myenteric ganglia in colonic preparations from day 14 sham and oxaliplatin‐treated animals. *P < 0.05, significantly different as indicated; n = 6 mice per group. (F) Representative images and quantification of the Western blot analysis for iNOS in LMMP tissue from day 14 sham and oxaliplatin‐treated mice. iNOS protein was normalized to total protein values obtained from the Coomassie Blue membrane staining (see Methods section). All values are expressed as a percentage of the values obtained from sham‐treated mice. Data presented as mean ± SEM. *P < 0.05, significantly different as indicated; n = 5 mice per group.
Figure 4
Figure 4
Translocation of nitrotyrosine to the nuclei of submucosal and myenteric neurons. Whole‐mount preparations of colonic submucosal ganglia from day 14 sham (A–AII) and oxaliplatin‐treated (B–BII) mice and myenteric ganglia from sham (C–CII) and oxaliplatin‐treated (D–DII) mice. Scale bar = 50 μm. Neurons and ganglia were labelled with anti‐β‐tubulin III antibody (Tub III, red). Nitrotyrosine within the ganglia was labelled with anti‐nitrotyrosine antibody (NT, green). *P < 0.05, significantly different as indicated; n = 6 mice per group.
Figure 5
Figure 5
Changes in neuronal mitochondrial membrane potential indicative of cytochrome c release in submucosal and myenteric plexuses. Fluorescent and binary wholemount preparations of submucosal (A,AI and B,BI) and myenteric (C,CI and D,DI) ganglia labelled with JC‐10 dye in the colons from day 14 sham and oxaliplatin‐treated mice. Green fluorescent colour (JC monomeric form) is due to the JC‐10‐labelled release of cytochrome c diffusing out of the mitochondria as a result of mitochondrial depolarisation and increased permeability. Scale bar = 50 μm. (E) Quantification of the levels of monomeric JC‐10 production visualized by fluorescent probe in submucosal and myenteric ganglia in colonic preparations from sham and oxaliplatin‐treated animals. *P < 0.05, significantly different as indicated; n = 6 mice per group.
Figure 6
Figure 6
Intracellular recordings of fast and sIJPs from colonic smooth muscle cells. Single pulse electrical stimulus (40 V, 0.4 ms duration) and high frequency compound stimulus (20 V, 0.04 ms interval, 0.4 ms duration) evoked fIJPs in smooth muscle cells from day 14 sham (A) and oxaliplatin‐treated (AI) mice (* stimulus artefact). (B) The mean amplitude of fIJPs in response to compound stimuli from smooth muscle cells of sham and oxaliplatin‐treated mice (n = 4 mice/group). (C) Amplitudes of fIJPs to increasing strength of the electrical stimuli (2–60 V) in smooth muscle cells of sham and oxaliplatin‐treated mice. (D) Blocking fIJPs with a selective antagonist of P2Y1 receptors, MRS2500 (1 μM) revealed sIJPs in smooth muscle cells from both sham and oxaliplatin‐treated mice. (E) Comparison of the amplitude of sIJPs in smooth muscle cells from sham and oxaliplatin‐treated mice. Data presented as mean ± SEM. *P < 0.05, significantly different as indicated; n = 6 mice per group.
Figure 7
Figure 7
Effects of oxaliplatin treatment on colonic smooth muscles. (A,AI) Smooth muscle relaxation following application of the NO donor, SNP (10 μM) to the colon from day 14 sham (A) and oxaliplatin‐treated (AI) mice. (B) Comparison of the maximum relaxation produced by circular muscles in response to SNP in colonic preparations from sham and oxaliplatin‐treated mice quantified as an absolute change in the force transduction from the basal values. *P < 0.05, significantly different as indicated; n = 6 mice per group. (C) Resting diameter of the distal colon from sham and oxaliplatin‐treated mice. *P = 0.05, significantly different as indicated; n = 7 mice per group. (D) Gross morphological changes in the colon following repeated in vivo oxaliplatin administration. Colonic crypt length was shorter in oxaliplatin‐treated mice and muscle thickness was reduced in comparison to the sham‐treated animals. (DI) Statistical analysis of the muscle layer thickness in the colon preparations from sham and oxaliplatin‐treated mice. Data presented as mean ± SEM. *P < 0.05, significantly different as indicated; n = 6 mice per group, 10 sections per preparation from each animal.
Figure 8
Figure 8
Total number of contractions and proportion of different types of contractile activity in the colon before and after application of L‐NNA. (A) Examples of spatiotemporal maps generated from digital video recordings of colonic motility from day 14 sham and oxaliplatin‐treated mice before (control) and after addition of L‐NNA. Each contraction can be seen as a reduction in the gut width (red), while relaxation as an increase in the gut width (blue). CMMCs propagate >50% of the colon length, short contractions (SCs) propagate <50% of the colon length and fragmented contractions (FCs) are interrupted by period(s) of relaxation during contraction. (B) The total number of contractions including all types of contractile activity in the colons from sham and oxaliplatin‐treated mice. The proportion of CMMCs (C), short contractions (D) and fragmented contractions (E) to the total number of contractions was calculated in maps from sham‐treated and oxaliplatin‐treated mice before and after addition of L‐NNA. Data are presented as an average of contractions per 10 min from a total of 40 min of video recording at baseline intraluminal pressure prior to and after the addition of L‐NNA. Data presented as mean ± SEM. *P < 0.05, significantly different as indicated; n = 10 mice per group.
Figure 9
Figure 9
Effects of L‐NNA on CMMCs and short contractions. (A) The frequencies of CMMCs quantified in spatiotemporal maps from sham‐treated and oxaliplatin‐treated mice before and after L‐NNA application. (B) Speed of CMMCs in the colons from sham and oxaliplatin‐treated mice in both test conditions. *P < 0.05, significantly different as indicated; n = 10 mice per group. (C) The frequencies of short contractions were quantified in spatiotemporal maps from sham and oxaliplatin‐treated mice before and after L‐NNA application. (D) Speed of all short contractions analysed before and after L‐NNA application. Changes in the frequency of distal anterograde (E) and retrograde (F) short contractions in the colons from sham and oxaliplatin‐treated mice in both test conditions. Data presented as mean ± SEM. *P < 0.05, significantly different as indicated; n = 10 mice per group).
Figure 10
Figure 10
Effects of L‐NNA on fragmented contractions and colonic faecal content. (A) Fragmented contractions were defined as interrupted contractions consisting of period(s) of relaxation (arrow) and simultaneously occurring contractions (arrowheads). The frequency (B) of fragmented contractions in the colon from sham and oxaliplatin‐treated mice before and after L‐NNA application. (C) Wet weight of faecal pellets measured immediately upon pellet expulsion; dry weight of faecal pellets measured after 72 h of dehydration at room temperature. (D) Faecal water content calculated as the difference between the wet weight and dry weight. (E) Total number of faecal pellets along the entire length of the colon counted in freshly excised intact colons. Data presented as mean ± SEM. *P < 0.05, significantly different as indicated; n = 10 mice per group.

References

    1. Alexander SPH, Davenport AP, Kelly E, Marrion N, Peters JA, Benson HE et al. (2015a). The Concise Guide to PHARMACOLOGY 2015/16: G Protein‐Coupled Receptors. Br J Pharmacol 172: 5744–5869. - PMC - PubMed
    1. Alexander SPH, Fabbro D, Kelly E, Marrion N, Peters JA, Benson HE et al. (2015b). The Concise Guide to PHARMACOLOGY 2015/16: Enzymes. Br J Pharmacol 172: 6024–6109. - PMC - PubMed
    1. André T, Boni C, Mounedji‐Boudiaf L, Navarro M, Tabernero J, Hickish T et al. (2004). Oxaliplatin, fluorouracil, and leucovorin as adjuvant treatment for colon cancer. N Engl J Med 350: 2343–2351. - PubMed
    1. Areti A, Yerra VG, Naidu V, Kumar A (2014). Oxidative stress and nerve damage: role in chemotherapy induced peripheral neuropathy. Redox Biol 2: 289–295. - PMC - PubMed
    1. Beckman JS, Koppenol WH (1996). Nitric oxide, superoxide, and peroxynitrite: the good, the bad, and ugly. Am J Physiol 271: C1424–C1437. - PubMed

MeSH terms