. 2016 Oct 3;16(1):539.
doi: 10.1186/s12913-016-1749-z.

International changes in end-of-life practices over time: a systematic review

Collaborators, Affiliations

International changes in end-of-life practices over time: a systematic review

Yi-Sheng Chao et al. BMC Health Serv Res. .

Abstract

Background: End-of-life policies are hotly debated in many countries, with international evidence frequently used to support or oppose legal reforms. Existing reviews are limited by their focus on specific practices or selected jurisdictions. The objective is to review international time trends in end-of-life practices.

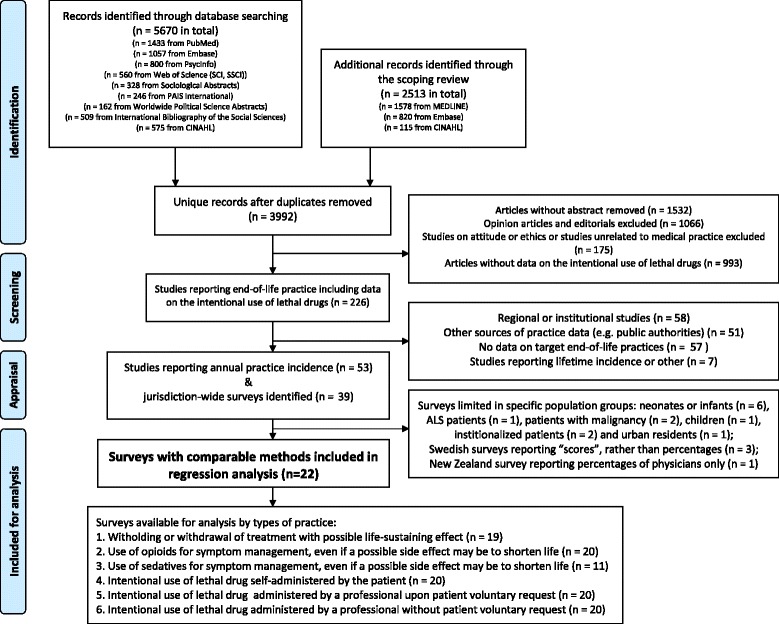
Methods: We conducted a systematic review of empirical studies on medical end-of-life practices, including treatment withdrawal, the use of drugs for symptom management, and the intentional use of lethal drugs. A search strategy was conducted in MEDLINE, EMBASE, Web of Science, Sociological Abstracts, PAIS International, Worldwide Political Science Abstracts, International Bibliography of the Social Sciences and CINAHL. We included studies that described physicians' actual practices and estimated annual frequency at the jurisdictional level. End-of-life practice frequencies were analyzed for variations over time, using logit regression.

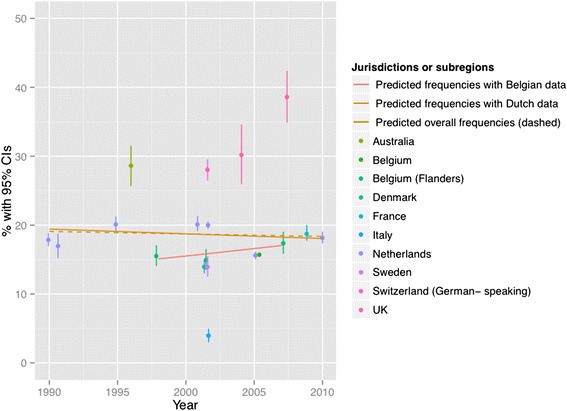
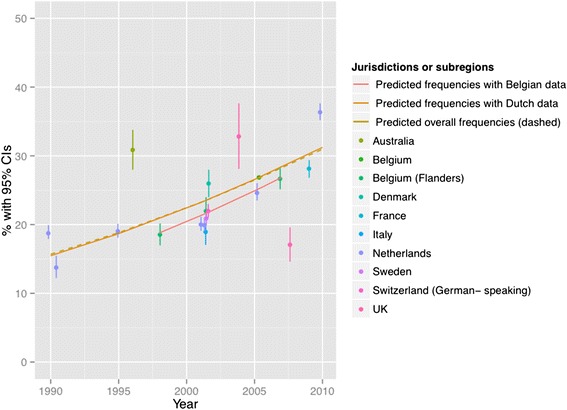
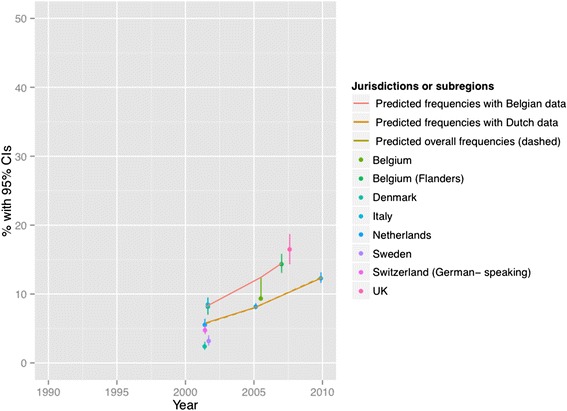
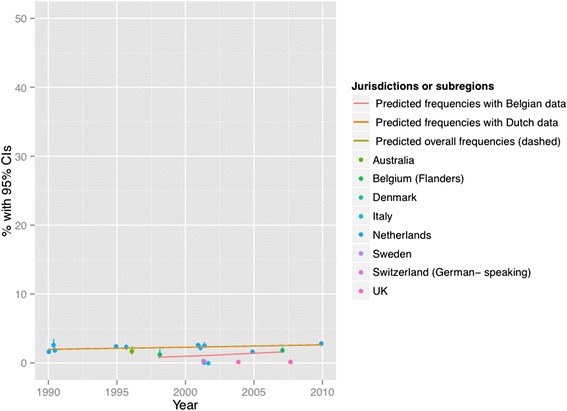
Results: Among 8183 references, 39 jurisdiction-wide surveys conducted between 1990 and 2010 were identified. Of those, 22 surveys used sufficiently similar research methods to allow further statistical analysis. Significant differences were found across surveys in the frequency of treatment withdrawal, use of opiates or sedatives and the intentional use of lethal drugs (X 2 > 1000, p < 0.001 for all). Regression analyses showed increased use of opiates and sedatives over time (p < 0.001), which could reflect more intense symptom management at the end of life, or increase in these drugs to intentionally cause patients' death.

Conclusion: The use of opiates and sedatives appears to have significantly increased over time between 1990 and 2010. Better distinction between practices with different legal status is required to properly interpret the policy significance of these changes. Research on the effects of public policies should take a comprehensive look at trends in end-of-life practice patterns and their associations with policy changes.

Keywords: Aid in dying; Assisted suicide; End-of-life practice; Euthanasia; Treatment withdrawal.


Figures

Fig. 1
Fig. 1
Flowchart of study inclusion and exclusion
Fig. 2
Fig. 2
Withholding or withdrawal of treatment with the potential to prolong life. Note: CI = confidence interval; United Kingdom = UK. X 2 = 36833 (null hypothesis: all frequencies the same); p < 0.001. The coefficient of year = −0.002, p < 0.001 among all surveys; greater than zero suggesting positive changes from 1990 to 2010, lower suggesting the opposite. The coefficient of year = −0.0045, p < 0.001 among Dutch surveys only. The coefficient of year = 0.0161, p < 0.001 among Belgian surveys only. See Appendix 3 for regression coefficients
Fig. 3
Fig. 3
Use of opiates with possible life-shortening effects. Note: See Fig. 2 for abbreviations. X 2 = 37199 (null hypothesis: all frequencies the same), p < 0.001. Thecoefficient of year = 0.0440, p < 0.001 among all surveys; greater than zero suggesting positive changes from 1990 to 2010, lower suggesting the opposite). The coefficient of year = 0.0454, p < 0.001 among Dutch surveys. The coefficient of year = 0.0513, p < 0.001 among Belgian surveys. See Appendix 3 for regression coefficients
Fig. 4
Fig. 4
Use of sedatives with possible life-shortening effects. Note: See Fig. 2 for abbreviations. X 2 = 19410 (null hypothesis: all frequencies the same), p < 0.001. The coefficient of year = 0.1006, p < 0.001 among all surveys; greater than zero suggesting positive changes from 1990 to 2010, lower suggesting the opposite. The coefficient of year = 0.0974, p < 0.001 among Dutch surveys. The coefficient of year = 0.1162, p < 0.001 among Belgian surveys. See Appendix 3 for regression coefficients
Fig. 5
Fig. 5
Intentional use of lethal drugs self-administered by patients. Note: See Fig. 2 for abbreviations. X 2 = 1716 (null hypothesis: all freqiuencies the same), p < 0.001. The coefficient of year = −0.0492, p < 0.001 among all surveys; greater than zero suggesting positive changes from 1990 to 2010, lower suggesting the opposite. The coefficient of year = −0.0442, p < 0.001 among Dutch surveys. The coefficient of year = − 0.2291, p < 0.001 among Belgian surveys. See Appendix 3 for regression coefficients
Fig. 6
Fig. 6
Intentional use of lethal drugs administered by professionals with patient request. Note: See Fig. 2 for abbreviations. X 2 = 8678 (null hypothesis: all frequencies the same), p < 0.001 (simulated). The coefficient of year = 0.0159, p < 0.001 among all surveys; greater than zero suggesting positive changes from 1990 to 2010, lower suggesting the opposite). The coefficient of year = 0.0142, p < 0.001 among Dutch surveys. The coefficient of year = 0.0730, p < 0.001 among Belgian surveys. See Appendix 3 for regression coefficients
Fig. 7
Fig. 7
Intentional use of lethal drugs administered by professionals without patient request. Note: See Fig. 2 for abbreviations. X 2 = 17372 (null hypothesis: all frequencies the same), p < 0.001 (simulated). The coefficient of year = −0.0574, p < 0.001 among all surveys; greater than zero suggesting positive changes from 1990 to 2010, lower suggesting the opposite). The coefficient of year = −0.0496, p < 0.001 among Dutch surveys. The coefficient of year = −0.0924, p < 0.001 among Belgian surveys. See Appendix 3 for regression coefficients

References

    1. Downar J, Boisvert M, Smith D. Data to support assisted dying. BMJ. 2014;349(349):g4966. doi: 10.1136/bmj.g4966. - DOI - PubMed
    1. McIlroy GE. Some data on assisted dying from Oregon are worrying. BMJ. 2014;349(349):g4961. doi: 10.1136/bmj.g4961. - DOI - PubMed
    1. Suarez-Almazor ME, Belzile M, Bruera E. Euthanasia and physician-assisted suicide: a comparative survey of physicians, terminally ill cancer patients, and the general population. J Clin Oncol. 1997;15(2):418–427. - PubMed
    1. Delamothe T, Snow R, Godlee F. Why the Assisted Dying Bill should become law in England and Wales. BMJ. 2014;349(349):g4349. doi: 10.1136/bmj.g4349. - DOI - PubMed
    1. Nicol J, Tiedemann M, Valiquet D. Euthanasia and Assisted Suicide: International Experiences, Parliamentary Information and Research Service, Editor. Ottawa: Library of Parliament; 2013.

Publication types

LinkOut - more resources