. 2016 Oct 4;15(1):35.
doi: 10.1186/s12942-016-0065-5.

Characterizing physical activity and food urban environments: a GIS-based multicomponent proposal

Affiliations

Characterizing physical activity and food urban environments: a GIS-based multicomponent proposal

Alba Cebrecos et al. Int J Health Geogr. .

Abstract

Background: Healthier urban environments influence the distribution of cardiovascular risk factors. Our aim was to design and implement a multicomponent method based on Geographic Information Systems to characterize and evaluate environmental correlates of obesity: the food and the physical activity urban environments.

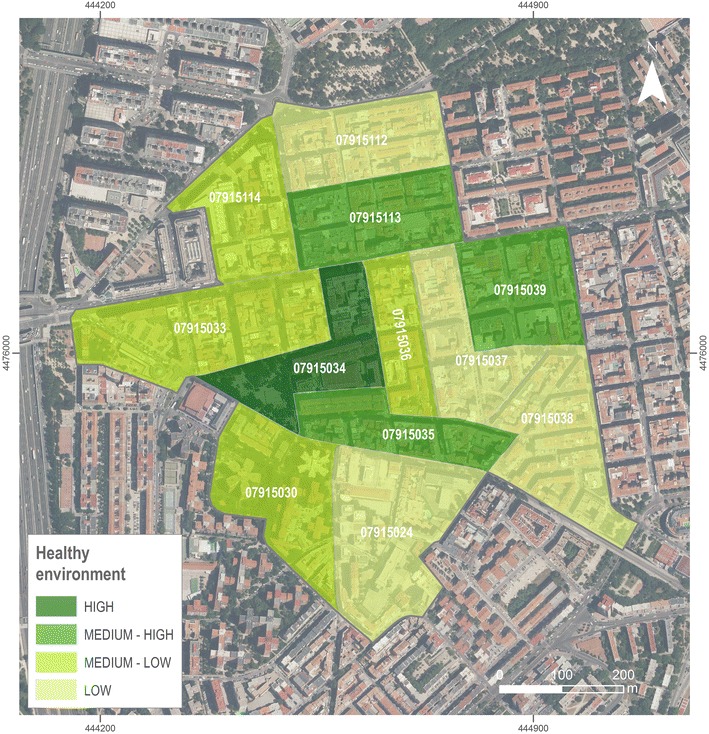
Methods: Study location comprised a socio-demographically average urban area of 12 contiguous census sections (≈16,000 residents), in Madrid, Spain. We conducted on-field audits on all food stores and street segments. We designed a synthetic index integrating continuous measures of both environments, by kernel density analyses. Index ranges from 0 to 100 (least-most healthy).

Results: We found a heterogeneous distribution with 75 and 50 % of the area scoring less than 36.8 and 25.5, respectively. Census sections of study area were categorized by Jenks intervals as high, medium-high, medium-low and low. 41.0 % of residents lived in an area with a low score, 23.6 % medium-low and 31.1 % medium-high and 4.2 % in a high.

Conclusion: The proposed synthetic index may be a relevant tool to inform urban health interventions, providing a feasible way to integrate different measures of barriers and facilitators of healthy urban environments in terms of food and physical activity.

Keywords: Geographic Information Systems; Healthy food availability; Obesogenic environments; Physical activity; Synthetic index.


Figures

Fig. 1
Fig. 1
Map of study area. Colored areas represent census sections within the pilot study area
Fig. 2
Fig. 2
GIS model for the construction of a spatial integrated index on walkability and food environment. Kernel interpolation of the Healthy Food Availability index (HFAI) was created with data from direct observation of food stores measured with the Nutrition Environment Measurement Surveys in Stores (NEMS-S) audit tool. Kernel interpolation of walkability was created with data from direct observation of each street segment measured with the Madrid Pedestrian and Cycling Environment Scan (M-SPACES) audit tool
Fig. 3
Fig. 3
Development of continuous KDE variables from direct observation data. On the left, is depicts the calculating for the food environment starting with the location of all stores, continues with the Healthy Food Availability Index (HFAI) score for each one, and the next is the KDE surface weighted by HFAI score. On the right, the development for the physical activity environment. Above the location of all the street segments, continues with Pedestrian and Cycling Environment Scan (SPACES) score by each one. And in front the KDE weighted by the SPACES
Fig. 4
Fig. 4
Continuous synthetic index surface. This surface is the local average of the pixels of walkability KDE and the pixels of food availability KDE. The size of pixel is 3 × 3 m and the bandwidth selected to the smoothing was 100 meters
Fig. 5
Fig. 5
Histogram of synthetic index surface. It depicts the frequency of pixel values of the study area with a range from 0 to 100 with higher scores indicating a healthier environment
Fig. 6
Fig. 6
Study area characterization at census section level. Is the result of zonal analysis of each administrative area having in account all the pixels of the local analysis within each area

References

    1. WHO. The European health report 2015. Targets and beyond—reaching new frontiers in evidence. W.H.O.R.O.f. Europe, Editor 2015. p. 18.
    1. Lake A, Townshend T. Obesogenic environments: exploring the built and food environments. J R Soc Promot Health. 2006;126(6):262–267. doi: 10.1177/1466424006070487. - DOI - PubMed
    1. Link B, Phelan J. Social conditions as fundamental causes of disease. J Health Soc Behav. 1995;35:80–94. doi: 10.2307/2626958. - DOI - PubMed
    1. Rose G. Sick individuals and sick populations. Int J Epidemiol. 1985;14(1):32–38. doi: 10.1093/ije/14.1.32. - DOI - PubMed
    1. Diez Roux A. Neighborhoods and health: where are we and were do we go from here? Rev Epidémiol Santé Publique. 2007;55(1):13–21. doi: 10.1016/j.respe.2006.12.003. - DOI - PMC - PubMed