. 2016 Oct 6;9(1):532.
doi: 10.1186/s13071-016-1807-8.

Toll-like receptor 2 (TLR2) plays a role in controlling cutaneous leishmaniasis in vivo, but does not require activation by parasite lipophosphoglycan

Affiliations

Toll-like receptor 2 (TLR2) plays a role in controlling cutaneous leishmaniasis in vivo, but does not require activation by parasite lipophosphoglycan

Alice Halliday et al. Parasit Vectors. .

Abstract

Background: Leishmaniasis is a neglected tropical disease affecting millions of individuals worldwide. Despite several studies reporting involvement of the innate immune receptor Toll-like receptor 2 (TLR2) in the recognition of surface glycolipids from Leishmania parasites in vitro, the role of TLR2 and its co-receptors during cutaneous leishmaniasis infection in vivo is unknown.

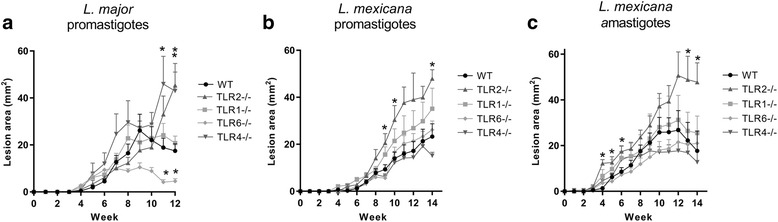
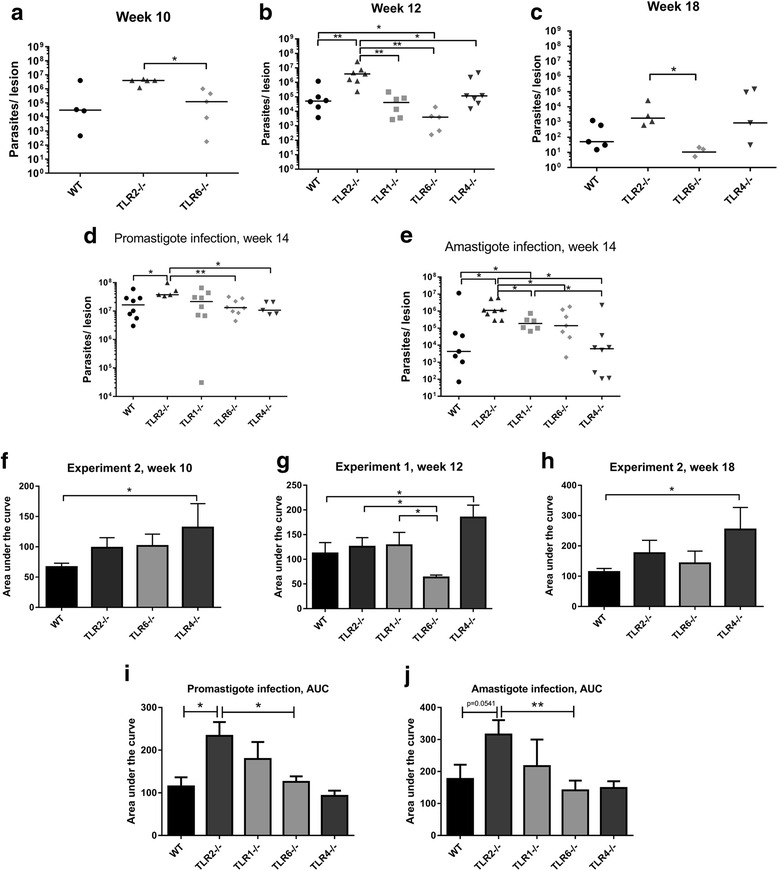
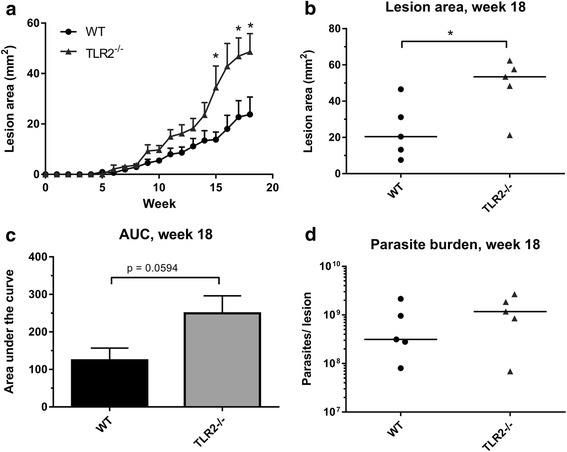
Methods: To explore the role of TLR2 and its co-receptors in cutaneous leishmaniasis, mice deficient in either TLR2, 4, 1 or 6, or wild-type (WT) controls, were infected with either Leishmania major promastigotes, L. mexicana promastigotes, L. mexicana amastigotes, or LPG1 -/- L. mexicana promastigotes. For each infection, lesion sizes were monitored and parasite burden was assessed at various time points. To assess immune responses, draining lymph node (DLN) cells were re-stimulated with parasite antigens and the production of cytokines and parasite-specific antibody isotypes in blood was determined by ELISA.

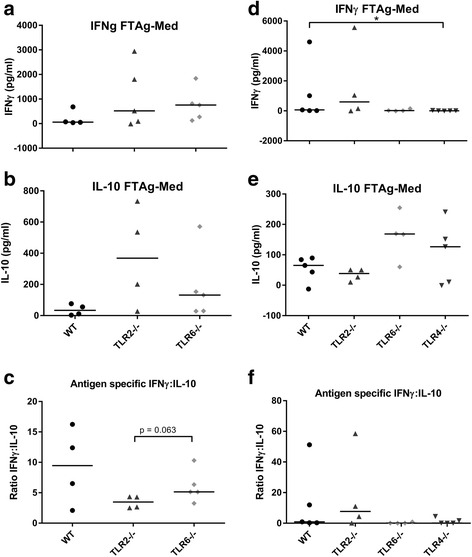
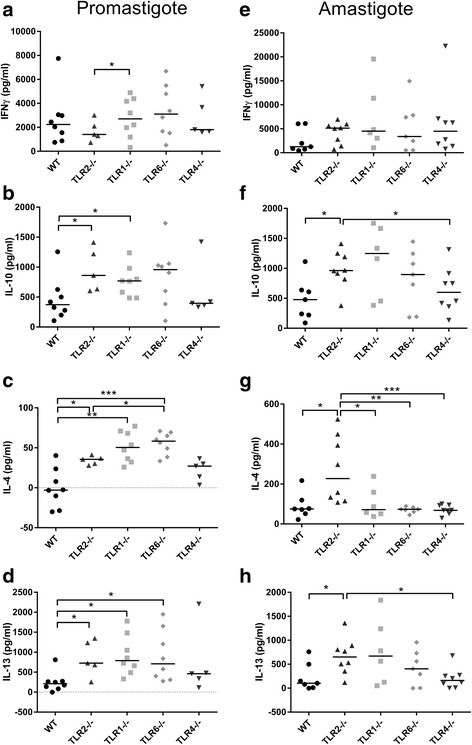
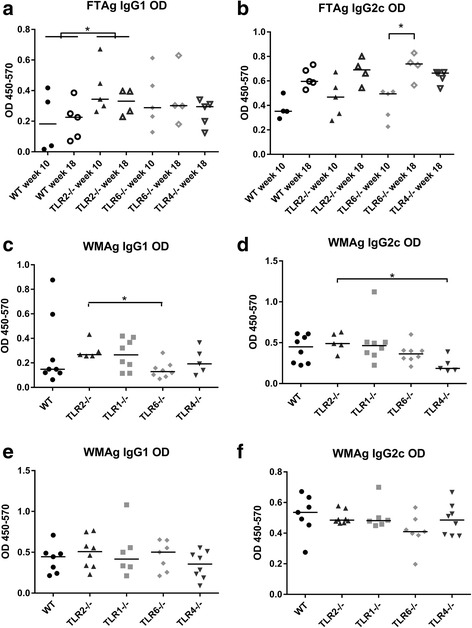
Results: Mice deficient in TLR2 and TLR4 presented with larger lesions and higher parasite burdens than WT controls. Mice lacking TLR2 co-receptors TLR1 or TLR6 did not show exacerbated infection, suggesting that TLR2 does not require either co-receptor in the recognition of Leishmania infection. Furthermore, it appears that lipophosphoglycan (LPG) is not the major mediator of TLR2 activation during infection with L. mexicana, as parasites lacking LPG (axenic amastigotes and LPG1 -/- promastigotes) also resulted in exacerbated disease in TLR2-/- mice. Infected TLR2-/- mice show a skewed Th2 immune response to Leishmania parasites, as demonstrated by elevated IL-4, IL-13 and IL-10 production by DLN cells from L. mexicana infected mice in response to antigen. Furthermore, L. major infected TLR2-/- mice have elevated antigen-specific IgG1 antibodies.

Conclusions: TLR2 deficiency leads to exacerbation of disease and parasite burden through promotion of Th2 immunity. TLR2 activation in vivo occurs independently of parasite LPG, suggesting other parasite ligands are involved in TLR2 recognition of Leishmania.

Keywords: Leishmania major; Leishmania mexicana; Lipophosphoglycan; TLR2.


Figures

Fig. 1
Fig. 1
Lesion development in WT and TLR−/− mice upon infection with L. major or L. mexicana. Either 105 L. major promastigotes (a), or L. mexicana promastigotes (b) or amastigotes (c) were used to infect WT, TLR2−/−, TLR1−/−, TLR6−/− and TLR4−/− mice (n = 4–9) subcutaneously; mice were monitored every week for the appearance and size of lesions. The mean lesion size (mm2) + standard error for each genotype is shown at each weekly time point post-infection, for experiments ending between 12 and 14 weeks. For the L. major infection, the data presented is representative of two experiments. Knockout stains were compared to WT mice using the Mann-Whitney U test, where P < 0.05 was considered to indicate significant (*) differences
Fig. 2
Fig. 2
Parasite burden and area under the curve (AUC) analysis. Parasite burden and area under the curve data was calculated for WT and TLR−/− mice infected with either L. major (a, b, c, f, g, h) or L. mexicana promastigotes (d, i) or amastigotes (e, j) at various time points post-infection. At the time points indicated, experiments were ended and the lesion tissue from infected mice was collected for quantification of the parasite burden using qPCR. The individual parasite burden levels are shown for L. major (a, b, c) as well as L. mexicana promastigote (d) and amastigote (e) infections, with the median average for each group shown. The lesion size data for each experiment can be summarized by calculating the AUC for each mouse at the end of the experiment; the data are presented in f, g, h for L. major and i, j for L. mexicana. The mean average for each group is represented by the bars, + SEM. Groups were compared using a Mann-Whitney U test where P < 0.05 was considered to indicate significant (*) differences
Fig. 3
Fig. 3
Infection of WT and TLR2−/− mice with L. mexicana LPG1 −/− promastigote parasites. WT and TLR2−/− mice were infected with 105 L. mexicana LPG1 −/− parasites, and the disease was monitored by measuring the lesions every week for 18 weeks (n = 5). The average lesion size (mm2) + standard error (SEM) are displayed for both groups at all time points post-infection (a), and at the end of the experiment (week 18, b). The AUC was calculated for each mouse after the 18 weeks, the average is displayed (+SEM) in the bar chart in (c). The parasite burden in the lesion tissue was determined by qPCR, and individual burdens and median averages are displayed in (d). Groups were compared using a Mann-Whitney U test where P < 0.05 was considered to indicate significant (*) differences
Fig. 4
Fig. 4
Antigen-specific cytokine production by DLNs in L. major infection in WT and TLR−/− mice. WT, TLR2−/− and TLR6−/− mice were infected with L. major parasites and left to develop lesions for either 10 (a, b, c) or 18 weeks (d, e, f). For the long term experiment, TLR4−/− mice were also included (d, e, f). At the end of the experiment, DLN were removed and the cells were re-stimulated for 72 h in vitro with the Leishmania antigen FTAg. The supernatants were collected and analysed for the presence of the cytokines IFNγ (a, d) and IL-10 (b, e) using ELISA. The quantities of cytokine produced in response to FTAg is shown for each individual, along with the median values. The ratio of IFNγ:IL-10 was also calculated for each individual and is displayed in c (week 10) and f (week 18). Groups were compared using a Mann-Whitney U test where P < 0.05 was considered to indicate significant (*) differences
Fig. 5
Fig. 5
Antigen-specific cytokine production in L. mexicana infected WT and TLR−/− mice. WT, TLR2−/−, TLR1−/−, TLR6−/− and TLR4−/− mice were infected with L. mexicana parasites (promastigotes a, b, c, d, amastigotes e, f, g, h) and left to develop lesions for 14 weeks. At the end of the experiment, DLN were removed and the cells were re-stimulated for 72 h in vitro with the Leishmania antigen FTAg. The supernatants were collected and analysed for the presence of the cytokines IFNγ, IL-10, IL-4 and IL-13 using ELISA. The quantities of cytokine produced in response to FTAg are shown for each individual, along with the median values for each group. Groups were compared using a Mann-Whitney U test where P < 0.05 (*) and P < 0.01 (**) were considered to indicate significant differences
Fig. 6
Fig. 6
Levels of circulating antigen-specific IgG1 and IgG2c antibodies in infected WT and TLR−/− mice. WT and TLR−/− mice were infected with 105L. major promastigotes (a, b), L. mexicana promastigotes (c, d) or L. mexicana amastigotes (e, f). At the end of each experiment (week 10 or 18 for L. major infection, week 14 for L. mexicana infections), blood was collected from mice via cardiac puncture and the plasma was collected. Levels of antigen-specific antibodies were calculated using antibody ELISA with either L. major FTAg (a, b) or L. mexicana WMAg (c, d, e, f) as the capture antigen. Quantities are displayed as OD values for individual mice, as well as the median value for each group. Groups were compared using a Mann-Whitney U test P < 0.05 (*) and P < 0.01 (**) were considered to indicate significant differences

References

    1. WHO . WHO Technical Report Series. Geneva: WHO; 2010. Control of the leishmaniases: Report of a meeting of the WHO Expert Committee on the control of leishmaniases.
    1. Alvar J, Vélez ID, Bern C, Herrero M, Desjeux P, Cano J, et al. Leishmaniasis worldwide and global estimates of its incidence. PLoS One. 2012;7(5):e35671. doi: 10.1371/journal.pone.0035671. - DOI - PMC - PubMed
    1. Sacks D, Noben-Trauth N. The immunology of susceptibility and resistance to Leishmania major in mice. Nat Rev Immunol. 2002;2(11):845–58. doi: 10.1038/nri933. - DOI - PubMed
    1. Scott P. IFN-gamma modulates the early development of Th1 and Th2 responses in a murine model of cutaneous leishmaniasis. J Immunol. 1991;147(9):3149–55. - PubMed
    1. Park AY, Hondowicz BD, Scott P. IL-12 is required to maintain a Th1 response during Leishmania major infection. J Immunol. 2000;165(2):896–902. doi: 10.4049/jimmunol.165.2.896. - DOI - PubMed

Publication types

MeSH terms