

Altered gut microbiota in female mice with persistent low body weights following removal of post-weaning chronic dietary restriction
- PMID: 27716401
- PMCID: PMC5048651
- DOI: 10.1186/s13073-016-0357-1
Altered gut microbiota in female mice with persistent low body weights following removal of post-weaning chronic dietary restriction
Abstract
Background: Nutritional interventions often fail to prevent growth failure in childhood and adolescent malnutrition and the mechanisms remain unclear. Recent studies revealed altered microbiota in malnourished children and anorexia nervosa. To facilitate mechanistic studies under physiologically relevant conditions, we established a mouse model of growth failure following chronic dietary restriction and examined microbiota in relation to age, diet, body weight, and anabolic treatment.
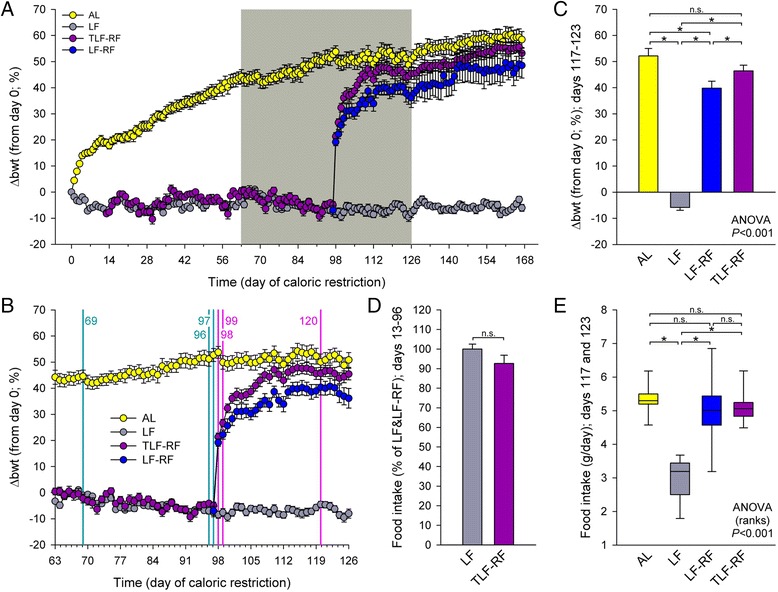
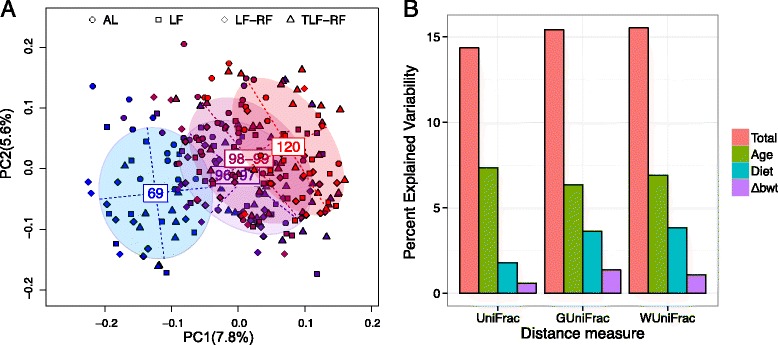
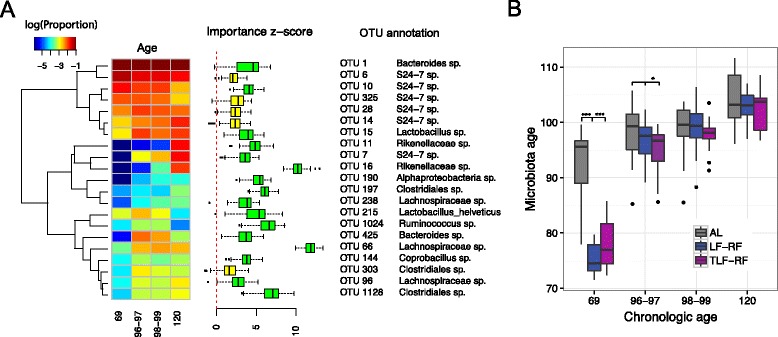
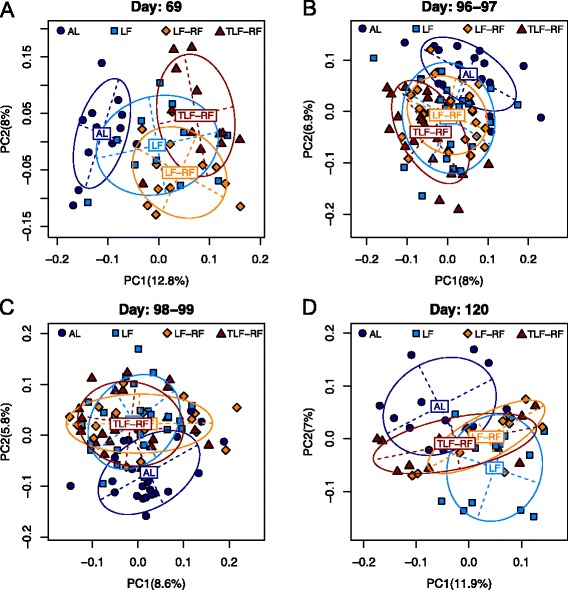
Methods: Four-week-old female BALB/c mice (n = 12/group) were fed ad libitum (AL) or offered limited food to abolish weight gain (LF). A subset of restricted mice was treated with an insulin-like growth factor 1 (IGF1) analog. Food access was restored in a subset of untreated LF (LF-RF) and IGF1-treated LF mice (TLF-RF) on day 97. Gut microbiota were determined on days 69, 96-99 and 120 by next generation sequencing of the V3-5 region of the 16S rRNA gene. Microbiota-host factor associations were analyzed by distance-based PERMANOVA and quantified by the coefficient of determination R2 for age, diet, and normalized body weight change (Δbwt). Microbial taxa on day 120 were compared following fitting with an overdispersed Poisson regression model. The machine learning algorithm Random Forests was used to predict age based on the microbiota.
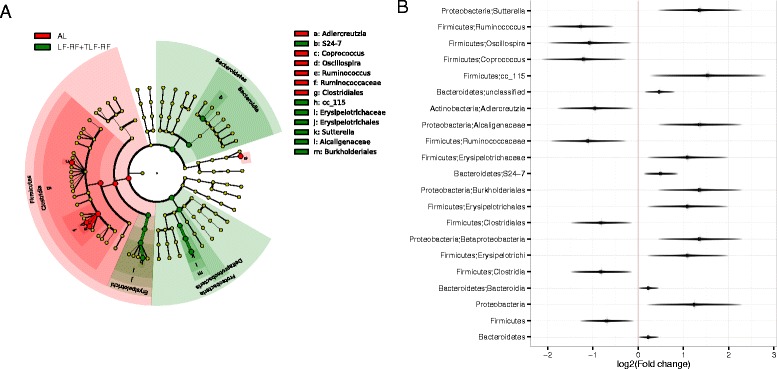
Results: On day 120, Δbwt in AL, LF, LF-RF, and TLF-RF mice was 52 ± 3, -6 ± 1*, 40 ± 3*, and 46 ± 2 % (*, P < 0.05 versus AL). Age and diet, but not Δbwt, were associated with gut microbiota composition. Age explained a larger proportion of the microbiota variability than diet or Δbwt. Random Forests predicted chronological age based on the microbiota and indicated microbiota immaturity in the LF mice before, but not after, refeeding. However, on day 120, the microbiota community structure of LF-RF mice was significantly different from that of both AL and LF mice. IGF1 mitigated the difference from the AL group. Refed groups had a higher abundance of Bacteroidetes and Proteobacteria and a lower abundance of Firmicutes than AL mice.
Conclusions: Persistent growth failure can be induced by 97-day dietary restriction in young female mice and is associated with microbiota changes seen in lean mice and individuals and anorexia nervosa. IGF1 facilitates recovery of body weights and microbiota.
Keywords: Animal model; Anorexia nervosa; Dietary restriction; Gut microbiota; Insulin-like growth factor 1 (IGF1); Machine learning; Protein-energy malnutrition.
Figures
Similar articles
-
Food restriction followed by refeeding with a casein- or whey-based diet differentially affects the gut microbiota of pre-pubertal male rats.J Nutr Biochem. 2018 Jan;51:27-39. doi: 10.1016/j.jnutbio.2017.08.014. Epub 2017 Sep 14. J Nutr Biochem. 2018. PMID: 29091812
-
Gut microbiota alteration in a mouse model of Anorexia Nervosa.Clin Nutr. 2021 Jan;40(1):181-189. doi: 10.1016/j.clnu.2020.05.002. Epub 2020 May 11. Clin Nutr. 2021. PMID: 32460959
-
The Intestinal Microbiota in Acute Anorexia Nervosa and During Renourishment: Relationship to Depression, Anxiety, and Eating Disorder Psychopathology.Psychosom Med. 2015 Nov-Dec;77(9):969-81. doi: 10.1097/PSY.0000000000000247. Psychosom Med. 2015. PMID: 26428446 Free PMC article.
-
Can attention to the intestinal microbiota improve understanding and treatment of anorexia nervosa?Expert Rev Gastroenterol Hepatol. 2016;10(5):565-9. doi: 10.1586/17474124.2016.1166953. Epub 2016 Apr 4. Expert Rev Gastroenterol Hepatol. 2016. PMID: 27003627 Free PMC article. Review.
-
Intestinal microbiota - a key to understanding the pathophysiology of anorexia nervosa?Psychiatr Pol. 2017 Oct 29;51(5):859-870. doi: 10.12740/PP/65308. Epub 2017 Oct 29. Psychiatr Pol. 2017. PMID: 29289966 Review. English, Polish.
Cited by
-
Linking the Gut Microbiota to Bone Health in Anorexia Nervosa.Curr Osteoporos Rep. 2018 Feb;16(1):65-75. doi: 10.1007/s11914-018-0420-5. Curr Osteoporos Rep. 2018. PMID: 29417446 Review.
-
Breeding farm, level of feeding and presence of antibiotics in the feed influence rabbit cecal microbiota.Anim Microbiome. 2020 Nov 2;2(1):40. doi: 10.1186/s42523-020-00059-z. Anim Microbiome. 2020. PMID: 33499975 Free PMC article.
-
Gut microbiome: An intermediary to neurotoxicity.Neurotoxicology. 2019 Dec;75:41-69. doi: 10.1016/j.neuro.2019.08.005. Epub 2019 Aug 24. Neurotoxicology. 2019. PMID: 31454513 Free PMC article. Review.
-
Joining Illumina paired-end reads for classifying phylogenetic marker sequences.BMC Bioinformatics. 2020 Mar 14;21(1):105. doi: 10.1186/s12859-020-3445-6. BMC Bioinformatics. 2020. PMID: 32171248 Free PMC article.
-
Letrozole treatment of adult female mice results in a similar reproductive phenotype but distinct changes in metabolism and the gut microbiome compared to pubertal mice.BMC Microbiol. 2019 Mar 12;19(1):57. doi: 10.1186/s12866-019-1425-7. BMC Microbiol. 2019. PMID: 30871463 Free PMC article.
References
Publication types
MeSH terms
Substances
Grants and funding
LinkOut - more resources
Full Text Sources
Other Literature Sources
Medical
Miscellaneous
