Comparative Study
. 2016 Oct 6;167(2):566-580.e19.
doi: 10.1016/j.cell.2016.09.027.

Molecular Diversity of Midbrain Development in Mouse, Human, and Stem Cells

Affiliations
Comparative Study

Molecular Diversity of Midbrain Development in Mouse, Human, and Stem Cells

Gioele La Manno et al. Cell. .

Abstract

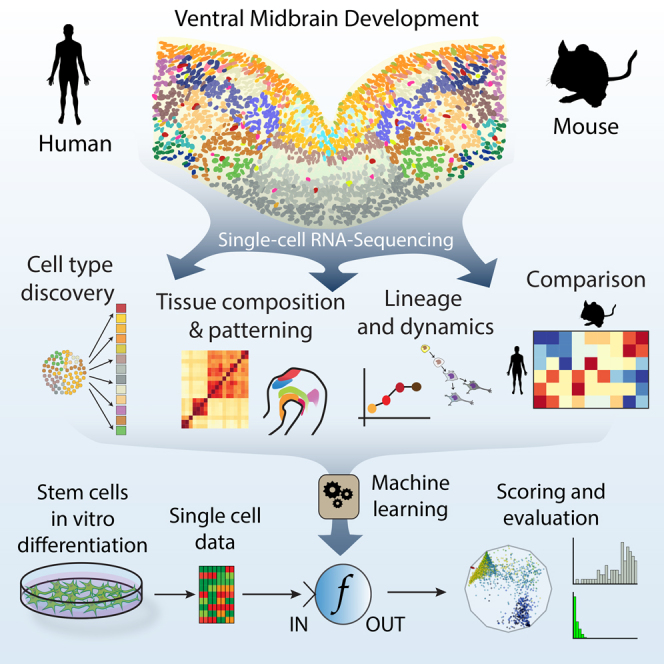
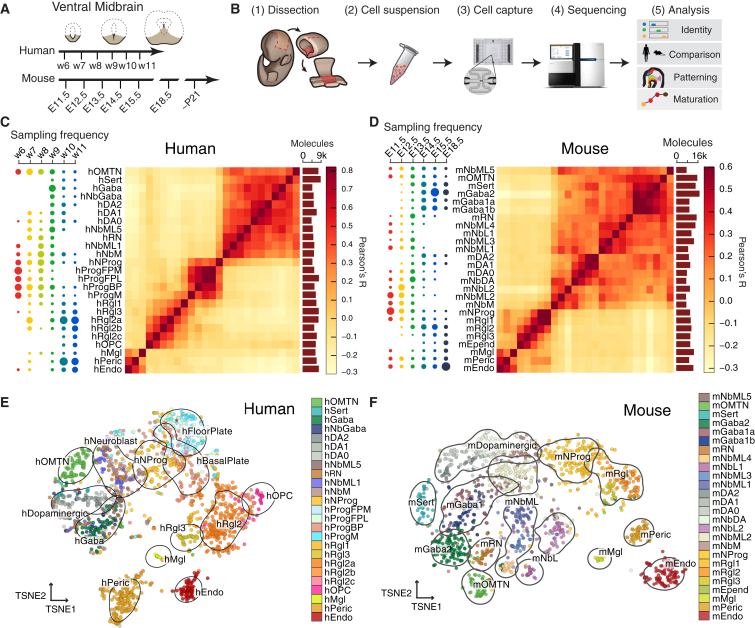
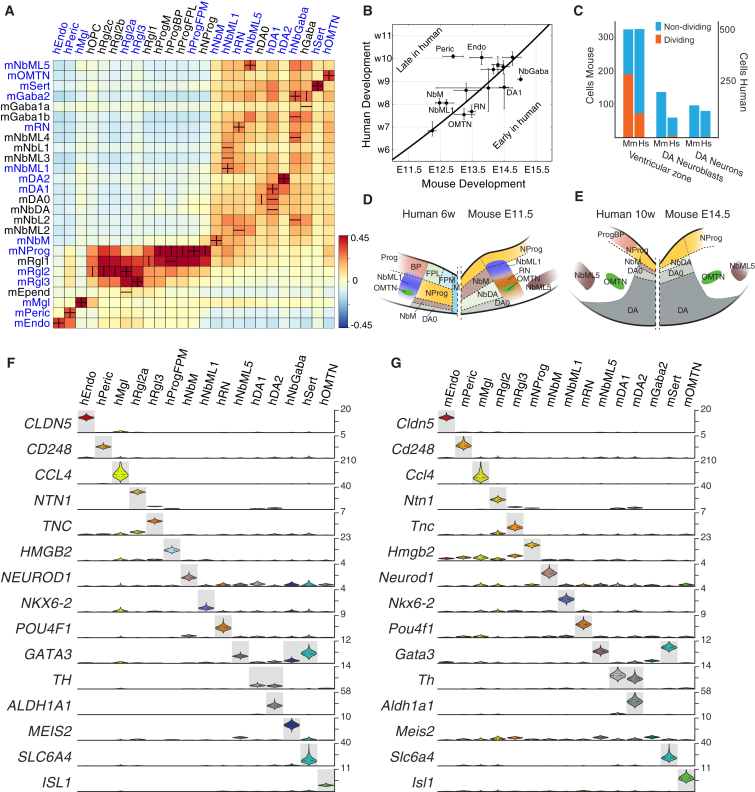
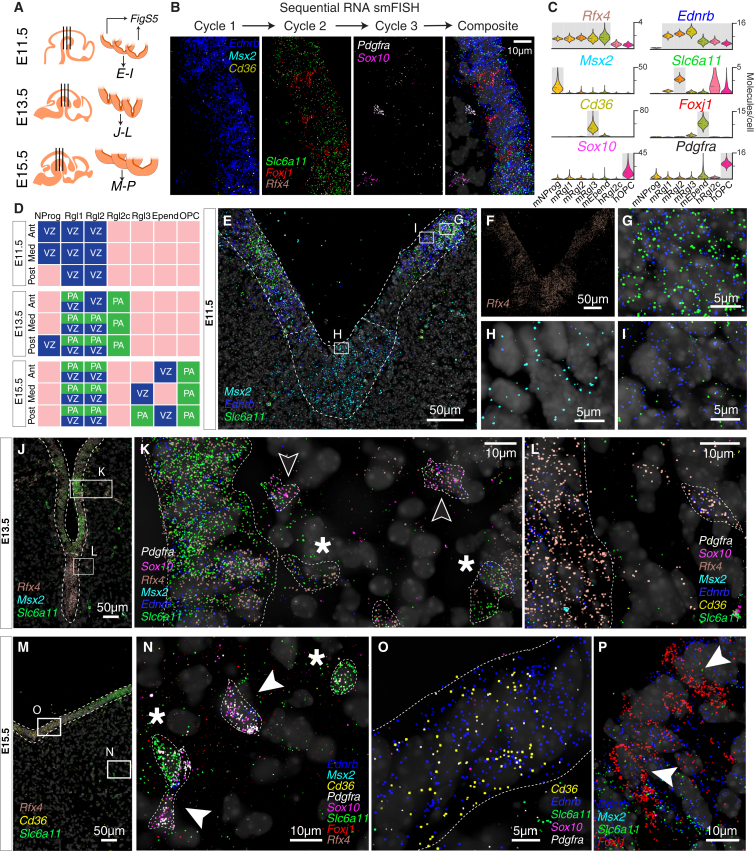
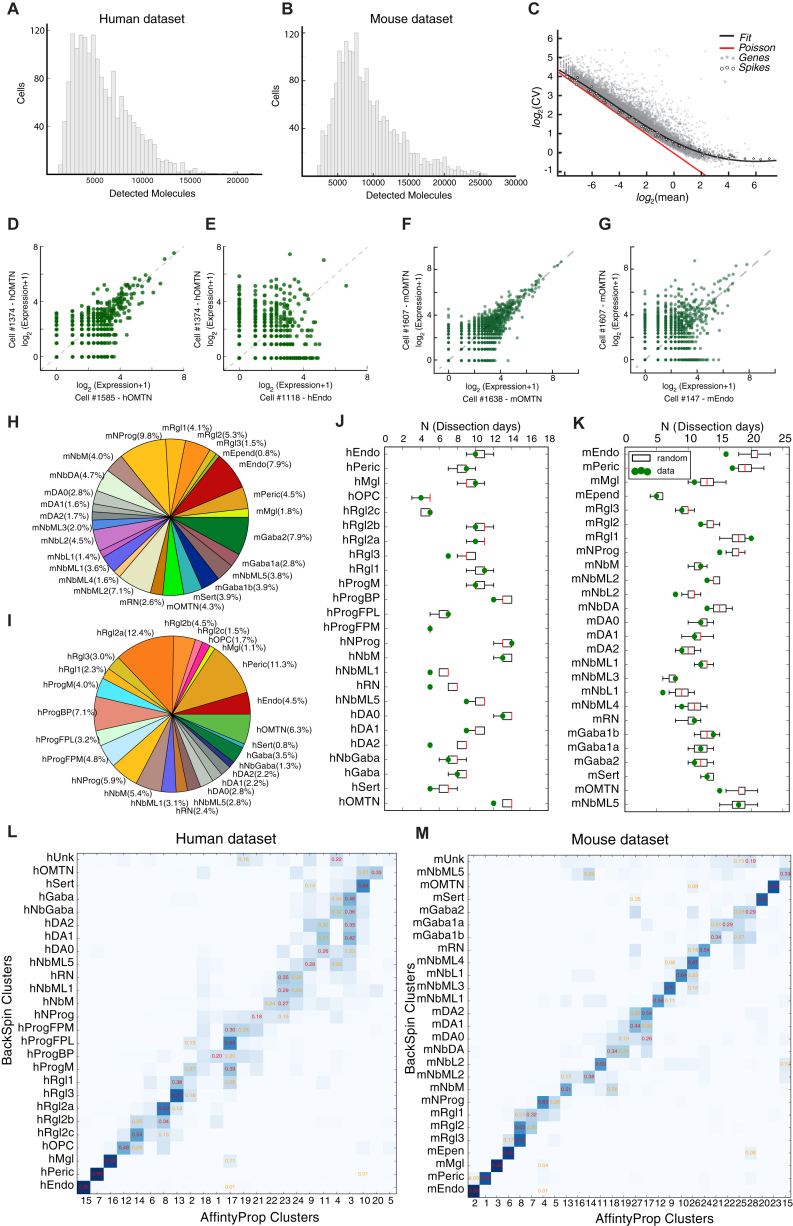
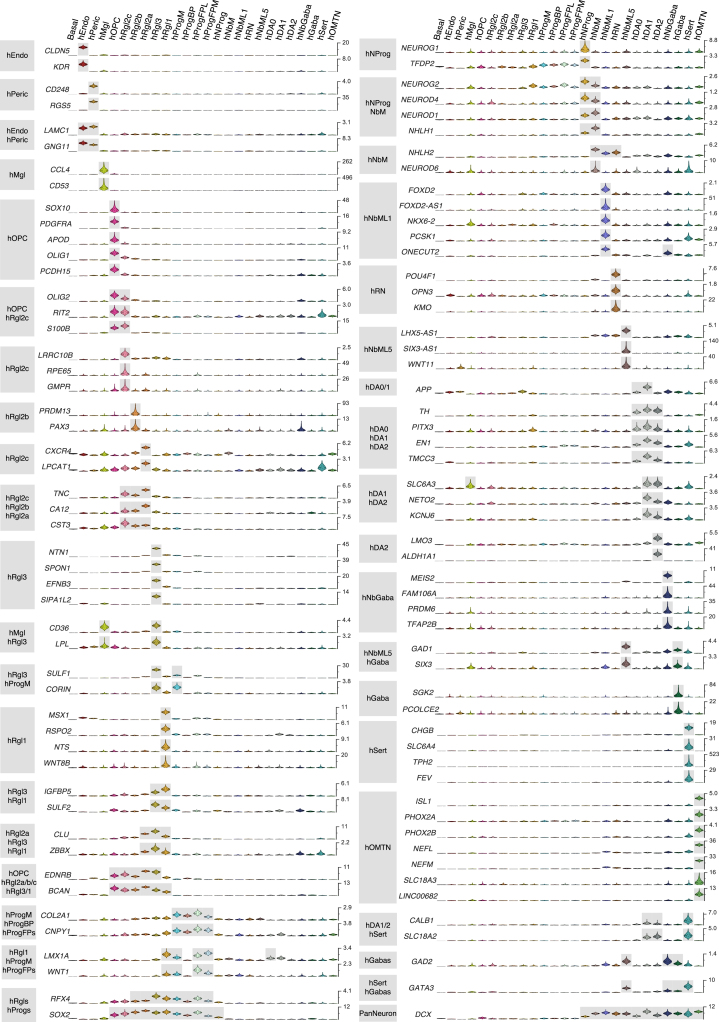
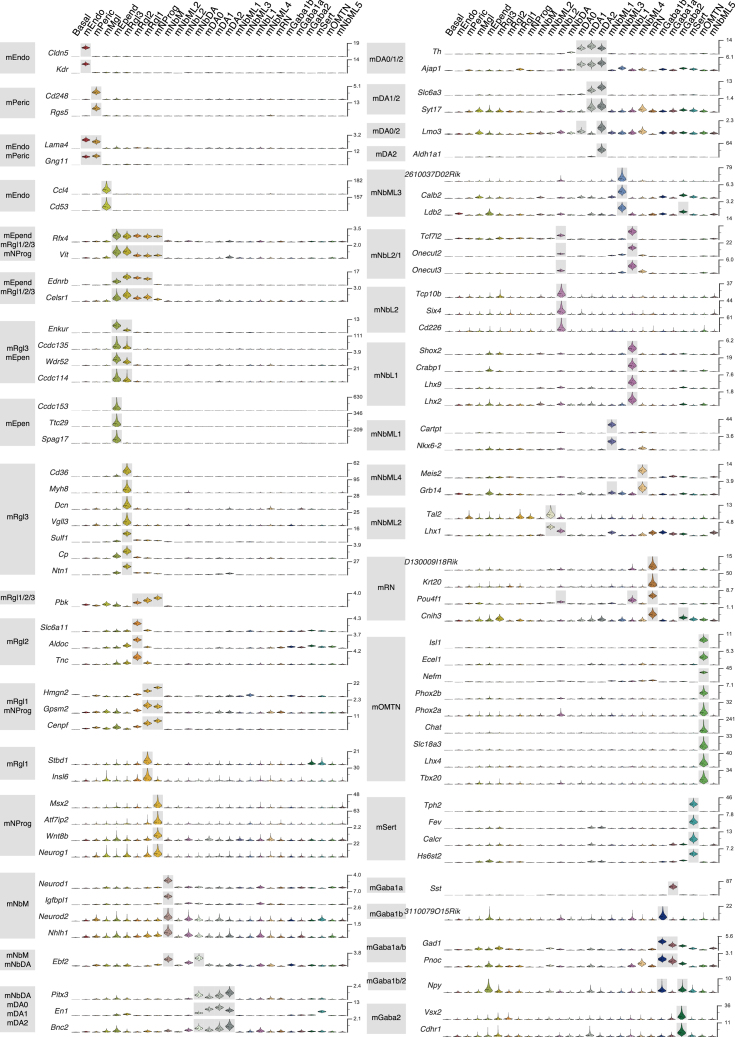
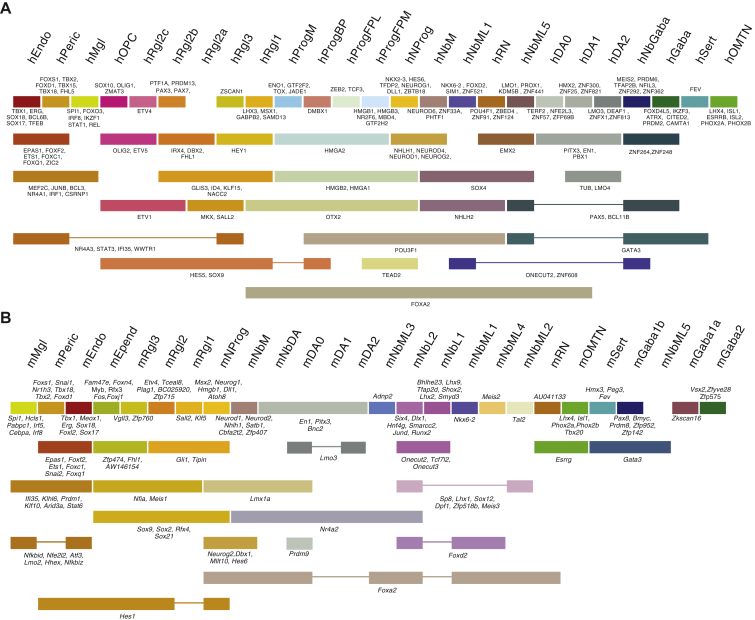
Understanding human embryonic ventral midbrain is of major interest for Parkinson's disease. However, the cell types, their gene expression dynamics, and their relationship to commonly used rodent models remain to be defined. We performed single-cell RNA sequencing to examine ventral midbrain development in human and mouse. We found 25 molecularly defined human cell types, including five subtypes of radial glia-like cells and four progenitors. In the mouse, two mature fetal dopaminergic neuron subtypes diversified into five adult classes during postnatal development. Cell types and gene expression were generally conserved across species, but with clear differences in cell proliferation, developmental timing, and dopaminergic neuron development. Additionally, we developed a method to quantitatively assess the fidelity of dopaminergic neurons derived from human pluripotent stem cells, at a single-cell level. Thus, our study provides insight into the molecular programs controlling human midbrain development and provides a foundation for the development of cell replacement therapies.

Keywords: dopaminergic neuron; human; mouse; single-cell RNA-seq; ventral midbrain.


Figures

None
Graphical abstract
Figure 1
Figure 1
Cell Populations and their Distribution Over Time during Human and Mouse Ventral Midbrain Development (A) Overview of the time points sampled for human and mouse embryos. E, embryonic day; P, postnatal day; w, week. (B) Illustration of the workflow of the experiment and the region dissected. (C) Molecularly defined cell types of the human embryonic midbrain. Dot plot shows time distribution of cell types, heatmap shows pairwise correlations, and bars show average number of detected mRNA molecules per cell. Cell types are named using anatomical and functional mnemonics prefixed by “m” or “h” to indicate mouse and human respectively: OMTN, oculomotor and trochlear nucleus; Sert, serotonergic; NbM, medial neuroblast; NbDA, neuroblast dopaminergic; DA0-2, dopaminergic neurons; RN, red nucleus; Gaba1-2, GABAergic neurons; mNbL1-2, lateral neuroblasts; NbML1-5, mediolateral neuroblasts; NProg, neuronal progenitor; Prog, progenitor medial floorplate (FPM), lateral floorplate (FPL), midline (M), basal plate (BP); Rgl1-3, radial glia-like cells; Mgl, microglia; Endo, endothelial cells; Peric, pericytes; Epend, ependymal; OPC, oligodendrocyte precursor cells. (D) Molecularly defined cell types of the mouse embryonic midbrain. Cell types are named as above (C). (E) Human ventral midbrain single-cell transcriptomes visualized with t-Distributed stochastic neighbor embedding (t-SNE), colored by the clusters defined in (C). Contours are drawn to contain at least 80% of the cells belonging to the category. (F) Mouse ventral midbrain single-cell transcriptomes visualized with t-SNE, colored by the clusters defined in (D). Contours are drawn to contain at least 80% of the cells belonging to the category.
Figure 2
Figure 2
Human and Mouse Cell Type Homologies (A) Cross species similarity of all cell types in human (horizontally) and mouse (vertically). Vertical lines indicate highest correlation of human cell type to mouse. Horizontal lines indicate highest correlation of mouse cell type to human. Crosses are formed for cell types that are mutual best matches, indicated by blue text on cell type labels. (B) Time-course comparison of human versus mouse development, showing for each cell type the time point when half of all cells of that type have appeared. Solid curve shows the translation of mouse to human developmental time, based on the timing of key neurodevelopmental events. Error bars show 95% confidence intervals. (C) Number of cells representing stages of the dopaminergic lineage in the mouse and human. Cells were assigned to VZ (mRgl1-3, mNProg, and mEpend), dopaminergic neuroblasts (mNbM, mNbDA), and dopaminergic neurons (mDA0-2). Putatively dividing cells, as determined by the proliferation index, are shown in orange. (D) Schematic of early human and mouse cell-type compartments (not to scale). (E) Schematic of late human and mouse cell-type compartments (not to scale). (F) Human genes specifically expressed in mutually best-matching cell types in (A), shown as violin plots. Grey, enriched over baseline with posterior probability >99.8%. Right axis shows absolute molecule counts. (G) Same genes as in (F) but for the corresponding mouse cell types, shown as violin plots. Grey, enriched over baseline with posterior probability >99.8%. Right axis shows absolute molecular counts. Note that the vertical scales are the same as in (F).
Figure 3
Figure 3
Diversity of Ventricular Zone Cell Types Single-molecule RNA FISH (RNA smFISH) was performed at three anteroposterior positions and three developmental time points, each with eight genes detected in the same single tissue section by sequential hybridizations. For clarity, the panels of this figure show subsets of markers, but all eight markers were stained for in the same single sections. (A) Schematic of coronal sections taken in anteroposterior axis over several developmental time points, not to scale. (B) Representative images of sequential RNA smFISH with eight probes over three cycles and corresponding composite. (C) The expression of genes selected for RNA smFISH in mouse and human VZ cell types shown as violin plots. The violin plots represent the posterior probability distribution for the expressed number of mRNA molecules per cell type. Grey, enriched over baseline with posterior probability >99.8%. Right axis shows absolute molecule counts. (D) Diagram showing the spatiotemporal location of cells discovered by RNA smFISH in the sections shown in (A). VZ, ventricular zone; PA, parenchyma. Representative images are shown in Figure S5. (E) RNA smFISH showing the distribution of Msx2, Ednrb, and Slc6a11 in the E11.5 ventral midbrain. (F) Signal for Rfx4 on the same section as (E), shown separately for clarity. (G) Inset as indicated in (E). (H) Inset as indicated in (E). (I) Inset as indicated in (E). (J) RNA smFISH showing the distribution of Rfx4, Msx2, and Slc6a11 in the E13.5 ventral midbrain. (K) Inset as indicated in (J) with additional markers Pdgfra, Sox10, and Ednrb. , putative mRgl2 cell; arrow, putative intermediate between Rgl2 and OPC. (L) Inset as indicated in (J) showing markers in (K) in addition of Cd36. (M) RNA smFISH showing the distribution of Rfx4, Cd36, and Slc6a11 in the E15.5 ventral midbrain. (N) Inset as indicated in (M) with additional markers Pdgfra, Sox10, Foxj1, Msx2, and Ednrb. , putative mRgl2 cell; arrow, putative mOPC located in the parenchyma. (O) Inset as indicated in (M) with additional markers Pdgfra, Sox10, and Ednrb in the VZ. (P) RNA smFISH showing Foxj1, Msx2, Slc6a11, and Ednrb. Arrowheads indicate putative ependymal cells in VZ.
Figure 4
Figure 4
Neuroblast Patterning (A) Mouse neuroblast populations and their markers. Grey, enriched over baseline with posterior probability >99.8%. (B) Simplified illustration of the patterning of the ventral midbrain, based on transcriptionally defined domains. Left, coronal view; right, sagittal views at the indicated levels (L1 and L2). (C) In situ hybridization (image data from Allen Institute for Brain Science: Allen Developing Mouse Brain Atlas) for key domain-specific transcription factors and markers. Dashed lines indicate the approximate extent of the ventral region used in our dissections (scale bar, 200 μm).
Figure 5
Figure 5
Comparison of Mouse and Human Dopaminergic Neuronal Development (A) WNT1 compartments marking lateral population of the floor plate in human and mouse tissue (scale bar, 100 μm). (B) Bar plot of cell types of the human and mouse dopaminergic lineage, showing the expression of key genes. Bars show average mRNA expression, scaled to the absolute molecule counts indicated on the right axis. Error bars show SEM. (C) Validation of mNbM by in situ hybridization for Igfbpl1 and Nhlh1 (scale bar, 50 μm). (D) Neuroblasts in human and mouse ventral midbrain (scale bar, 100 μm; magnification, 20 μm). (E) Selected genes showing similar (left) or distinct (right) expression in mouse and human ventral midbrain. Blue, expressed above baseline in mouse (>99.8% posterior probability); green, expressed above baseline in human (>99.8% posterior probability); gray, not expressed above baseline. (F) Validation of LMO3 expression by immunohistochemistry in a subset of TH+ neurons in the E18.5 mouse ventral midbrain (scale bar left, 100 μm; right, 20 μm). (G) Validation of BNC2 expression by immunohistochemistry in TH+ neurons in the E18.5 mouse ventral midbrain (scale bar left, 100 μm; right, 20 μm).
Figure 6
Figure 6
Diversity of Adult Dopaminergic Neurons (A) Expression of selected genes across five adult dopaminergic cell types. Colors as in (5E). , indicates selected genes for validation in (C–K). #, indicates genes selected for in situ validation from Allen Mouse Brain Atlas found in Figure S6F. (B) Projected schematic of five distinct dopaminergic populations in adult ventral midbrain. (C) Anterior to posterior representation of dopaminergic neuron populations at P21. Detection of CALB1, ALDH1A1, and TH. Green dots, TH+/ALDH1A1+/CALB1; Yellow dots, TH+/ALDH1A1+/CALB1+; Red/Pink (high/low expression) dots, CALB1+/TH+/ALDH1A1; White dots, TH+. (scale bar, 200 μm; insets, 20 μm). (D) Validation of dopaminergic neurons at P21. Open arrow, SOX6+/CALB1 (SNC); solid white arrow, SOX6+/CALB1+ (VTA1); solid red arrow, SOX6/CALB1+ (VTA2-4) (scale bar left, 200 μm; right, 20 μm). (E) Validation of dopaminergic neurons at P21. Open arrow, SOX6+/ALDH1A1+ (SNC); solid white arrow, SOX6/ALDH1A1 (VTA3/4); solid red arrow, SOX6/ALDH1A1+ (VTA2) (scale bar left, 200 μm; right, 20 μm). (F) Validation of dopaminergic neurons at P21 in posterior section. Solid white arrow VIP+/CALB1+ (VTA3) (scale bar left, 200 μm; right, 20 μm). (G) Validation of dopaminergic neurons at P21. Open arrow, FOXA2/CALB1+ (VTA2/4); solid white arrow, FOXA2+/CALB1+ (VTA1/3) (scale bar left, 200 μm; right, 20 μm). (H) SOX6+/ALDH1A1+ visible at P0. Insets: open arrow, SOX6+/ALDH1A1 (putative VTA1); solid white arrow, SOX6+/ALDH1A1+ (SNC) (scale bar, 20 μm). (I) Absence of CALB1+ in TH+/ALDH1A1 cells at P0 (scale bar, 20 μm). (J) CALB1+ (open arrow) and CALB1+/ALDH1A1+ (solid arrow, VTA2) visible at P7 (scale bar, 200 μm; insets, 20 μm). (K) VIP+/CALB1+ (solid arrow, VTA3) visible at midline at the posterior level of P7 (scale bar, 20 μm).
Figure 7
Figure 7
Single-Cell Analysis of Differentiated In Vitro Human ESC and iPSC Cultures and Prototype-Based Scoring (A) Expression of marker genes during the differentiation protocol measured by qPCR (solid lines) or inferred by pooling of single-cell RNA-seq data per time point (dashed lines). Red, HS401 cells; blue, H9 cells. (B) Immunostaining of hiPSC cultures (scale bar, 50 μm). (C) hESC-derived cell types compared with in vivo cell types. Heatmap shows correlation based on genes that show specific expression in any in vivo cell type. Pie chart (right) shows relative contribution of each cell line to each cluster. Dot plot shows distribution of cells at different time points. (D) Schematic of the inference of cell identity using prototype scoring. A machine learning model was trained on in vivo cell types (left) resulting in a reusable scoring function. Stem cells were then scored and evaluated individually, without the need for clustering. Typical visualization outputs of the machine learning model are shown in (G–I). (E) Expression of selected genes of the dopaminergic lineage in human development, hESC-, and hiPSC-derived cell types. (F) hiPSC-derived cell types compared with in vivo cell types. Heatmap shows correlation based on all genes that show specific expression in any in vivo cell type. Bars (right) show relative abundances at 47 and 63 days in vitro. (G) Wheel plot showing the prototype scores for hESCs and hiPSCs. Dots represent individual cells and the distance to each prototype is proportional to the relative score of that prototype. Colors indicate time point of differentiation (red, day 0; dark blue, day 63). (H) Heatmap showing gene expression of top-scoring dopaminergic (left) and floorplate progenitor (right) cells. Each subpanel shows individual in vivo (left in each subpanel) and in vitro (right in each subpanel) cells. Genes shown have the top 20 highest weights for the scoring of dopaminergic or floorplate progenitor, respectively. (I) Histograms of prototype scores for human dopaminergic clusters and hiPSC-derived dopaminergic clusters.
Figure S1
Figure S1
Quality Control of Single-Cell Rna-Seq, Related to Figure 1 (A) Distribution of number of mRNA molecules detected in human cells. (B) Distribution of number of mRNA molecules detected in mouse cells. (C) Plot of CV (coefficient of variation, i.e., SD divided by the mean) versus mean mRNA molecule counts. Grey dots, genes; red line, Poisson distribution; black curve, fit of noise distribution used to select genes with greater than expected CV. (D) Scatterplot showing genes expressed in two human cells of the same type. (E) Scatterplot showing genes expressed in two human cells of different types. (F) Scatterplot showing genes expressed in two mouse cells of the same type. (G) Scatterplot showing genes expressed in two mouse cells of different types. (H) Pie chart showing the cell type composition of mouse cell types, all time points combined (excluding adult). (I) Pie chart of human cell types as in (H). (J) Replicate experiments supporting each cell type in mouse. Box and whiskers plots showing the expected distribution of a perfectly random sampling procedure, estimated by repeatedly scrambling the gene labels. (box Q1-Q4; whiskers: 95% C.I.). Green dots show actual sampled data. (K) Replicate experiments supporting each cell type in human. Box and whiskers as in (J) (L) Heatmap showing the overlap of BackSPIN and Affinity Propagation clusters for the human dataset. (M) Heatmap showing the overlap of BackSPIN and Affinity Propagation clusters for the mouse dataset.
Figure S2
Figure S2
Violin Plots Showing a Selection of Genes with Specific Expression in Specific Human Cell Types, Related to Figure 1 Each row shows violin plots depicting posterior probability distributions for the expected mean expression, one for each cell type. Grey boxes indicate > 99.8% probability of expression above baseline (STAR Methods). Genes are grouped for clarity. A full set of genes is provided in Table S2.
Figure S3
Figure S3
Violin Plots Showing a Selection of Genes with Specific Expression in Specific Mouse Cell Types, Related to Figure 1 As in Figure S2.
Figure S4
Figure S4
Transcription Factor Expression across Mouse and Human Cell Types, Related to Figure 1 (A) The binarized expression of transcription factors in human embryos. Rectangles are drawn below single or multiple cell types to represent binary patterns of expression. For each pattern, the names of the transcription factor genes expressed above baseline levels are indicated. (B) The binarized expression of transcription factors in mouse embryo.
Figure S5
Figure S5
Radial Glia Single Molecule RNA FISH, Related to Figure 3 (A) Representative images corresponding to the diagram in Figure 3D. For clarity, every cell type was identified unambiguously by the expression of two genes and by the non-expression of two other genes. All images correspond to a field of size 13μm × 13μm. (B) Schematic of cell types at different sampled time points.
Figure S6
Figure S6
Oculomotor and Trochlear, Serotonergic, and Dopaminergic neurons, Related to Figure 4 and 6 (A) Examples of genes regulated along pseudotime in mOMTN. No genes were significantly downregulated. (B) Validation of the induction of Pvalb during maturation of mOMTN, shown alongside Isl1 in sagittal sections of mouse embryos (in situ hybridization data from the Allen Developing Mouse Brain Atlas) (scale bars 200 μm). (C) Violin plots showing the expression of key genes involved in serotonergic synapse function, across all human cell types. (D) Violin plots showing the expression of key genes involved in serotonergic synapse function, across all mouse cell types. (E) Schematic of the function of genes in (C/D) in a serotonergic neuron, here drawn in place of their corresponding protein products (adapted from Deneris and Wyler, 2012). (F) Spatial distribution of the five adult dopaminergic cell types (in situ hybridization data from Allen Mouse Brain Atlas) (scale bars 200 μm). (G) Validation of AJAP1 as a pan-dopaminergic marker in the adult mouse brain (scale bar left 100 μm; scale bar right 20 μm). (H) Scatterplots showing the level of expression of genes expressed above baseline in matching cell types (left) and the correlation of the cell types that express the genes at higher levels (right)
Figure S7
Figure S7
Stem Cells Differentiation Protocol and Machine Learning Performance and Diagnostics, Related to Figure 7 (A) Schematic of the hESCs in vitro differentiation protocol. (B) Variation of expression of marker genes during the differentiation protocol measured by qPCR. As a comparison, values calculated by summing single cell expression levels are shown as dashed line. (C) Immunostaining of hESC cultures (scale bar 50 μm). (D) Immunostaining of hiPSC cultures (scale bar 50 μm). (E) Heatmap showing raw hiPSCs data clustered. Columns are single cell and rows genes. Cell clusters and genes enriched in every cluster are surrounded by red boxes. (F) Heatmap showing raw hESCs data as in (E). (G) Violin plots showing proliferation index distribution for each hiPSC and hESC cluster. (H) Line plot showing the accuracy score of the classifier varying with decreasing regularization strength as estimated by cross-validation. Red line shows 95% C.I. on the estimation of the accuracy score. (I) Line plot showing the total absolute values of weights. Blue vertical line in (H-I) shows the chosen regularization parameter. (J) Training dataset plotted on wheel plot as in Figure 7G. (K) Score distribution on the training dataset clusters. (L) Negative control cells are obtained by scrambling gene values of cells of the training dataset and are plotted on wheel plot as in Figure 7G. (M) Histograms showing classifier scores of single cells belonging to the human dopaminergic clusters (left), to the dopaminergic hiPSC clusters (center) and to the rest of the cells in the hiPSC preparation (right).

References

    1. Acampora D., Mazan S., Lallemand Y., Avantaggiato V., Maury M., Simeone A., Brûlet P. Forebrain and midbrain regions are deleted in Otx2-/- mutants due to a defective anterior neuroectoderm specification during gastrulation. Development. 1995;121:3279–3290. - PubMed
    1. Achim K., Peltopuro P., Lahti L., Tsai H.-H., Zachariah A., Astrand M., Salminen M., Rowitch D., Partanen J. The role of Tal2 and Tal1 in the differentiation of midbrain GABAergic neuron precursors. Biol. Open. 2013;2:990–997. - PMC - PubMed
    1. Almqvist P.M., Åkesson E., Wahlberg L.U., Pschera H., Seiger A., Sundström E. First trimester development of the human nigrostriatal dopamine system. Exp. Neurol. 1996;139:227–237. - PubMed
    1. Andersson E., Tryggvason U., Deng Q., Friling S., Alekseenko Z., Robert B., Perlmann T., Ericson J. Identification of intrinsic determinants of midbrain dopamine neurons. Cell. 2006;124:393–405. - PubMed
    1. Anthony T.E., Mason H.A., Gridley T., Fishell G., Heintz N. Brain lipid-binding protein is a direct target of Notch signaling in radial glial cells. Genes Dev. 2005;19:1028–1033. - PMC - PubMed

Publication types