. 2016 Oct 7;11(10):e0164432.
doi: 10.1371/journal.pone.0164432. eCollection 2016.

Oligodendrocyte Development in the Absence of Their Target Axons In Vivo

Affiliations

Oligodendrocyte Development in the Absence of Their Target Axons In Vivo

Rafael Almeida et al. PLoS One. .

Abstract

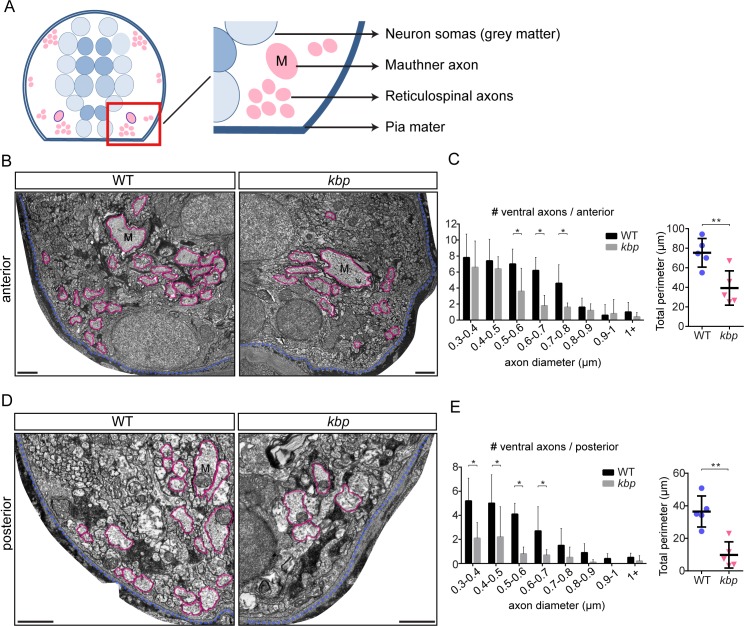
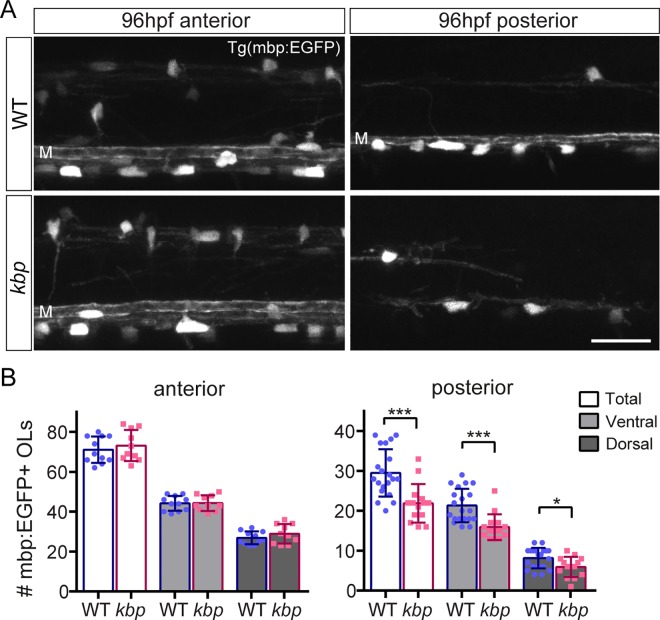
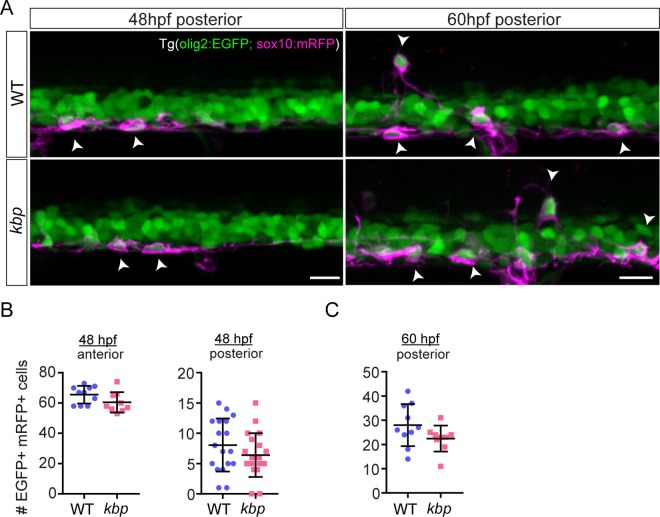
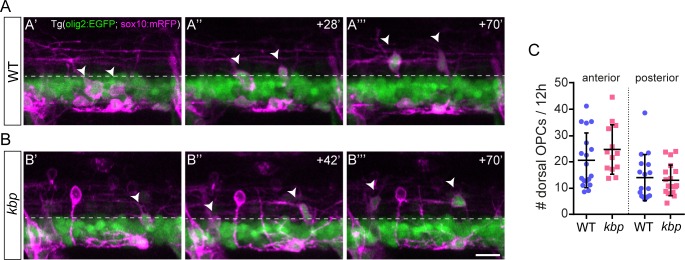
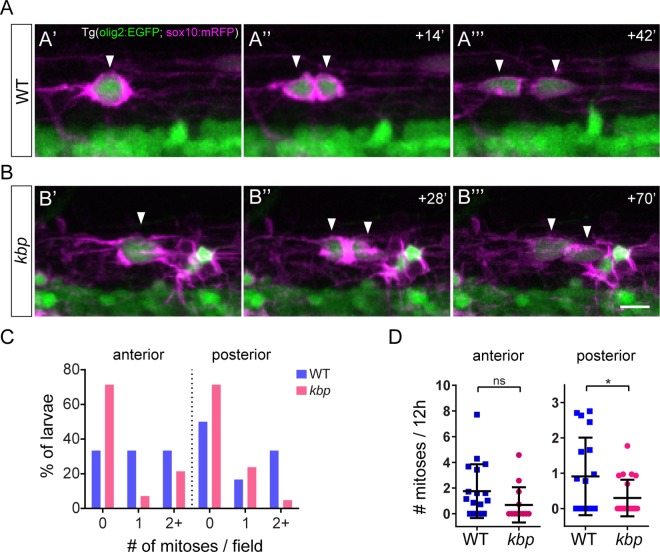
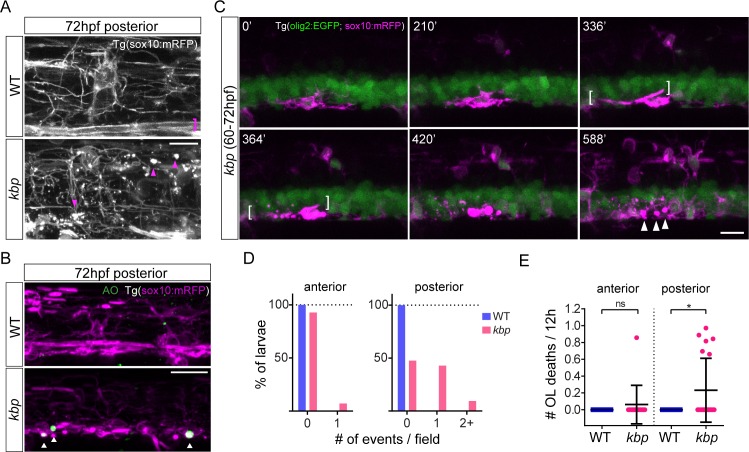
Oligodendrocytes form myelin around axons of the central nervous system, enabling saltatory conduction. Recent work has established that axons can regulate certain aspects of oligodendrocyte development and myelination, yet remarkably oligodendrocytes in culture retain the ability to differentiate in the absence of axons and elaborate myelin sheaths around synthetic axon-like substrates. It remains unclear the extent to which the life-course of oligodendrocytes requires the presence of, or signals derived from axons in vivo. In particular, it is unclear whether the specific axons fated for myelination regulate the oligodendrocyte population in a living organism, and if so, which precise steps of oligodendrocyte-cell lineage progression are regulated by target axons. Here, we use live-imaging of zebrafish larvae carrying transgenic reporters that label oligodendrocyte-lineage cells to investigate which aspects of oligodendrocyte development, from specification to differentiation, are affected when we manipulate the target axonal environment. To drastically reduce the number of axons targeted for myelination, we use a previously identified kinesin-binding protein (kbp) mutant, in which the first myelinated axons in the spinal cord, reticulospinal axons, do not fully grow in length, creating a region in the posterior spinal cord where most initial targets for myelination are absent. We find that a 73% reduction of reticulospinal axon surface in the posterior spinal cord of kbp mutants results in a 27% reduction in the number of oligodendrocytes. By time-lapse analysis of transgenic OPC reporters, we find that the reduction in oligodendrocyte number is explained by a reduction in OPC proliferation and survival. Interestingly, OPC specification and migration are unaltered in the near absence of normal axonal targets. Finally, we find that timely differentiation of OPCs into oligodendrocytes does not depend at all on the presence of target axons. Together, our data illustrate the power of zebrafish for studying the entire life-course of the oligodendrocyte lineage in vivo in an altered axonal environment.


Conflict of interest statement

The authors have declared that no competing interests exist.

Figures

Fig 1
Fig 1. kbp mutants lack reticulospinal axons in the ventral spinal cord.
A, Location of ‘anterior’ and ‘posterior’ regions analysed. B-C, 3A10 immunostained spinal cords of 48hpf (B) or 96hpf (C) WT and kbp mutant larvae; mutants lack the ventral reticulospinal axons (red bracket), but the dorsal tract (black bracket) and motor axon exit points (arrowhead) appear intact. Scalebars: 25μm.
Fig 2
Fig 2. Fewer large-calibre axons in the ventral spinal cord of kbp mutants.
A, Diagram of transversal section of spinal cord. Grey matter is in the centre (blue) and white matter or axonal cross-sectional profiles around it (pink). Red box indicate approximate areas shown in B and D. B, D, Transmission electron micrographs of ventral regions of the anterior (B) and posterior (D) spinal cord at 72hpf. Large axons are traced in pink, pia mater in blue. M = Mauthner axon. Scale bar: 1μm. C, E, Distribution of large ventral axons in WT and kbp mutant shows significant reductions in the number of large (reticulospinal) axons in mutants in both the anterior (C) and posterior (E) spinal cord. Graphs on right show that the total perimeter belonging to large axons is significantly reduced in mutants in both regions. Data from N = 5 WT and N = 5 mutant larvae. * indicates P<0.05; ** indicates P<0.01; see text for details. Error bars indicate ± SD.
Fig 3
Fig 3. Dorsal and medial axons are not affected in kbp mutants.
A, Diagram of hemi-spinal cord transversal section with red boxes indicating dorsal and medial regions shown in B, D and F. B, Transmission electron micrographs of medial region of the posterior spinal cord, with dots indicating small-diameter axons. Scale bar: 0.2μm. C, number and average perimeter of medial axons. D, F, Electron micrographs of dorsal region of the anterior (D) and posterior (F) spinal cord. Large axons are traced in pink, pia mater in blue. Scale bar: 1μm. E, G, Similar distributions of large dorsal axons in WT and kbp mutant anterior (E) and posterior (G) spinal cord. The total perimeter belonging to large axons is similar in WT and mutants. Data from N = 5 WT and N = 5 mutant larvae. Error bars indicate ± SD.
Fig 4
Fig 4. Fewer oligodendrocytes mature in the posterior but not anterior spinal cord of kbp mutants.
A, Spinal cord of 96hpf Tg(mbp:EGFP) larvae with mature oligodendrocyte somas labelled. The myelin sheath of the very large diameter Mauthner axon (M), a reticulospinal axon, is visible in the ventral spinal cord except in the posterior region of mutants. Scale bar: 25 μm. B, The number of total, ventral and dorsal oligodendrocytes (OLs) is reduced in a 425μm long region of the posterior but not anterior spinal cord in mutants, compared to WTs. Data from N = 11 WT and N = 10 mutants (anterior) and N = 20 WT and N = 14 mutants (posterior). * indicates P<0.05; *** indicates P<0.001; see text for details. Error bars indicate ± SD.
Fig 5
Fig 5. pMN progenitor proliferation and motor neuron generation are unaffected by reduction in reticulospinal axons.
A, phospho-Histone 3 immunostained 50hpf Tg(olig2:EGFP) larvae. EGFP+ PH3+ cells indicated by arrowheads; 3A10 panels show labelled reticulospinal axons, or their absence, in corresponding area. Scale bar: 20μm. B, similar number of PH3+ EGFP+ cells between WT and mutants in 425μm long regions of the spinal cord 36–50 hpf. Data from N = 27 WT and N = 9 mutants (36hpf) and N = 15 WT and N = 10 mutants (50hpf). C, HB9 immunostained 50hpf larvae to label motor neurons. Scale bar: 12.5μm. D, similar number of motor neurons between WT and mutant in 150μm long regions of the spinal cord. Data from N = 13 WT and N = 9 mutants. Error bars indicate ± SD.
Fig 6
Fig 6. OPCs are specified normally despite reduction in reticulospinal neurons.
A, Posterior region of 48-60hpf Tg(olig2:EGFP; sox10:mRFP). EGFP+ mRFP+ cells (OPCs) indicated by arrowheads. At 60hpf some OPCs have migrated dorsally. Scale bar: 20 μm. B-C, Similar number of OPCs in 448μm-long regions of the spinal cord between WT and mutants at 48hpf (B) and 60hpf (C). Data from N = 10 WT and N = 9 mutants (48hpf anterior and 60hpf posterior) and N = 18 WT and N = 20 mutants. Error bars indicate ± SD.
Fig 7
Fig 7. OPCs migrate dorsally normally despite reduction in reticulospinal axons.
A, B, Time-lapse stills of Tg(olig2:EGFP; sox10:mRFP), WT (A) or kbp mutant (B) larvae, showing two OPCs (arrowheads) migrating dorsally above the olig2:EGFP band of motor neurons and pMN precursors (dashed line). Scale bar: 10μm. C, The rate at which OPCs accumulate in the dorsal spinal cord is similar between WTs and mutants in 425μm long regions. Data from N = 18 WT and N = 13 mutants (anterior) and N = 17 WT and N = 19 mutants (posterior). Error bars indicate ± SD.
Fig 8
Fig 8. Impaired OPC proliferation in the posterior spinal cord of kbp mutants.
A, B, Time-lapse stills showing representative OPC mitoses in WT (A) and kbp mutants (B); arrowheads indicate mother and daughter cells. Scale bar: 10 μm. C, Proportion of larvae with OPC mitoses. Fewer mutants have any OPC mitoses compared to WTs. D, Rate of OPC mitoses (per 12-hour) is significantly decreased only in the posterior spinal cord of kbp mutants. Data from N = 18 WT and N = 14 mutants (anterior) and N = 18WT and N = 21 mutants (posterior). * indicates P<0.05; see text for details. Error bars indicate ± SD.
Fig 9
Fig 9. Impaired survival of a subset of oligodendrocyte-lineage cells in the posterior spinal cord of kbp mutants.
A, High-magnification live-imaging of the posterior spinal cord of 72hpf Tg(sox10:mRFP) larvae, with Mauthner axon myelin sheaths in WTs (pink bracket) and mRFP+ debris in mutants (pink arrowheads). Scale bars: 10 μm B, Posterior spinal cord of 72hpf Tg(sox10:mRFP) larvae stained with Acridine Orange; mutants have AO+ foci (arrowheads). See text for details. Scale bar: 20 μm. C, Time-lapse stills showing a mutant oligodendrocyte forming a myelin sheath (brackets) and then dying, originating mRFP+ debris (arrowheads). Scale bar: 10μm. D, Proportion of larvae with oligodendrocyte death events: essentially only mutants show any events, only in the posterior spinal cord. E, Rate of oligodendrocyte (OL) death (per 12-hour) is significantly elevated only in the posterior spinal cord of kbp mutants. Data from N = 18 WT and N = 14 mutants (anterior) and N = 18WT and N = 21 mutants (posterior). * indicates P<0.05; see text for details. Error bars indicate ± SD.
Fig 10
Fig 10. Oligodendrocytes differentiate on time in the posterior spinal cord of kbp mutants.
A, Time-course of sparsely labelled oligodendrocyte-lineage cells in Tg(sox10:KalTA4; UAS:kaede) larvae between 72-96hpf in the posterior spinal cord, showing myelin sheath formation by 96hpf (arrowheads). Scale bar: 10 μm. B, Time course profiles of 66 WT and 48 mutant cells; magenta indicates OPC stage, green indicates oligodendrocyte. Most cells mature by 96hpf in both WT and mutants.

References

    1. Sherman DL, Brophy PJ. Mechanisms of axon ensheathment and myelin growth. Nature reviews Neuroscience. 2005;6(9):683–90. 10.1038/nrn1743 . - DOI - PubMed
    1. Lee Y, Morrison BM, Li Y, Lengacher S, Farah MH, Hoffman PN, et al. Oligodendroglia metabolically support axons and contribute to neurodegeneration. Nature. 2012;487(7408):443–8. 10.1038/nature11314 - DOI - PMC - PubMed
    1. Funfschilling U, Supplie LM, Mahad D, Boretius S, Saab AS, Edgar J, et al. Glycolytic oligodendrocytes maintain myelin and long-term axonal integrity. Nature. 2012;485(7399):517–21. 10.1038/nature11007 - DOI - PMC - PubMed
    1. Hildebrand C, Remahl S, Persson H, Bjartmar C. Myelinated nerve fibres in the CNS. Progress in neurobiology. 1993;40(3):319–84. 10.1016/0301-0082(93)90015-k . - DOI - PubMed
    1. Hildebrand C, Hahn R. Relation between myelin sheath thickness and axon size in spinal cord white matter of some vertebrate species. Journal of the neurological sciences. 1978;38(3):421–34. 10.1016/0022-510x(78)90147-8 . - DOI - PubMed

MeSH terms