. 2016 Nov;80(5):718-729.
doi: 10.1002/ana.24779. Epub 2016 Nov 2.

Stratification of unresponsive patients by an independently validated index of brain complexity

Affiliations

Stratification of unresponsive patients by an independently validated index of brain complexity

Silvia Casarotto et al. Ann Neurol. 2016 Nov.

Abstract

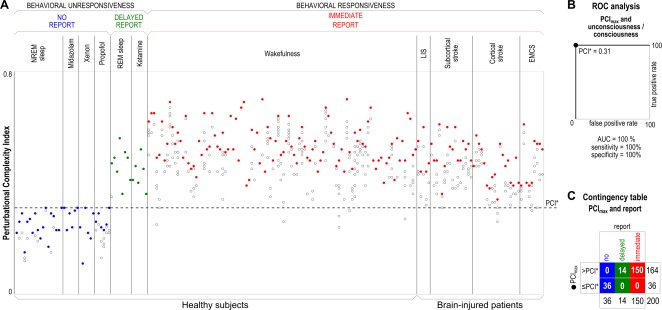
Objective: Validating objective, brain-based indices of consciousness in behaviorally unresponsive patients represents a challenge due to the impossibility of obtaining independent evidence through subjective reports. Here we address this problem by first validating a promising metric of consciousness-the Perturbational Complexity Index (PCI)-in a benchmark population who could confirm the presence or absence of consciousness through subjective reports, and then applying the same index to patients with disorders of consciousness (DOCs).

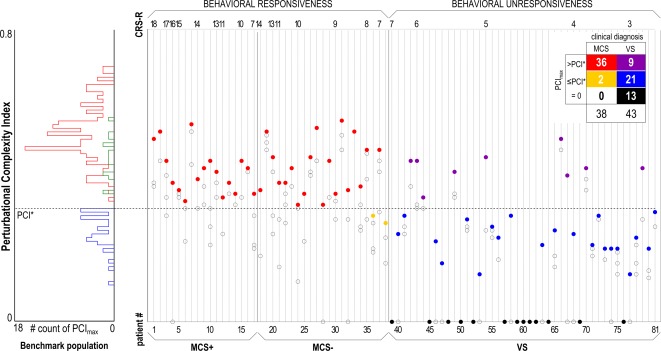
Methods: The benchmark population encompassed 150 healthy controls and communicative brain-injured subjects in various states of conscious wakefulness, disconnected consciousness, and unconsciousness. Receiver operating characteristic curve analysis was performed to define an optimal cutoff for discriminating between the conscious and unconscious conditions. This cutoff was then applied to a cohort of noncommunicative DOC patients (38 in a minimally conscious state [MCS] and 43 in a vegetative state [VS]).

Results: We found an empirical cutoff that discriminated with 100% sensitivity and specificity between the conscious and the unconscious conditions in the benchmark population. This cutoff resulted in a sensitivity of 94.7% in detecting MCS and allowed the identification of a number of unresponsive VS patients (9 of 43) with high values of PCI, overlapping with the distribution of the benchmark conscious condition.

Interpretation: Given its high sensitivity and specificity in the benchmark and MCS population, PCI offers a reliable, independently validated stratification of unresponsive patients that has important physiopathological and therapeutic implications. In particular, the high-PCI subgroup of VS patients may retain a capacity for consciousness that is not expressed in behavior. Ann Neurol 2016;80:718-729.


Figures

Figure 1
Figure 1
(A) Each circle represents the Perturbational Complexity Index (PCI) value computed from the cortical responses to transcranial magnetic stimulation (TMS) of one stimulation site. Several PCI values computed in each individual are aligned along vertical columns. PCI values are computed from TMS‐evoked potentials recorded in healthy subjects and conscious brain‐injured patients during different conditions. Individuals are grouped by condition, and within each condition are sorted by increasing age. For each individual, the maximum PCI value (PCImax) is represented by a solid circle, whereas lower PCI values are represented by open circles. During non–rapid eye movement (NREM) sleep and anesthesia with midazolam, xenon, and propofol, subjects were behaviorally unresponsive and did not provide any report upon awakening. During dreaming and ketamine anesthesia, subjects were behaviorally unresponsive but provided delayed subjective reports upon awakening. During wakefulness, both healthy subjects and conscious brain‐injured patients could immediately report their subjective experience. (B) Receiver operating characteristic (ROC) curve analysis applied to PCImax values for computing the optimal cutoff (PCI* = 0.31) that discriminates between unconsciousness (as assessed through the absence of any subjective report) and consciousness (as assessed through the presence of either an immediate or a delayed subjective report). Area under the curve (AUC) is 100%; using PCI* as a cutoff, sensitivity and specificity both result in 100%. (C) Contingency table obtained by slicing through the PCImax values with PCI*, also highlighted by a dashed horizontal line in panel A. EMCS = emergence from minimally conscious state; LIS = locked‐in syndrome; REM = rapid eye movement. [Color figure can be viewed at wileyonlinelibrary.com]
Figure 2
Figure 2
The histogram (left) summarizes the distribution of maximum Perturbational Complexity Index values (PCImax) in the benchmark population, specifically obtained in the absence of subjective report (blue) and in the presence of subjective report (delayed, green; immediate, red) conditions. The dashed horizontal line highlights the optimal cutoff (PCI*) computed from receiver operating characteristic curve analysis on the benchmark population. The scatter plot (right) shows all the PCI values obtained in minimally conscious state (MCS+/MCS) and vegetative state (VS) patients. The PCI values computed in each patient (2–4 values) are aligned along vertical columns. Within each diagnostic group, patients are sorted by the Coma Recovery Scale‐Revised (CRS‐R) total score in decreasing order. For each patient, the PCImax is represented by a color‐filled circle, whereas lower PCI values are represented by empty circles. The contingency table (right upper corner) is obtained by slicing through the PCImax values with PCI* and shows that 36 MCS patients resulted in PCImax > PCI* (red), whereas in 2 MCS patients PCImax was lower than PCI* (yellow). In addition, VS patients could be divided into 3 subgroups according to PCImax: 9 patients with PCImax > PCI* (purple), 21 patients with PCImax ≤ PCI* (blue), and 13 patients with PCImax = 0 (black).
Figure 3
Figure 3
(A) Distribution of vegetative state (VS) and minimally conscious state (MCS) patients across conventional electroencephalographic (EEG) categories (i.e., severely abnormal, moderately abnormal, and mildly abnormal). The number of patients in each EEG category is explicitly indicated within the bars for VS and MCS patients. (B) Boxplot of the maximum individual Perturbational Complexity Index values (PCImax) computed in MCS patients as a function of conventional EEG category. The dashed horizontal line highlights the optimal cutoff (PCI*) obtained from the benchmark population. (C) The first row shows 10‐second continuous EEG recordings from 4 bipolar channels (F3‐C3, P3‐O1, F4‐C4, P4‐O2) in 3 representative MCS patients with PCImax higher than PCI* (from left to right: Patients 19, 10, and 25), and respectively with a severely abnormal (left), a moderately abnormal (center), and a mildly abnormal (right) background. The second row shows the corresponding average transcranial magnetic stimulation (TMS)‐evoked potentials (all channels superimposed, with 3 illustrative channels highlighted in bold) together with the PCImax values. Three voltage scalp topographies (third row) and significant current density cortical maps (fourth row) are shown at selected time points for each patient. A white cross on the cortical map indicates the stimulation target. [Color figure can be viewed at wileyonlinelibrary.com]
Figure 4
Figure 4
(A) The first row shows structural images of 3 representative vegetative state (VS) patients (from left to right: Patients 57, 78, and 42), with individual maximum value of Perturbational Complexity Index (PCImax) respectively = 0 (left), PCImax lower than the optimal empirical cutoff obtained from the benchmark population (PCI*; center), and PCImax higher than PCI* (right). One coronal and 1 sagittal view for each patient are displayed in correspondence with the stimulation site (white cross). The second row shows the corresponding average transcranial magnetic stimulation (TMS)‐evoked potentials (all channels superimposed, with 3 illustrative channels highlighted in bold), together with the PCImax values. Three voltage scalp topographies (third row) and significant current density cortical maps (fourth row) are shown at selected time points for each patient. A white cross on the cortical map indicates the stimulation target. The dashed vertical line highlights the PCI* obtained from the benchmark population. (B) Distribution of the severely abnormal and moderately abnormal background patterns across the 3 subgroups of VS patients defined by PCImax‐based stratification, namely no‐response, low‐complexity, and high‐complexity. (C) Boxplot of the PCImax values computed in VS patients with PCImax lower than PCI* as a function of conventional electroencephalographic (EEG) category. The dashed horizontal line highlights the PCI* obtained from the benchmark population. L = left; MRI = magnetic resonance imaging; R = right. [Color figure can be viewed at wileyonlinelibrary.com]

References

    1. Giacino JT, Kalmar K, Whyte J. The JFK Coma Recovery Scale‐Revised: measurement characteristics and diagnostic utility. Arch Phys Med Rehabil 2004;85:2020–2029. - PubMed
    1. Laureys S, Schiff ND. Coma and consciousness: paradigms (re)framed by neuroimaging. Neuroimage 2012;61:478–491. - PubMed
    1. Fernández‐Espejo D, Owen AM. Detecting awareness after severe brain injury. Nat Rev Neurosci 2013;14:801–809. - PubMed
    1. Fernández‐Espejo D, Rossit S, Owen AM. A thalamocortical mechanism for the absence of overt motor behavior in covertly aware patients. JAMA Neurol 2015;72:1442–1450. - PubMed
    1. Schiff ND. Recovery of consciousness after brain injury: a mesocircuit hypothesis. Trends Neurosci 2010;33:1–9. - PMC - PubMed

Publication types

MeSH terms