. 2016 Oct 20;23(10):1282-1293.
doi: 10.1016/j.chembiol.2016.09.001. Epub 2016 Oct 6.

Endoplasmic Reticulum Proteostasis Influences the Oligomeric State of an Amyloidogenic Protein Secreted from Mammalian Cells

Affiliations

Endoplasmic Reticulum Proteostasis Influences the Oligomeric State of an Amyloidogenic Protein Secreted from Mammalian Cells

John J Chen et al. Cell Chem Biol. .

Abstract

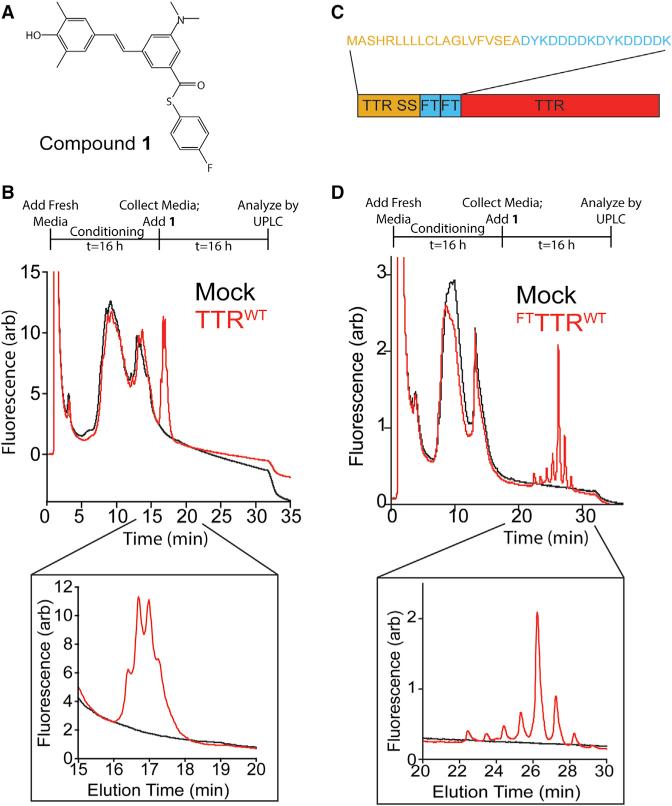
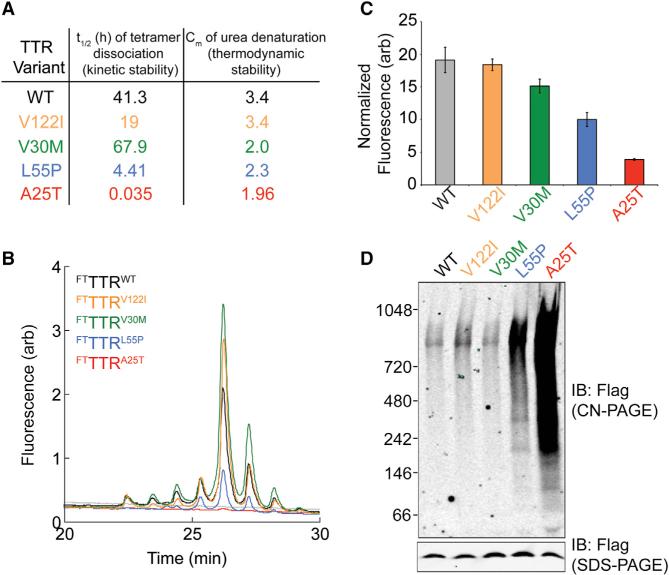
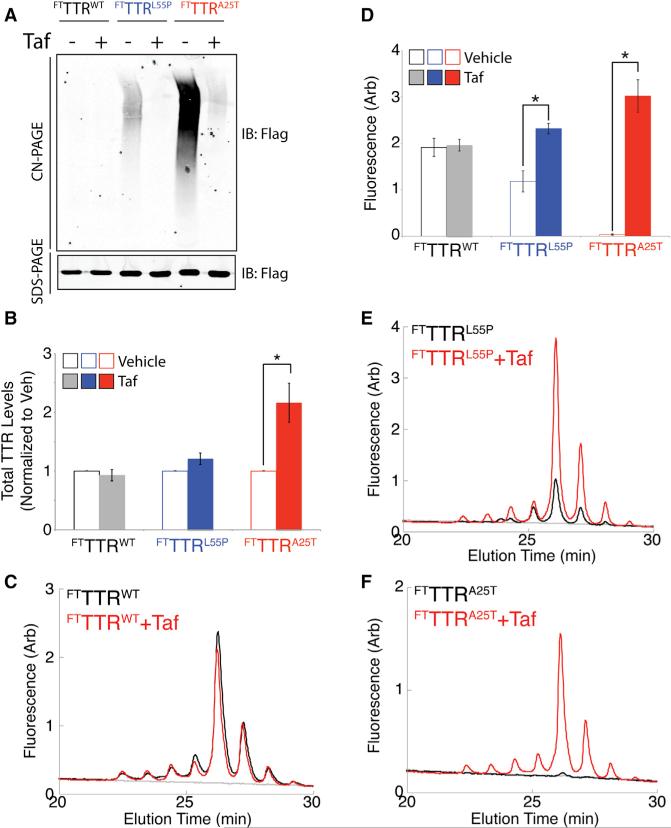
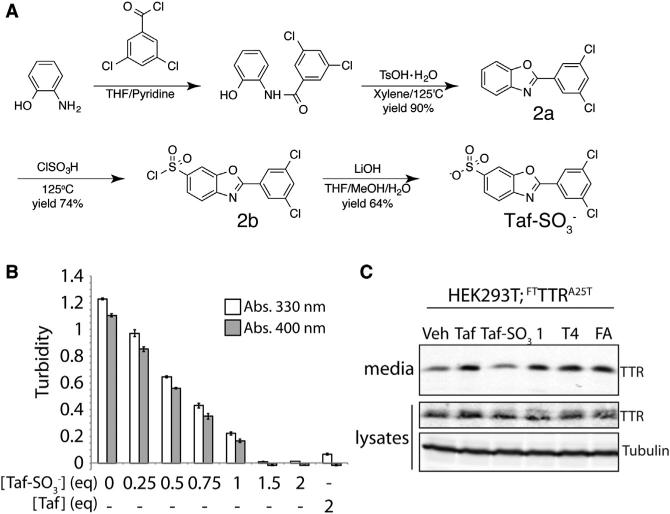
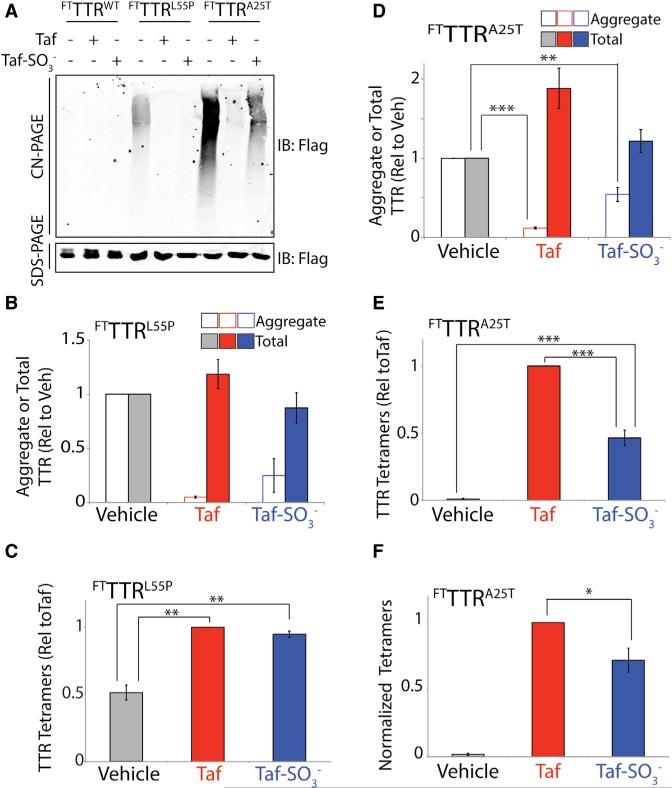
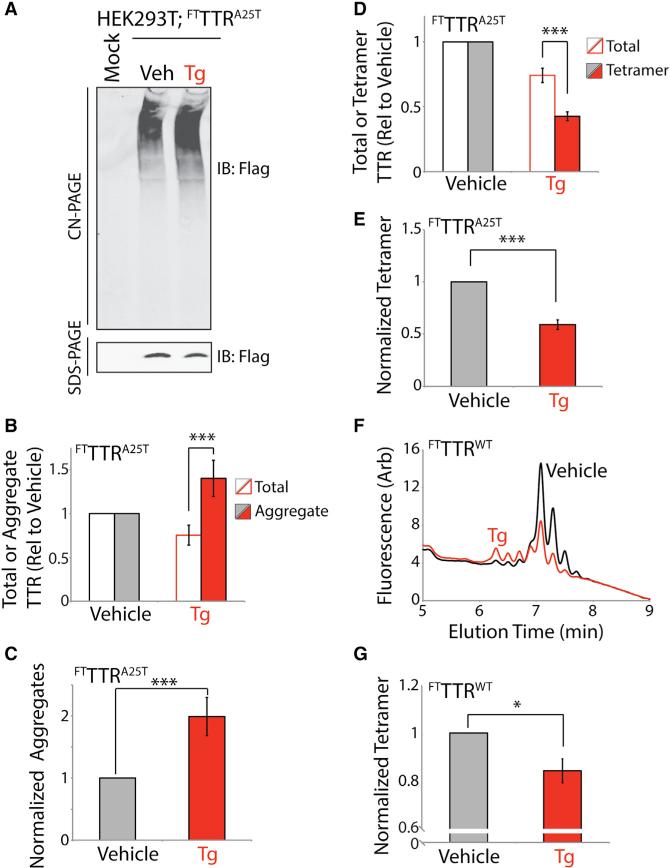
Transthyretin (TTR) is a tetrameric serum protein associated with multiple systemic amyloid diseases. In these disorders, TTR aggregates in extracellular environments through a mechanism involving rate-limiting dissociation of the tetramer to monomers, which then misfold and aggregate into soluble oligomers and amyloid fibrils that induce toxicity in distal tissues. Using an assay established herein, we show that highly destabilized, aggregation-prone TTR variants are secreted as both native tetramers and non-native conformations that accumulate as high-molecular-weight oligomers. Pharmacologic chaperones that promote endoplasmic reticulum (ER) proteostasis of destabilized TTR variants increase their fraction secreted as a tetramer and reduce extracellular aggregate populations. In contrast, disrupting ER proteostasis reduces the fraction of destabilized TTR secreted as a tetramer and increases extracellular aggregates. These results identify ER proteostasis as a factor that can affect conformational integrity and thus toxic aggregation of secreted amyloidogenic proteins associated with the pathology of protein aggregation diseases.

Keywords: ER stress; Transthyretin; amyloid; extracellular proteostasis; misfolded protein secretion; protein aggregation; protein secretion.


Figures

Figure 1
Figure 1. Secreted TTR Tetramers Can Be Detected in Conditioned Media by Compound 1 Conjugate Fluorescence
(A) Structure of the fluorogenic TTR kinetic stabilizer compound 1 (Choi et al., 2010). This molecule covalently reacts with TTR through amide formation to Lys15, liberating the p-fluorothiophenol moiety and resulting in compound 1-TTR conjugate fluorescence. (B) Plot showing the compound 1-TTR conjugate fluorescence of media conditioned for 16 hr on mock-transfected HEK293 cells (black) or HEK293 cells expressing TTRWT (red) separated by UPLC anion-exchange chromatography. Compound 1 (10 μM) was incubated with conditioned media for 16 hr prior to analysis. The inset shows compound 1-TTR conjugate fluorescence for the peaks corresponding to TTRWT. The experimental protocol is described above. (C) Image showing the FTTTR sequence containing the TTR ER signal sequence (SS), two FLAG tag sequences, and the TTR coding sequence. The amino acid sequence for the signal sequence and tandem FLAG tag of FTTTR is shown above. (D) Plot showing the compound 1-TTR conjugate fluorescence of media conditioned for 16 hr on mock-transfected HEK293 cells (black) or HEK293 cells expressing FTTTRWT (red) separated by UPLC anion-exchange chromatography. Compound 1 (10 μM) was incubated with conditioned media for 16 hr prior to analysis. The inset shows compound 1-TTR conjugate fluorescence for the peaks corresponding to FTTTRWT. The experimental protocol is described above.
Figure 2
Figure 2. TTR Tetramers Composed of Destabilized Variants Are Unstable in Conditioned Media
(A) Table showing the t1/2 of tetramer dissociation (a measure fof kinetic stability) and Cm of urea denaturation (a measure of thermodynamic stability) at 25°C for TTRWT and the disease-associated TTR variants TTRV122I, TTRV30M, TTRL55P, and TTRA25T. These values were reported previously (Sekijima et al., 2005). (B) Representative plot showing the compound 1-TTR conjugate fluorescence of media conditioned for 16 hr on HEK293 cells expressing FTTTRWT (black), FTTTRV122I (orange), FTTTRV30M (green), FTTTRL55P (blue), or FTTTRA25T (red). Compound 1 (10 μM) was added to conditioned media for 16 hr prior to analysis by UPLC anion-exchange chromatography. (C) Graph showing the normalized compound 1-TTR conjugate fluorescence for plots such as those shown in Figure 2B. Normalization of compound 1-TTR conjugate fluorescence was performed by integrating the fluorescence signal from all peaks corresponding to the TTR tetramer and then normalizing to the relative amounts of TTR in each conditioned media determined by SDS-PAGE/immunoblotting (see Figure S2B). Error bars show SEM for n = 3. (D) Clear native (CN)-PAGE and SDS-PAGE immunoblots of media conditioned for 16 hr on HEK293 cells expressing FTTTRWT, FTTTRV122I, FTTTRV30M, FTTTRL55P, or FTTTRA25T.
Figure 3
Figure 3. Pharmacologic Chaperoning of TTR Tetramers in the ER Reduces Aggregates and Increases Tetramers of Destabilized TTR Variants in Conditioned Media
(A) Representative CN-PAGE and SDS-PAGE immunoblots of media conditioned for 16 hr on HEK293 cells expressing FTTTRWT, FTTTRL55P, or FTTTRA25T in the presence or absence of Taf (10 μM). (B) Graph showing the normalized total amount of FTTTRWT (black), FTTTRL55P (blue), or FTTTRA25T (red) in media conditioned for 16 hr on HEK293 cells expressing these different TTR variants in the presence (solid bars) or absence (open bars) of Taf (10 μM). Total amounts of TTR were measured by SDS-PAGE/immunoblotting as shown in (A). TTR levels were normalized to vehicle-treated cells. Error bars show SEM for n = 3. *p < 0.05. (C) Representative plot showing compound 1-TTR conjugate fluorescence of media conditioned for 16 hr on HEK293 cells expressing FTTTRWT incubated in the presence (red) or absence (black) of Taf (10 μM). Compound 1 (10 μM) was added to conditioned media for 16 hr prior to analysis by UPLC anion-exchange chromatography. (D) Graph showing the integrated compound 1-TTR conjugate fluorescence (including all peaks) for FTTTRWT (gray), FTTTRL55P (blue), and FTTTRA25T (red) in media conditioned for 16 hr on HEK293 cells expressing the indicated FTTTR variant in the presence (solid bars) or absence (open bars) of Taf (10 μM). Representative plots are shown in (C), (E), and (F). Error bars show SEM for n = 3. *p < 0.05. (E) Representative plot showing compound 1-TTR conjugate fluorescence of media conditioned for 16 hr on HEK293 cells expressing FTTTRL55P incubated in the presence (red) or absence (black) of Taf (10 μM). Compound 1 (10 μM) was added to conditioned media for 16 hr prior to analysis by UPLC anion-exchange chromatography. (F) Representative plot showing compound 1-TTR conjugate fluorescence of media conditioned for 16 hr on HEK293 cells expressing FTTTRA25T incubated in the presence (red) or absence (black) of Taf (10 μM). Compound 1 (10 μM) was added to conditioned media for 16 hr prior to analysis by UPLC anion-exchange chromatography.
Figure 4
Figure 4. Tafamidis-Sulfonate (Taf-SO3) Is a Non-Cell-Permeable Kinetic Stabilizer of the TTR Tetramer
(A) Synthetic scheme used to prepare Taf-SO3. (B) Graph showing the acid-induced aggregation of TTRWT (3.6 μM tetramer) at pH 4.4 measured by turbidity at 400 nm (gray) or 330 nm (white). Taf or Taf-SO3 was added at the indicated molar equivalents to the TTR tetramer (3.6 μM). Error bars show SEM for n = 3. (C) Immunoblot showing TTR in media conditioned on HEK293 cells expressing FTTTRA25T in the presence of TTR tetramer kinetic stabilizers Taf, Taf-SO3, 1, thyroxine (T4), or flufenamic acid (FA) (10 μM). The lysate samples are shown as a control.
Figure 5
Figure 5. Highly Destabilized TTR Variants Can Be Secreted as Native Tetramers and in Non-Tetrameric Conformations
(A) Representative CN-PAGE and SDS-PAGE immunoblots of media conditioned for 16 hr on HEK293 cells expressing FTTTRWT, FTTTRL55P, or FTTTRA25T in the presence of Taf (10 μM) or Taf-SO3 (all at 10 μM). (B) Graph showing the quantification of aggregate (open bars; measured by CN-PAGE) or total (solid bars; measured by SDS-PAGE) FTTTRL55P in media conditioned on HEK293 cells in the presence of vehicle (gray), Taf (10 μM; red), or Taf-SO3 (10 μM; blue). Representative immunoblots are shown in (A). Error bars show SEM for n = 3. (C) Graph showing tetramer levels in media conditioned on HEK293 cells expressing FTTTRL55P in the presence of vehicle (gray), Taf (10 μM; red), or Taf-SO3 (10 μM; blue). Tetramer levels were quantified by integrating compound 1-TTR conjugate fluorescence measured by UPLC and are shown relative to Taf-treated cells. A representative UPLC trace is shown in Figure S4A. Error bars show SEM for n = 4. **p < 0.01. (D) Graph showing the quantification of aggregate (open bars; measured by CN-PAGE) or total (solid bars; measured by SDS-PAGE) FTTTRA25T in media conditioned for 16 hr on HEK293 cells in the presence of vehicle (gray), Taf (10 μM; red), or Taf-SO3 (10 μM; blue). Representative immunoblots are shown in (A). Error bars show SEM for n = 8. ***p < 0.005, **p < 0.01. (E) Graph showing tetramer levels in media conditioned for 16 hr on HEK293 cells expressing FTTTRA25T in the presence of vehicle (gray), Taf (10 μM; red), or Taf-SO3 (10 μM; blue). Tetramer levels were quantified by integrating compound 1-TTR conjugate fluorescence measured by UPLC and are shown relative to Taf-treated cells. A representative UPLC trace is shown in Figure S4B. Error bars show SEM for n = 4. ***p < 0.005. (F) Graph showing the normalized compound 1-TTR conjugate fluorescence of TTR tetramers in media conditioned for 16 hr on HEK293 cells expressing FTTTRA25T in the presence of vehicle (gray), Taf (10 μM; red), or Taf-SO3 (10 μM; blue). Compound 1-TTR conjugate fluorescence was normalized to the average relative amounts of total FTTTRA25T (measured by SDS-PAGE; A) to account for differences in total protein in media prepared in the presence of Taf or Taf-SO3. Error bars show SEM for n = 4. *p < 0.05.
Figure 6
Figure 6. Thapsigargin-Induced ER Stress Reduces Secretion of FTTTRA25T as Tetramers and Increases Extracellular TTR Aggregates
(A) Representative CN-PAGE and SDS-PAGE immunoblots of media conditioned for 16 hr on HEK293 cells expressing FTTTRA25T in the presence of vehicle or thapsigargin (Tg) (0.5 μM). All media were conditioned in the presence of Taf-SO3 (10 μM). (B) Graph showing total TTR (open bars; measured by SDS-PAGE) and aggregate TTR (closed bars; measured by CN-PAGE) in media conditioned for 16 hr on HEK293 cells expressing FTTTRA25T in the presence of vehicle (gray) or Tg (red; 0.5 μM). All media were conditioned in the presence of Taf-SO3 (10 μM). Representative immunoblots are shown in (A). Data are shown relative to vehicle-treated cells. Error bars show SEM for n = 12. ***p < 0.005. (C) Graph showing normalized TTR aggregates in the conditioned media described in (A) and (B). Normalized aggregates were calculated by dividing the relative amounts of aggregate by the total amount of TTR in each sample measured by SDS-PAGE. This normalization is necessary to account for the reduced total FTTTRA25T levels observed in Tg-treated cells. Error bars show SEM for n = 12. ***p < 0.005. (D) Graph showing total TTR (open bars; measured by SDS-PAGE) and tetrameric TTR (closed bars; measured by integrated compound 1-TTR conjugate fluorescence from UPLC traces) in media conditioned for 16 hr on HEK293 cells expressing FTTTRA25T in the presence of vehicle (gray) or Tg (red; 0.5 μM). All media were conditioned in the presence of Taf-SO3 (10 μM). A representative UPLC trace is shown in Figure S5B. Data are shown relative to vehicle-treated cells. Error bars show SEM for n = 15. ***p < 0.005. (E) Graph showing normalized TTR tetramers in the conditioned media described in (D). Normalized tetramers were calculated by dividing the relative tetramer levels by the total amount of TTR in each sample measured by SDS-PAGE. This normalization is necessary to account for the reduced total FTTTRA25T levels observed in Tg-treated cells. Error bars show SEM for n = 15. ***p < 0.005. (F) Representative plot showing compound 1-TTR conjugate fluorescence of media conditioned for 16 hr on HEK293 cells expressing FTTTRWT in the presence (red) or absence (black) of Tg (0.5 μM). Media were conditioned in the presence of Taf-SO3 (10 μM). Compound 1 (10 μM) was added to conditioned media for 16 hr prior to analysis by UPLC anion-exchange chromatography. (G) Graph showing normalized FTTTRWT tetramers in the conditioned media described in (F). Normalized tetramers were calculated by dividing the relative tetramer levels by the total amount of TTR in each sample measured by SDS-PAGE. This normalization is necessary to account for the reduced total FTTTRWT levels observed in Tg-treated cells. Independent quantifications of total FTTTRWT (measured by SDS-PAGE) and tetrameric FTTTRWT (measured by integrated compound 1-TTR conjugate fluorescence from UPLC traces) in these conditioned media are shown in Figure S5G. Error bars show SEM for n = 6. *p < 0.05.

References

    1. Brown MK, Naidoo N. The endoplasmic reticulum stress response in aging and age-related diseases. Front. Physiol. 2012;3:263. - PMC - PubMed
    1. Bulawa CE, Connelly S, Devit M, Wang L, Weigel C, Fleming JA, Packman J, Powers ET, Wiseman RL, Foss TR, et al. Tafamidis, a potent and selective transthyretin kinetic stabilizer that inhibits the amyloid cascade. Proc. Natl. Acad. Sci. USA. 2012;109:9629–9634. - PMC - PubMed
    1. Buxbaum JN, Tagoe C, Gallo G, Walker JR, Kurian S, Salomon DR. Why are some amyloidoses systemic? Does hepatic “chaperoning at a distance” prevent cardiac deposition in a transgenic model of human senile systemic (transthyretin) amyloidosis? FASEB J. 2012;26:2283–2293. - PMC - PubMed
    1. Chen JJ, Genereux JC, Qu S, Hulleman JD, Shoulders MD, Wiseman RL. ATF6 activation reduces the secretion and extracellular aggregation of destabilized variants of an amyloidogenic protein. Chem. Biol. 2014;21:1564–1574. - PMC - PubMed
    1. Chen JJ, Genereux JC, Wiseman RL. Endoplasmic reticulum quality control and systemic amyloid disease: impacting protein stability from the inside out. IUBMB Life. 2015;67:404–413. - PMC - PubMed