. 2016 Oct 20;64(2):282-293.
doi: 10.1016/j.molcel.2016.09.003. Epub 2016 Oct 6.

SONAR Discovers RNA-Binding Proteins from Analysis of Large-Scale Protein-Protein Interactomes

Affiliations

SONAR Discovers RNA-Binding Proteins from Analysis of Large-Scale Protein-Protein Interactomes

Kristopher W Brannan et al. Mol Cell. .

Abstract

RNA metabolism is controlled by an expanding, yet incomplete, catalog of RNA-binding proteins (RBPs), many of which lack characterized RNA binding domains. Approaches to expand the RBP repertoire to discover non-canonical RBPs are currently needed. Here, HaloTag fusion pull down of 12 nuclear and cytoplasmic RBPs followed by quantitative mass spectrometry (MS) demonstrates that proteins interacting with multiple RBPs in an RNA-dependent manner are enriched for RBPs. This motivated SONAR, a computational approach that predicts RNA binding activity by analyzing large-scale affinity precipitation-MS protein-protein interactomes. Without relying on sequence or structure information, SONAR identifies 1,923 human, 489 fly, and 745 yeast RBPs, including over 100 human candidate RBPs that contain zinc finger domains. Enhanced CLIP confirms RNA binding activity and identifies transcriptome-wide RNA binding sites for SONAR-predicted RBPs, revealing unexpected RNA binding activity for disease-relevant proteins and DNA binding proteins.

Keywords: RNA-binding proteins; machine-learning; protein-protein interaction networks; support vector machine.


Figures

Figure 1
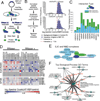
Figure 1. Identification of enriched RNA binding protein (RBP) protein interactors for HT-RBPs
A. HaloTag fusion pulldown and mass spectrometry (MS) experimental procedure. RBP-Halo Tag fusion protein constructs are transfected into HEK293T cells in replicate, cells are lysed, and half the lysate is treated with RNase. Affinity purified products are subjected to LC/MS/MS to identify protein interactors. B. Analysis flow-chart for post processing of MS data. Normalized spectral abundance counts (NSAF) enrichment score distribution compared to control (HaloTag alone) for hnRNPF pulldown. Grey data points (enrichment <0) represent background. For enrichment score higher in hnRNPF experiment (blue) a mean (μ, black dashed line) and standard deviation (σ) is computed. Significant interactions have enrichment score greater than 1.5 times the standard deviation (1.5σ, red dashed line). C. Number of enriched RNA-dependent and RNA-independent interactions for all HT-RBP baits. D. Heatmap of specific interactions displaying log2 fold enrichment over control for all HT-RBP baits. Interactions are grouped into NMD/EJC complexes and SF3B complexes. E. Exon junction (EJC) and Nonsense Mediated Decay (NMD) factors. Green indicates RNA-independent interactors, and light blue indicates RNA-dependent interactors for HT-UPF1 (dark blue). F. Gene ontology characterization of RNA-independent HT-RBP interactors. Shared and unique gene ontology terms displayed as interaction network, where red text nodes are HT-RBP baits, and central highlighted nodes are enriched terms shared by all baits (see also Table S2).
Figure 2
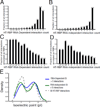
Figure 2. Super interactors are enriched for RBPs and candidate RBPs
A. Bar chart displays the fraction of all RNA-dependent interacting proteins that come up in 1 (unique interactor), and 2 to 12 HaloTag-RBP experiments (shared interactor). The number of interactors is given at the top of each bar. B. Bar chart displays the fraction of all RNA independent interacting proteins that come up in 1 (unique interactor), and 2 to 12 HaloTag-RBP experiments (shared interactor). The number of interactors is given at the top of each bar. C. Bar chart displays the fraction of unique (1 HT-RBP) and shared (2–12 HT-RBPs) RNA-dependent interacting proteins that are RBPs. The number of RBP interactors is given at the top of each bar. D. Bar chart displays the fraction of unique (1 HT-RBP) and shared (2–12 HT-RBPs) RNA independent interacting proteins that are RBPs. The number of RBP interactors is given at the top of each bar. E. Density of the calculated isoelectric points (pI) of RNA-dependent super interacting proteins (blue line), and RNA independent super interacting proteins (green line) compared to all proteins in the HT-RBP interaction set (gray dashed-line).
Figure 3
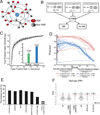
Figure 3. SONAR RBP classification approach
A. Diagram of neighborhood classification strategy. Protein of interest (POI) from a given interactome data set with its depicted neighborhood with interactions at different levels. 1st level interactions are direct interactions with POI, 2nd level interactions are interactions with 1st level neighbors, and 3rd level interactions are interactions with 2nd level neighbors. B. Determination of RBP classification score (RCS) as described in the Methods section. C. ROC-AUC analysis of classifier performance for human proteins from BioPlex network. Data are represented as mean +/− standard error of the mean (SEM). D. PRC-AUC analysis of classifier performance for human proteins from BioPlex network. E. Percent recall for SONAR trained on BioPlex PPI network for 6 RBP lists depicting different RBP annotations, and percent of annotated transcription factors (TF) predicted as candidate RBPs. F. Violin plots of RBP classification score (RCS) distributions for all human BioPlex interactors, non-RBP interactors within BioPlex, annotated RBP interactors within BioPlex, all HT interactors, HT-RNA-independent super interactors (HT-RI-SI) and HT-RNA-dependent super interactors (HT-RD-SI) within Bioplex. The median of the distributions are denoted with a square box (see also Table S4).
Figure 4
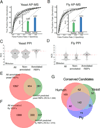
Figure 4. SONAR RBP classification scores (RCS) predict thousands of RBPs using PPI networks from multiple species
A. ROC-AUC analysis of classifier performance for yeast (Saccharomyces cerevisiae) proteins from BioGrid network. Data are represented as mean +/− standard error of the mean (SEM). B. ROC-AUC analysis of classifier performance for fly (Drosophila melanogaster) proteins from BioGrid network. Data are represented as mean +/− standard error of the mean (SEM). C. Violin plots of RBP classification score (RCS) distributions for all yeast BioGrid interactors, non-RBP interactors and annotated RBP interactors within yeast BioGrid interactors. D. Violin plots of RBP classification score (RCS) distributions for all fly BioGrid interactors, non-RBP interactors and annotated RBP interactors within BioGrid interactors. E. Venn diagram showing overlap between all annotated yeast RBPs and SONAR predicted yeast RBPs (RCS>1.066, threshold for false positive rate 0.1). F. Venn diagram showing overlap between all annotated fly RBPs and SONAR predicted fly RBPs (at RCS>1.072, threshold for false positive rate 0.1). G. Venn diagram showing overlap between conserved high RCS scoring predicted RBPs in human (light red), in yeast (green), and in fly (purple).
Figure 5
Figure 5. SONAR predicts human candidate RBPs enriched for proteins with zinc finger and DNA binding domains
A. Venn diagram showing overlap between all HT-RBP RNA-dependent SI proteins contained in the BioPlex network (light blue), all annotated RBPs contained in the BioPlex network (red), and all BioPlex SONAR predicted RBPs (at RCS>0.79; grey). B. Bar graph displaying −log10 p-values for GO Biological Process (BP) terms enriched in the set of RBP candidates (RCS>0.79 and not previously annotated as RBPs) compared to all interactors within the BioPlex dataset. C. Bar graph displaying −log10 p-values for INTERPRO protein domains enriched in the set of RBP candidates (RCS>0.79 and not previously annotated as RBPs) compared to all interactors within the BioPlex dataset.
Figure 6
Figure 6. Enhanced CLIP validation of candidate RBPs predicted by HT-RBP interactome and SONAR classification
A. Distributions across transcript regions for peaks enriched>8 fold over size-matched input (−log10 p>5) from eCLIP experiments for 4 RBP candidates. B. Motifs called and p-values for input normalized peaks described in Figure 5D. C. Genome browser track view of RANGAP1 eCLIP data in reads per million (RPM) showing enrichment above input on the intronless JUND gene locus. D. Genome browser track view of NUMA1 eCLIP data in reads per million (RPM) showing enrichment above input on a NUMA1 intron. E. Genome browser track view of RNF219 eCLIP data in reads per million (RPM) showing enrichment above input on the ACTG1 3’UTR region. F. Genome browser track view of ZNF184 eCLIP data in reads per million (RPM) showing enrichment above input on the CENPM distal intron.

References

    1. Baltz AG, Munschauer M, Schwanhausser B, Vasile A, Murakawa Y, Schueler M, Youngs N, Penfold-Brown D, Drew K, Milek M, et al. The mRNA-bound proteome and its global occupancy profile on protein-coding transcripts. Molecular cell. 2012;46:674–690. - PubMed
    1. Beckmann BM, Horos R, Fischer B, Castello A, Eichelbaum K, Alleaume AM, Schwarzl T, Curk T, Foehr S, Huber W, et al. The RNA-binding proteomes from yeast to man harbour conserved enigmRBPs. Nat Commun. 2015;6:10127. - PMC - PubMed
    1. Castello A, Fischer B, Eichelbaum K, Horos R, Beckmann BM, Strein C, Davey NE, Humphreys DT, Preiss T, Steinmetz LM, et al. Insights into RNA biology from an atlas of mammalian mRNA-binding proteins. Cell. 2012;149:1393–1406. - PubMed
    1. Castello A, Fischer B, Hentze MW, Preiss T. RNA-binding proteins in Mendelian disease. Trends in genetics : TIG. 2013;29:318–327. - PubMed
    1. Conrad T, Albrecht AS, de Melo Costa VR, Sauer S, Meierhofer D, Orom UA. Serial interactome capture of the human cell nucleus. Nat Commun. 2016;7:11212. - PMC - PubMed

MeSH terms