. 2016 Nov 8;7(5):869-883.
doi: 10.1016/j.stemcr.2016.09.002. Epub 2016 Oct 6.

Early Development of Definitive Erythroblasts from Human Pluripotent Stem Cells Defined by Expression of Glycophorin A/CD235a, CD34, and CD36

Affiliations

Early Development of Definitive Erythroblasts from Human Pluripotent Stem Cells Defined by Expression of Glycophorin A/CD235a, CD34, and CD36

Bin Mao et al. Stem Cell Reports. .

Abstract

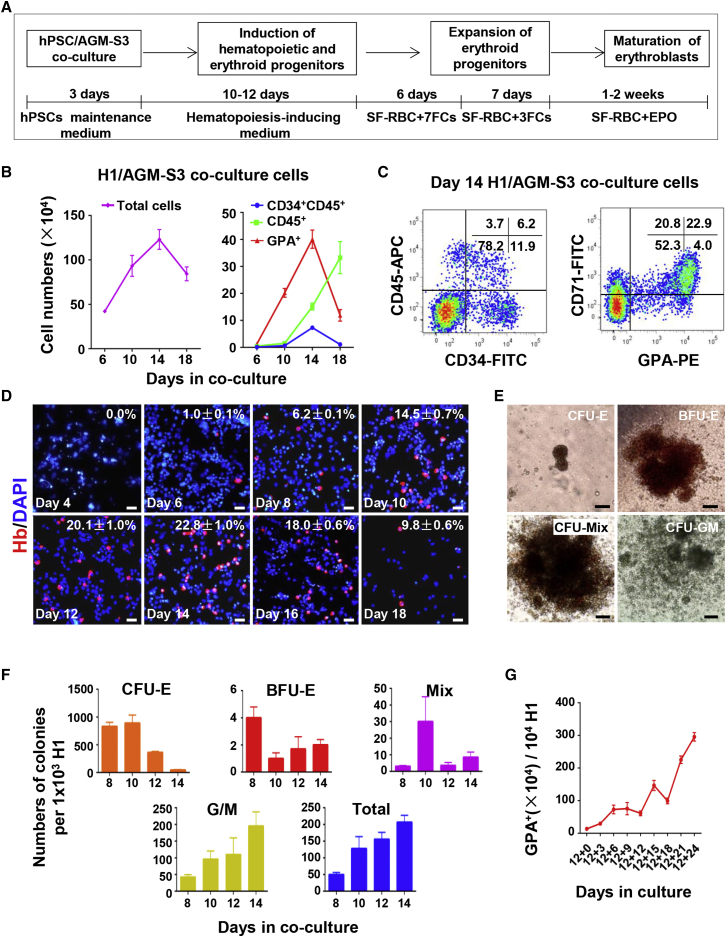
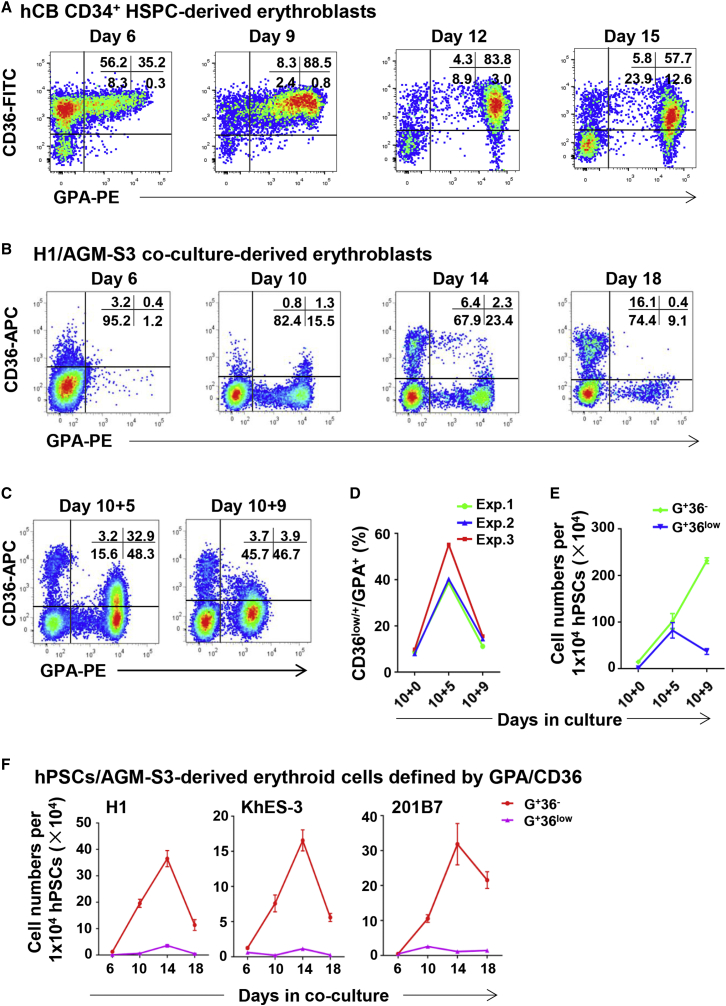
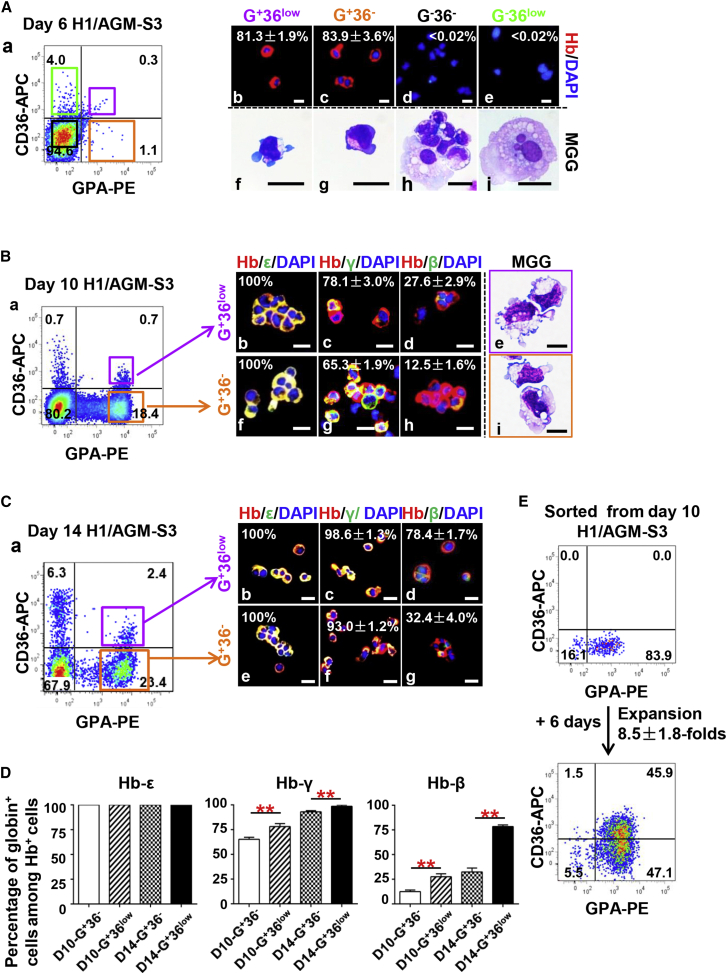
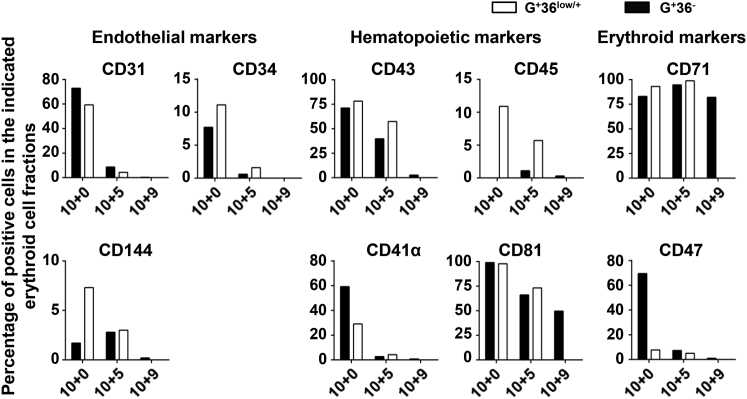
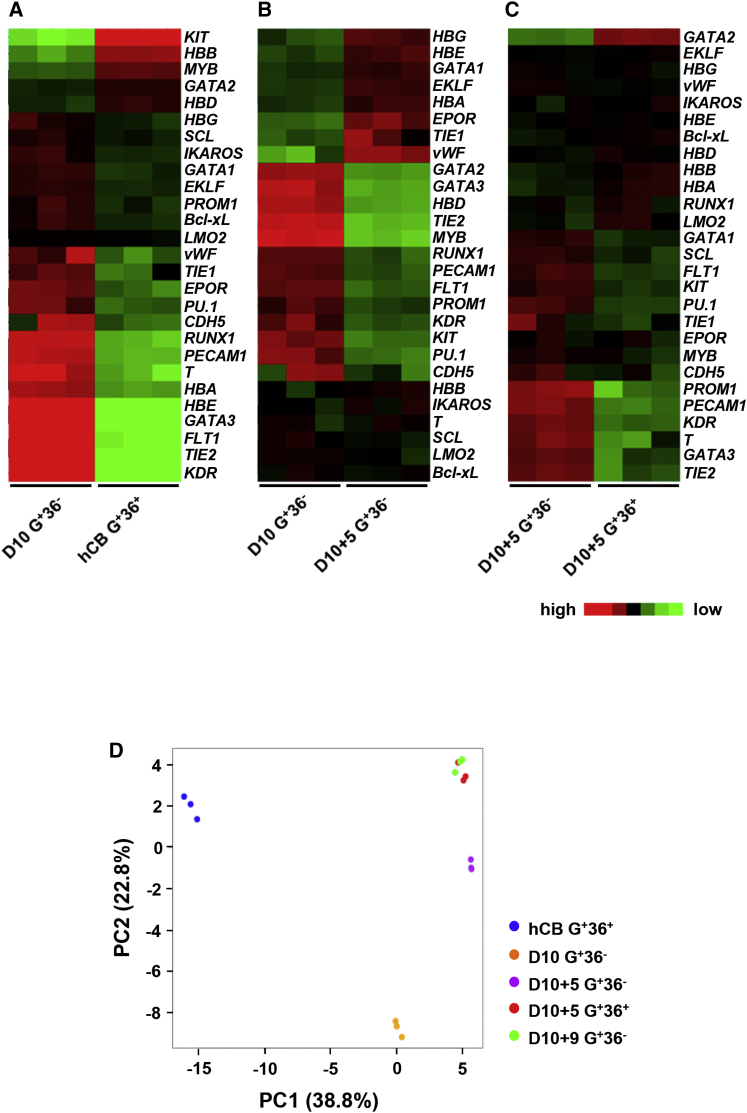
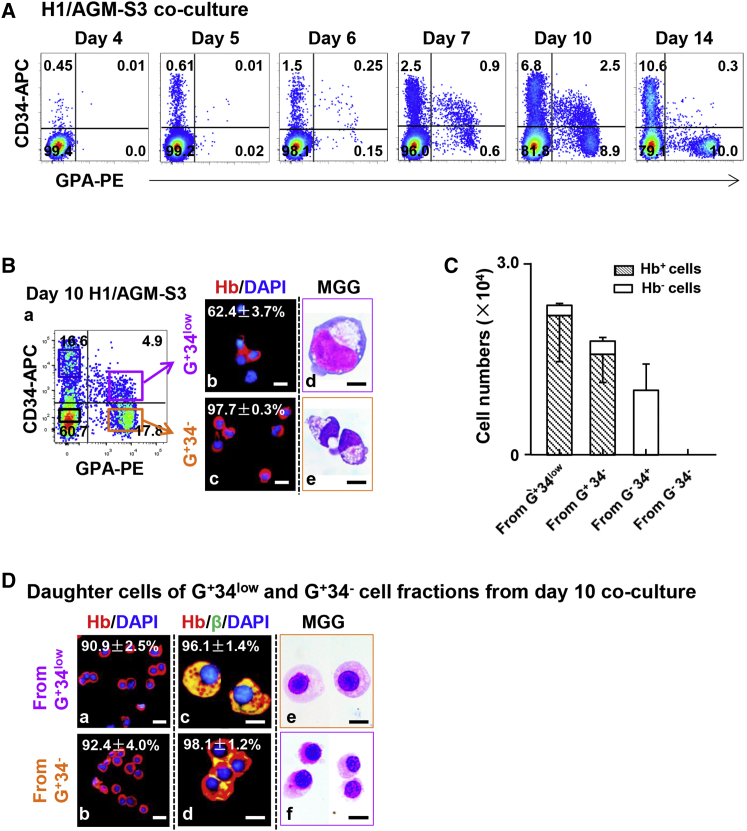
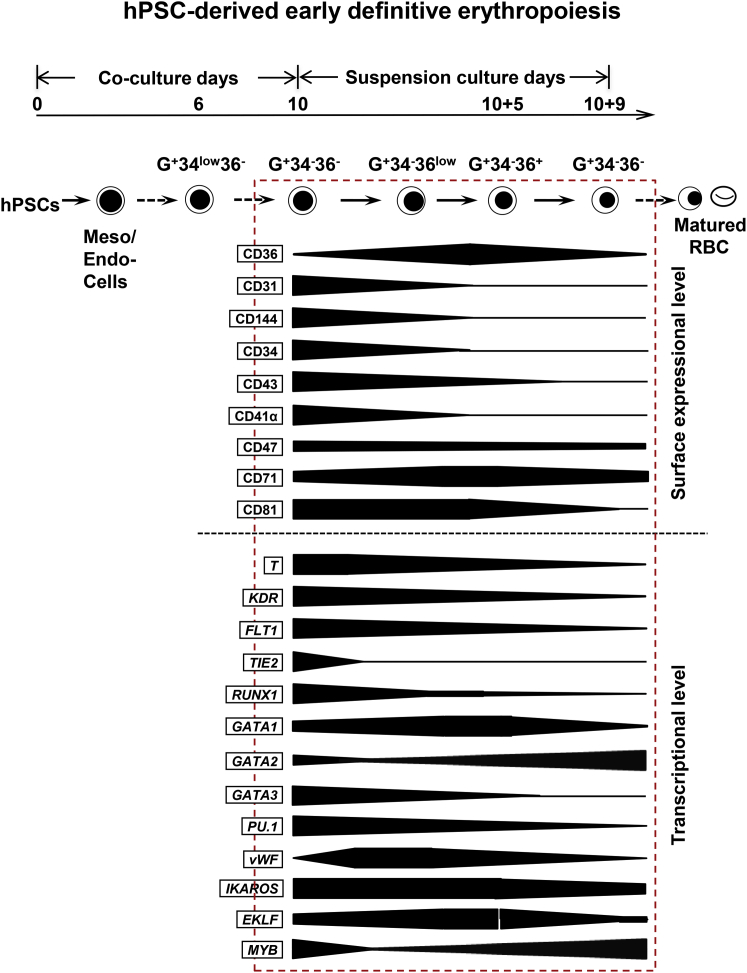
The development of human erythroid cells has been mostly examined in models of adult hematopoiesis, while their early derivation during embryonic and fetal stages is largely unknown. We observed the development and maturation of erythroblasts derived from human pluripotent stem cells (hPSCs) by an efficient co-culture system. These hPSC-derived early erythroblasts initially showed definitive characteristics with a glycophorin A+ (GPA+) CD34lowCD36- phenotype and were distinct from adult CD34+ cell-derived ones. After losing CD34 expression, early GPA+CD36- erythroblasts matured into GPA+CD36low/+ stage as the latter expressed higher levels of β-globin along with a gradual loss of mesodermal and endothelial properties, and terminally suppressed CD36. We establish a unique in vitro model to trace the early development of hPSC-derived erythroblasts by serial expression of CD34, GPA, and CD36. Our findings may provide insight into the understanding of human early erythropoiesis and, ultimately, therapeutic potential.

Keywords: CD34; CD36; GPA; development; endothelial cells; erythroblasts; erythropoiesis; hESC; hematopoiesis; hiPSC.


Figures

Figure 1
Figure 1
Generation of Erythroid Cells Derived from hPSC/AGM-S3 Co-culture (A) Schematic showing the strategy for generation of erythroid cells from hPSCs via co-culture with AGM-S3 cells. (B) Cells were digested with 0.25% trypsin/EDTA. The figure shows numbers of total cells, HSPCs (CD34+CD45+), hematopoietic cells (CD45+), and GPA+ cells derived from H1 cells in co-culture over time (independent experiments, n = 3; mean ± SD). There were 1 × 104 H1 cells initially. The total cell numbers exclude the numbers of AGM-S3 cells in co-culture. (C) Representative flow cytometry data showing co-expression of CD34/CD45 and GPA/CD71 in day-14 co-culture. CD34 and CD45 are important hematopoietic markers while GPA and CD71 are markers of erythroid cells. (D) Immunofluorescence (IF) analysis showing human hemoglobin expression in H1/AGM-S3 co-cultured cells obtained every other day from day 4 to day 18 (independent experiments, n = 3; mean ± SD). Scale bars, 50 μm. (E) Typical morphology of hematopoietic colonies was presented. Total day-12 H1/AGM-S3 co-cultured cells were recultured in semi-solid culture. Scale bars, 100 μm. (F) Total H1/AGM-S3 co-cultured cells from day 8 to day 14 were recultured in semi-solid culture. Numbers of colonies derived from 1 × 103 H1 cells initially (independent experiments, n = 3; mean ± SD). Total colony numbers include the numbers of all colonies except CFU-E colonies. (G) Proliferation of GPA+ cells in suspension culture. There were 1 × 104 H1 cells initially. Total day-12 H1/AGM-S3 co-cultured cells were resuspended in RBC differentiation medium for further expansion and maturation of erythroid cells (independent experiments, n = 3; mean ± SD). See also Figure S1.
Figure 2
Figure 2
Expression Process of CD36 on Erythroid Cells of Different Origins (A–C) Representative flow cytometry profiles showing expression of CD36 on GPA+ cells derived from hCB-CD34+ HSPCs (A), H1/AGM-S3 co-culture (B), and day-10 + 5 and 10 + 9 suspension cultures (C). (D) The percentage of CD36low/+ cells among GPA+ cells at day 10, day 10 + 5, and day 10 + 9 cultures. Data are representative of three independent experiments. (E) Proliferation of GPA+CD36low (G+36low) and GPA+CD36 (G+36) cell fractions at day 10, 10 + 5, and 10 + 9 derived from 1 × 104 H1 cells (independent experiments, n = 3; mean ± SD). (F) Proliferation of G+36low and G+36 cell fractions in co-culture derived from 1 × 104 H1, KhES-3, and 201B7 cells on different days (independent experiments, n = 3; mean ± SD). See also Figure S2.
Figure 3
Figure 3
Characteristics of GPA+CD36low and GPA+CD36 Erythroid Cell Fractions Sorted from H1/AGM-S3 Co-culture (A) (a) Four cell fractions defined by expression of GPA and CD36 were sorted by FACS from day-6 H1/AGM-S3 co-culture. (b–e) IF analysis showing human hemoglobin expression in each cell fraction (independent experiments, n = 3; mean ± SD). Scale bars, 20 μm. (f–i) MGG staining showing typical morphology of each cell fraction. Scale bars, 25 μm. (B) (a) G+36low and G+36 cell fractions were sorted by FACS from day-10 H1/AGM-S3 co-culture. IF analysis showing co-expression of human hemoglobin and ɛ-, γ-, and β-globins in G+36low (b–d) and G+36 (f–h) cell fractions (independent experiments, n = 3; mean ± SD). Scale bars, 20 μm. (e and i) MGG staining showing typical morphology of G+36low and G+36 cell fractions. Scale bars, 10 μm. (C) (a) G+36low and G+36 cell fractions were sorted by FACS from day-14 H1/AGM-S3 co-culture. IF analysis showing co-expression of human hemoglobin and ɛ-, γ-, and β-globins in G+36low (b–d) and G+36 (e–g) cell fractions (independent experiments, n = 3; mean ± SD). Scale bars, 20 μm. (D) The percentages of cells co-expressing hemoglobin and ɛ-, γ-, and β-globins among erythroid cell fractions (independent experiments, n = 3; mean ± SD; ∗∗p < 0.01). (E) Flow cytometry profiles showing the purity of sorted G+36 cells from day-10 H1/AGM-S3 and expression of CD36 on their progeny after they were recultured in SF-RBC+7FCs medium for an additional 6 days. The total number of cells expanded 8.5 ± 1.8-fold (independent experiments, n = 3; mean ± SD).
Figure 4
Figure 4
Phenotypic Expressions of Indicated Erythroid Cell Fractions Defined by GPA and CD36 Flow cytometry analysis showing representative phenotypic expression of erythroblast fractions G+36low/+ and G+36 at day 10 and day 10 + 5 as well as G+ 36 cells at day 10 + 9 during a single culture.
Figure 5
Figure 5
Heatmaps and PCA for qRT-PCR Results of hESC-Derived Erythroid Cell Fractions Defined by Expression of GPA and CD36 (A–C) Pairwise comparison of transcription levels for selected genes in the erythroid cell fractions. Heatmaps of selected genes associated with mesodermal, endothelial, hematopoietic, and erythroid cells. In each row, red, black, and green reflect high, medium, and low expression of the given gene, respectively (independent experiments, n = 3). (D) PCA plots of three biological replicates of the five erythroid cell fractions. See also Figure S3.
Figure 6
Figure 6
Characteristics of GPA+CD34low and GPA+CD34 Cell Fractions in H1/AGM-S3 Co-culture (A) Representative flow cytometry data showing co-expression of CD34 and GPA on co-cultured cells over time. The co-cultured cells were digested by 0.1% trypsin/EDTA. (B) G+34low and G+34 cell fractions in day-10 H1/AGM-S3 co-culture. (a) Cell fractions defined by expression of GPA and CD34 were sorted by FACS from day-10 H1/AGM-S3 co-culture. (b and c) IF analysis showing co-expression of human hemoglobin in G+34low and G+34 cell fractions (independent experiments, n = 3; mean ± SD). Scale bars, 20 μm. (d and e) MGG staining showing represent morphology of G+34low and G+34 cell fractions, respectively. Scale bars, 10 μm. (C) Cell fractions defined by GPA and CD34 were sorted from day-10 H1/AGM-S3 co-culture and recultured in myeloid cells supporting medium. Original 1 × 104 cells were replated in one 24-plate well. After 8 days, hemoglobin+ and hemoglobin cell numbers derived from G+34low, G+34, G34+, and G34 cell fractions were presented, respectively (independent experiments, n = 3; mean ± SD). (D) Daughter cells of G+34low and G+34 cells sorted from day-10 H1/AGM-S3 co-culture. (a and b) IF analysis showing expression of human hemoglobin in the daughter cells (independent experiments, n = 3; mean ± SD). Scale bars, 20 μm. (c and d) IF analysis showing co-expression of human hemoglobin and β-globin in the daughter cells (independent experiments, n = 3; mean ± SD). Scale bars, 10 μm. (e and f) MGG staining showing typical morphology of the daughter cells. Scale bars, 10 μm. See also Figure S4.
Figure 7
Figure 7
Model of Early Definitive Erythroblasts Derived from hPSCs Defined by Expression of CD34, GPA, and CD36 There is a specific development stage during erythropoiesis from hPSCs/AGM-S3 co-culture. Early definitive erythroblasts are derived from G+34low36, which occurred by day 6. They develop to G+3436, G+3436low/+, and G+3436 cells in sequence. During G+3436low/+ cells mature into G+3436 cells, flow cytometry data and gene expression profiles show hPSC-derived early definitive erythroblasts mature in association with decreases in endothelial and lymphoid potentials.

References

    1. Bottardi S., Ross J., Bourgoin V., Fotouhi-Ardakani N., Affar el B., Trudel M., Milot E. Ikaros and GATA-1 combinatorial effect is required for silencing of human gamma-globin genes. Mol. Cell. Biol. 2009;29:1526–1537. - PMC - PubMed
    1. Chen K., Liu J., Heck S., Chasis J.A., An X., Mohandas N. Resolving the distinct stages in erythroid differentiation based on dynamic changes in membrane protein expression during erythropoiesis. Proc. Natl. Acad. Sci. USA. 2009;106:17413–17418. - PMC - PubMed
    1. Dijon M., Bardin F., Murati A., Batoz M., Chabannon C., Tonnelle C. The role of Ikaros in human erythroid differentiation. Blood. 2008;111:1138–1146. - PubMed
    1. Fajtova M., Kovarikova A., Svec P., Kankuri E., Sedlak J. Immunophenotypic profile of nucleated erythroid progenitors during maturation in regenerating bone marrow. Leuk. Lymphoma. 2013;54:2523–2530. - PubMed
    1. Fujimi A., Matsunaga T., Kobune M., Kawano Y., Nagaya T., Tanaka I., Iyama S., Hayashi T., Sato T., Miyanishi K. Ex vivo large-scale generation of human red blood cells from cord blood CD34+ cells by co-culturing with macrophages. Int. J. Hematol. 2008;87:339–350. - PubMed

MeSH terms