. 2016 Nov 8;7(5):840-853.
doi: 10.1016/j.stemcr.2016.09.005. Epub 2016 Oct 6.

Endogenous DNA Damage Leads to p53-Independent Deficits in Replicative Fitness in Fetal Murine Fancd2-/- Hematopoietic Stem and Progenitor Cells

Affiliations

Endogenous DNA Damage Leads to p53-Independent Deficits in Replicative Fitness in Fetal Murine Fancd2-/- Hematopoietic Stem and Progenitor Cells

Young Me Yoon et al. Stem Cell Reports. .

Abstract

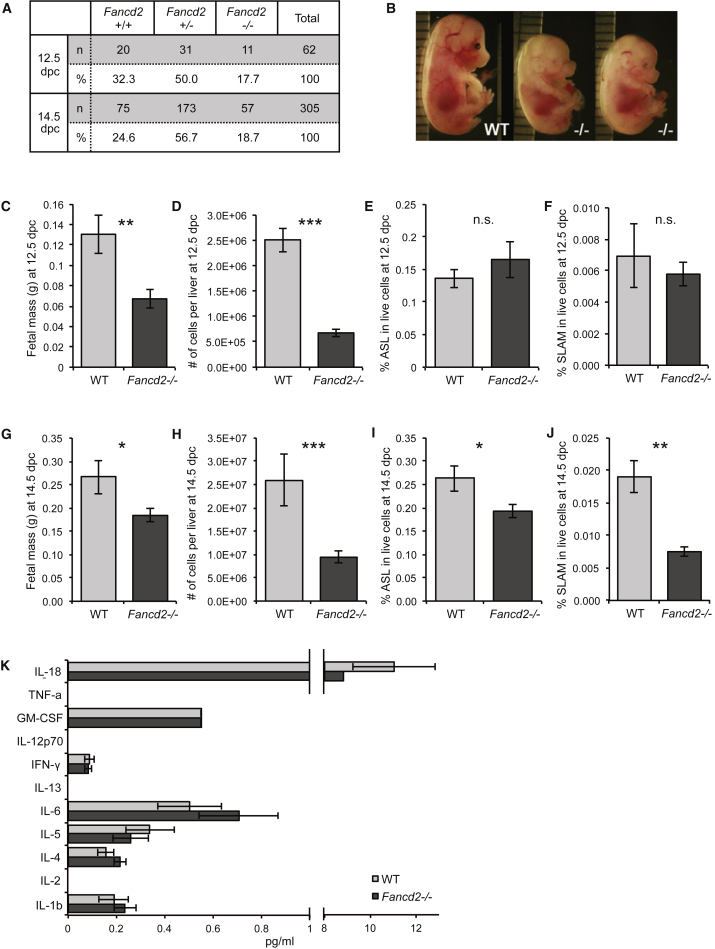
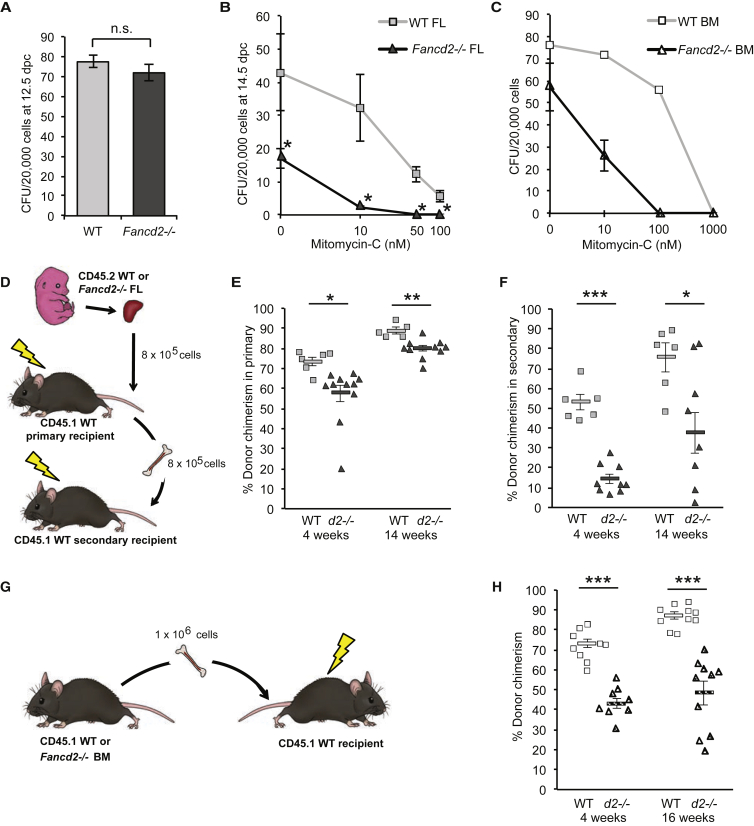
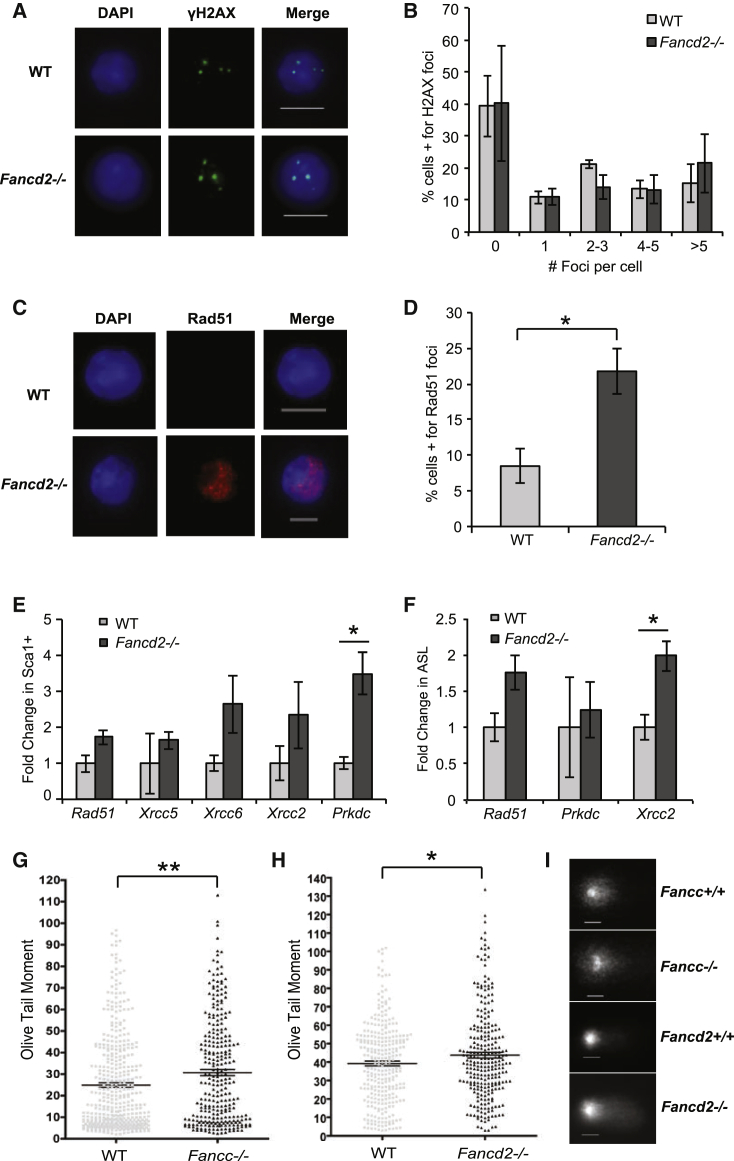
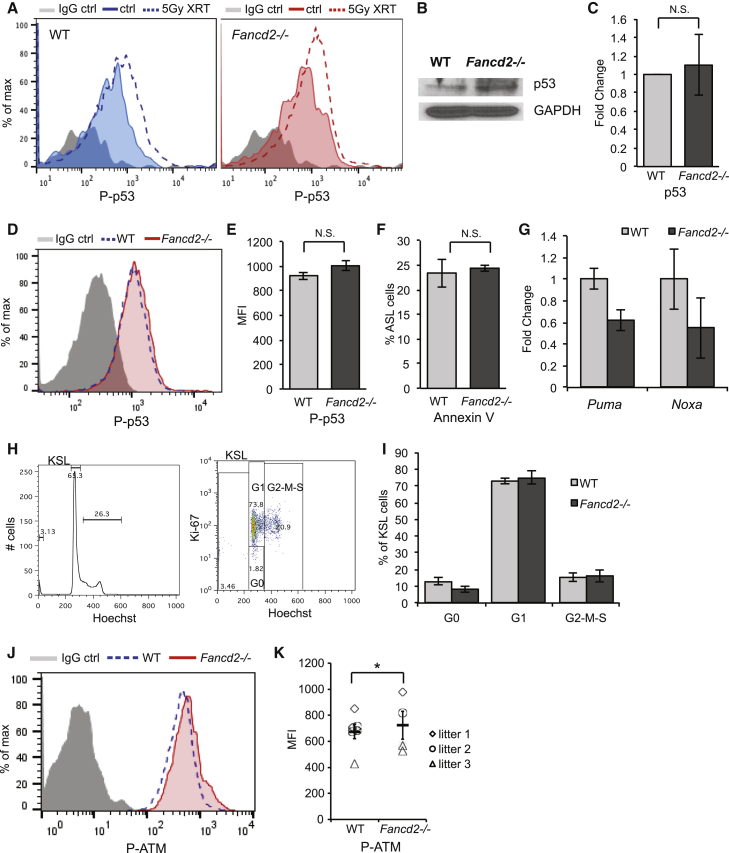
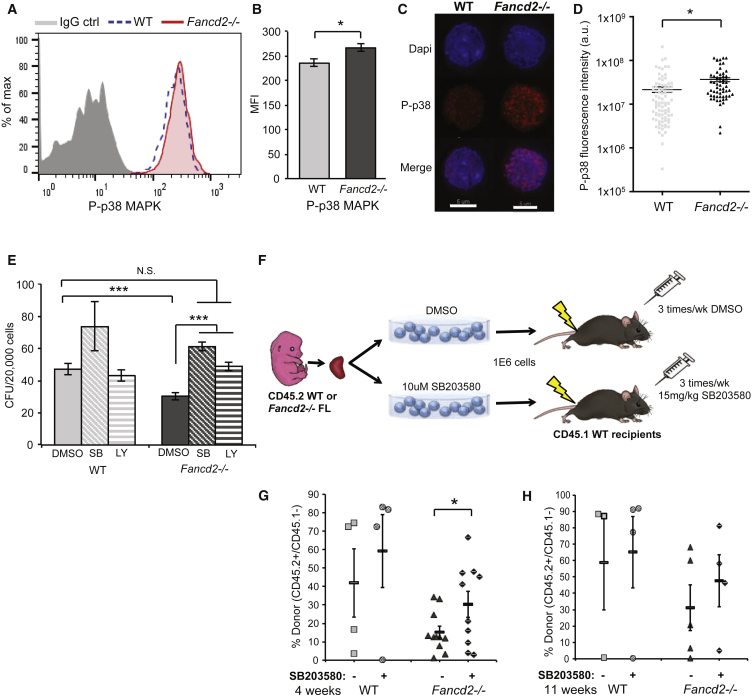
Our mechanistic understanding of Fanconi anemia (FA) pathway function in hematopoietic stem and progenitor cells (HSPCs) owes much to their role in experimentally induced DNA crosslink lesion repair. In bone marrow HSPCs, unresolved stress confers p53-dependent apoptosis and progressive cell attrition. The role of FA proteins during hematopoietic development, in the face of physiological replicative demand, remains elusive. Here, we reveal a fetal HSPC pool in Fancd2-/- mice with compromised clonogenicity and repopulation. Without experimental manipulation, fetal Fancd2-/- HSPCs spontaneously accumulate DNA strand breaks and RAD51 foci, associated with a broad transcriptional DNA-damage response, and constitutive activation of ATM as well as p38 stress kinase. Remarkably, the unresolved stress during rapid HSPC pool expansion does not trigger p53 activation and apoptosis; rather, it constrains proliferation. Collectively our studies point to a role for the FA pathway during hematopoietic development and provide a new model for studying the physiological function of FA proteins.

Keywords: Fanconi anemia; bone marrow failure; development; hematopoiesis; stem cells.


Figures

Figure 1
Figure 1
Fancd2/ Fetal Mice Have a Significantly Diminished Hematopoietic Compartment and Fewer HSCs (A) Offspring yields of each genotype at 12.5 and 14.5 days post coitum (dpc) from Fancd2+/ × Fancd2+/ crosses. (B) Common craniofacial defects seen in Fancd2/ fetal mice. (C–F) Characterizations of WT and Fancd2/ fetal mice at 12.5 dpc: fetus weight (p = 0.01), liver cellularity (p < 0.001), percentage of ASL HSPCs, and percentage of SLAM HSCs in live FL cells (n = 8 WT and 7 knockout [KO] from four litters). (G–J) Characterizations of WT and Fancd2/ fetal mice at 14.5 dpc: fetus weight (p = 0.04, n = 7 WT and 8 KO from five litters), liver cellularity (p = 0.001, n = 7 WT and 14 KO from five litters), percentage of ASL HSPCs (p = 0.03, n = 10 WT and 11 KO from five litters), and percentage of SLAM HSCs in live FL cells (p = 0.01, n = 4 WT and 3 KO from two2 litters). (K) Cytokine profiling of ASL-sorted WT and Fancd2/ unfractionated FL cells (n = 3 WT and 5 KO from two litters; samples that yielded lower than the detection threshold are excluded, hence a statistical test could not be performed). Error bars reflect SEM, and asterisks indicate p ≤ 0.05, ∗∗p ≤ 0.01, and ∗∗∗p ≤ 0.001. n.s., not significant.
Figure 2
Figure 2
Defects in Fancd2/ HSPC Frequency and Repopulating Capacity Persist from Fetal Development through Adulthood (A) Colony-forming units per 20,000 unfractionated FL cells at 12.5 dpc (n = 5 WT and 3 KO from two litters). (B) Colony-forming units per 20,000 unfractionated FL cells at 14.5 dpc with different doses of mitomycin C treatment (p < 0.05 between WT and Fancd2/ at each concentration of MM-C, n = 5–6 WT per condition and 4–6 KO per condition from five litters). (C) Colony-forming units per 20,000 adult whole bone marrow cells (n = 2 WT and 4 KO). (D) Schema for FL transplantation into primary and secondary recipients. For the primary, each FL donor was transplanted into three recipients (donor n = 2 WT and 4 KO FLs from two litters). In the subsequent transplantation, bone marrow from two WT to three KO primary recipients were injected into three recipients per donor. (E) CD45.2 chimerism in peripheral blood of primary recipients at 4 weeks (p = 0.02) and 14 weeks (p = 0.006) post transplant. (F) CD45.2 chimerism in peripheral blood of secondary recipients at 4 weeks (p < 0.001) and 14 weeks (p = 0.02) post transplant. (G) Transplantation schema for adult bone marrow cells. Each donor was transplanted into five recipients (donor n = 2 WT and 2 KO). (H) CD45.2 chimerism in peripheral blood (p < 0.001 at both time points). Error bars reflect SEM, and asterisks indicate p ≤ 0.05, ∗∗p ≤ 0.01, and ∗∗∗p ≤ 0.001.
Figure 3
Figure 3
DNA-Damage Responses Are Induced, and the Strand Breaks Are Accumulated in FA FL HSPCs (A) Representative γH2AX foci in SCA1+ FL cells (60× objective lens; the scale bar represents 5 μm). (B) Quantification of γH2AX foci per cell (n = 3 WT and 3 KO from three litters). (C) Representative RAD51 foci in SCA1+ FL (60× objective lens; the scale bar represents 5 μm). (D) Quantification of cells positive for foci (p = 0.02, n = 6 WT and 6 KO from three litters). (E) Expression of DDR genes in SCA1+ FL cells (p = 0.08, 0.44, 0.06, 0.22, and 0.005, respectively; n = 4 WT and 4 KO from three litters). (F) Expression of selected DDR genes in ASL-sorted FL cells (p = 0.08, 0.5, 0.04 respectively; n = 3 WT and 3 KO from two litters). (G) Olive tail moment of 428 SCA1+ FL cells from seven WT animals and 288 SCA1+ FL cells from five Fancc/ animals from four litters (p = 0.003). (H) Olive tail moment of 289 SCA1+ FL cells from five WT animals and 267 SCA1+ FL cells from five Fancd2/ animals from four litters (p = 0.04). (I) Representative alkaline comets of SCA1+ FL cells (20× objective lens; the scale bar represents 20 μm). Error bars reflect SEM, and asterisks indicate p ≤ 0.05 and ∗∗p ≤ 0.01.
Figure 4
Figure 4
FA Fetal HSPC Attrition Is Not Associated with p53-Mediated Apoptosis or Cell-Cycle Arrest (A) Representative histogram showing the activation of phospho-p53 (ser15) after 5 Gy irradiation in WT and Fancd2/ FL, respectively, compared with the non-irradiated controls. (B) Immunoblots for p53 and GAPDH from whole FL lysates (bands are representative of multiple experiments, n = 3). (C) Densitometry of p53 protein bands from Fancd2/ whole FL compared with WT, normalized to GAPDH (p = 0.78, n = 7 WT and 4 KO from 3 litters). (D) Representative histogram showing the intracellular staining of phospho-p53 (ser15) in WT and Fancd2/ SCA1+ FL cells. (E) Expression of phospho-p53 (ser15) in WT and Fancd2/ SCA1+ FL cells as the mean frequency of intensity (p = 0.16, n = 5 WT and 3 KO from two litters). (F) Percentage of ASL cells positive for annexin V (p = 0.75, n = 5 WT and 5 KO from two litters). (G) Expression of Puma and Noxa in WT and Fancd2/ ASL FL cells by real-time qPCR (p = 0.02 and 0.16, respectively; n = 3 WT and 3 KO from two litters). (H) Representative histogram and dot plot demonstrating Hoechst and Ki-67 staining for the cell-cycle analysis of Fancd2/ KSL FL. (I) Comparison between WT and Fancd2/ FL KSL cells in G0, G1, and G2-M-S phases of the cell cycle (n = 11 WT, 8 KO from four litters). (J) Representative histogram showing the intracellular staining of phospho-ATM (Ser1981) in WT and Fancd2/ KSL FL cells. (K) Expression of phospho-ATM (Ser1981) in WT and Fancd2/ KSL FL cells as the mean frequency of intensity (p = 0.03, data were paired by the litter for t test; n = 2 WT, 1 KO in litter 1; n = 3 WT, 1 KO in litter 2; n = 1 WT, 2 KO in litter 3). Error bars reflect SEM and asterisks indicate p ≤ 0.05. N.S., not significant.
Figure 5
Figure 5
Inhibiting Constitutively Activated p38 MAPK Increases Clonogenicity in Fancd2/ FL (A) Representative histogram showing the intracellular staining of phospho-p38 MAPK (T180/Y182) in WT and Fancd2/ KSL FL cells. (B) Expression of phospho-p38 MAPK (T180/Y182) in WT and Fancd2/ KSL FL cells as the mean frequency of intensity (p = 0.03, n = 4 WT and 4 KO from two litters). (C) Representative images showing the immunofluorescence staining of phospho-p38 MAPK (T180/Y182) in WT and Fancd2/ SCA1+ FL cells (60× objective lens; the scale bar represents 5 μm). (D) Immunofluorescence intensity of phospho-p38 MAPK (T180/Y182) in WT and Fancd2/ SCA1+ FL cells (p = 0.003, n = 5 WT and 4 KO from three litters). (E) WT and Fancd2/ colony-forming hematopoietic progenitor cell frequency with and without p38 MAPK inhibitors, 10 μM SB203580, and 100 nM LY2228820 (p ≤ 0.001 between WT and Fancd2/ at baseline with DMSO, p ≤ 0.001 between Fancd2/ baseline and both inhibitor conditions, n = 4–10 FL per condition from nine litters). (F) Schema for transplantation of FL cells and p38 MAPK inhibitor treatment. (G) CD45.2 chimerism in peripheral blood of FL recipients with or without SB203580 treatment at 4 weeks post transplant (p = 0.03, one-tailed t test between DMSO- and SB-treated Fancd2/ recipients; n = 4 WT + DMSO, 4 WT + SB, 11 KO + DMSO, 10 KO + SB). (H) CD45.2 chimerism in peripheral blood of FL recipients with or without SB203580 treatment at 11 weeks post transplant (n = 3 WT + DMSO, 4 WT + SB 5 KO + DMSO, 4 KO + SB). Error bars reflect SEM, and asterisks indicate p ≤ 0.05 and ∗∗∗p ≤ 0.001. N.S., not significant.

Similar articles

Cited by

References

    1. Alvarez S., Diaz M., Flach J., Rodriguez-Acebes S., Lopez-Contreras A.J., Martinez D., Canamero M., Fernandez-Capetillo O., Isern J., Passegue E. Replication stress caused by low MCM expression limits fetal erythropoiesis and hematopoietic stem cell functionality. Nat. Commun. 2015;6:8548. - PMC - PubMed
    1. Anur P., Yates J., Garbati M.R., Vanderwerf S., Keeble W., Rathbun K., Hays L.E., Tyner J.W., Svahn J., Cappelli E. p38 MAPK inhibition suppresses the TLR-hypersensitive phenotype in FANCC- and FANCA-deficient mononuclear phagocytes. Blood. 2012;119:1992–2002. - PMC - PubMed
    1. Auerbach A.D., Liu Q., Ghosh R., Pollack M.S., Douglas G.W., Broxmeyer H.E. Prenatal identification of potential donors for umbilical cord blood transplantation for Fanconi anemia. Transfusion. 1990;30:682–687. - PubMed
    1. Bakker S.T., Passegue E. Resilient and resourceful: genome maintenance strategies in hematopoietic stem cells. Exp. Hematol. 2013;41:915–923. - PMC - PubMed
    1. Beerman I., Seita J., Inlay M.A., Weissman I.L., Rossi D.J. Quiescent hematopoietic stem cells accumulate DNA damage during aging that is repaired upon entry into cell cycle. Cell Stem Cell. 2014;15:37–50. - PMC - PubMed

Publication types

MeSH terms

Substances