. 2016 Nov 1;126(11):4157-4173.
doi: 10.1172/JCI87252. Epub 2016 Oct 10.

Tumor-associated macrophages drive spheroid formation during early transcoelomic metastasis of ovarian cancer

Tumor-associated macrophages drive spheroid formation during early transcoelomic metastasis of ovarian cancer

Mingzhu Yin et al. J Clin Invest. .

Abstract

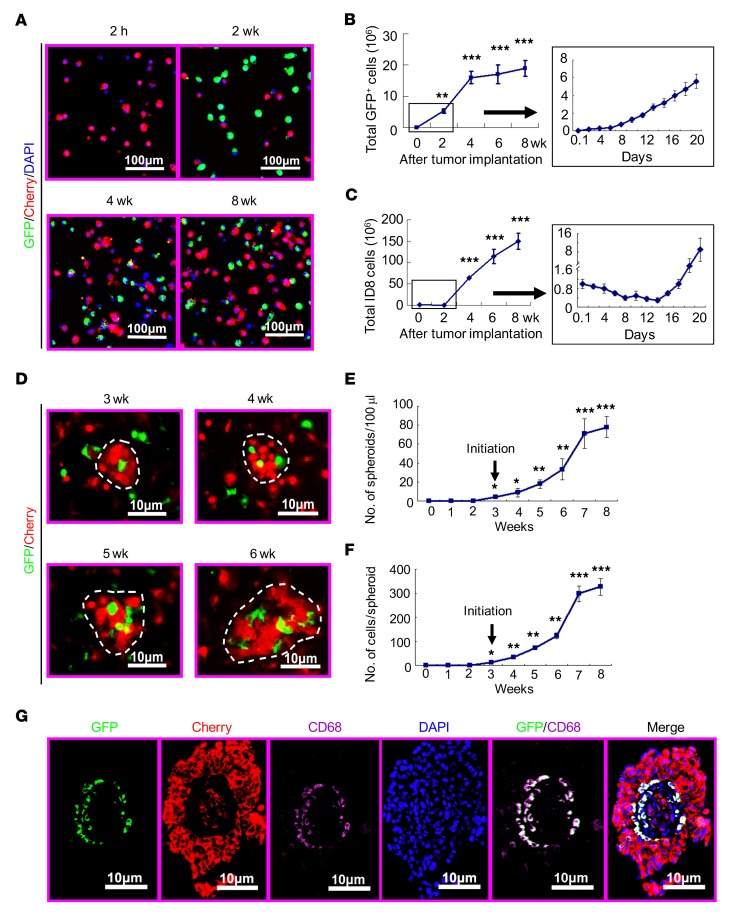
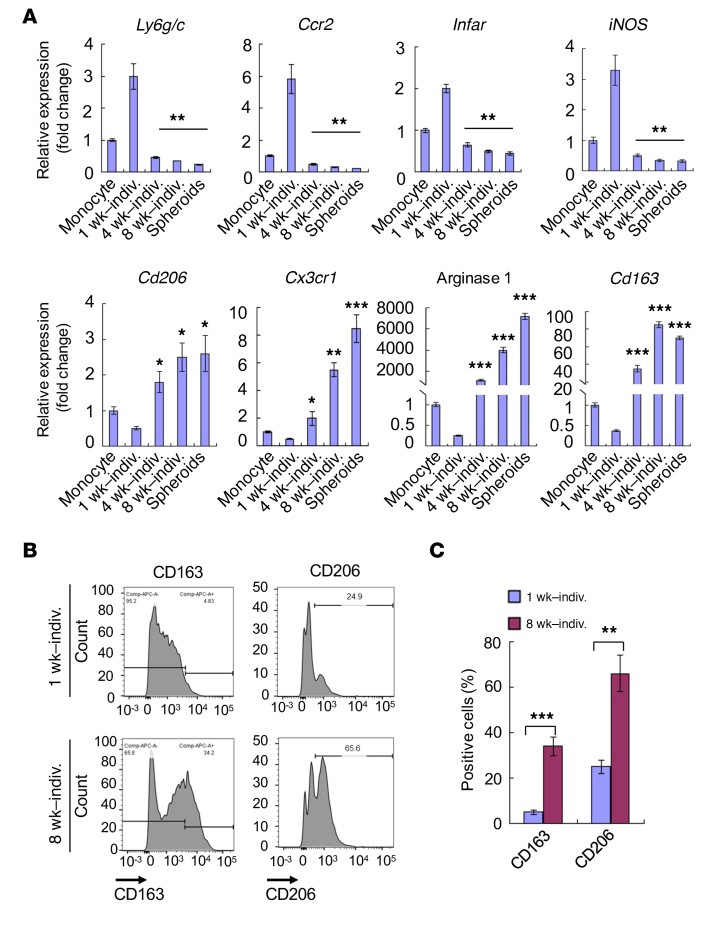
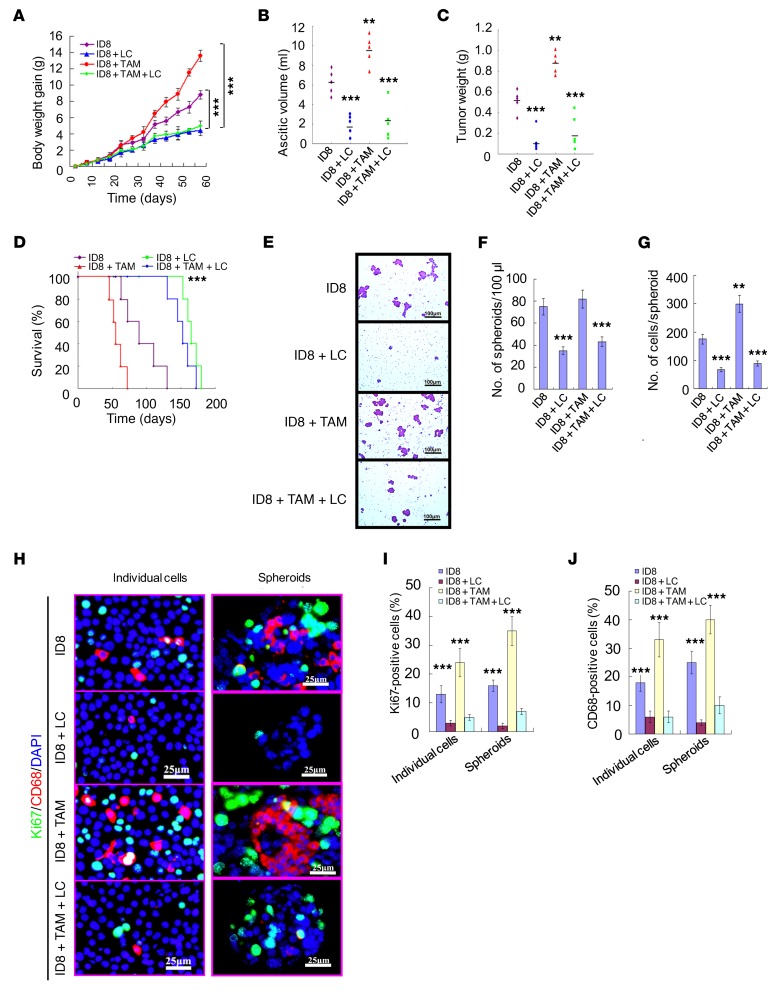
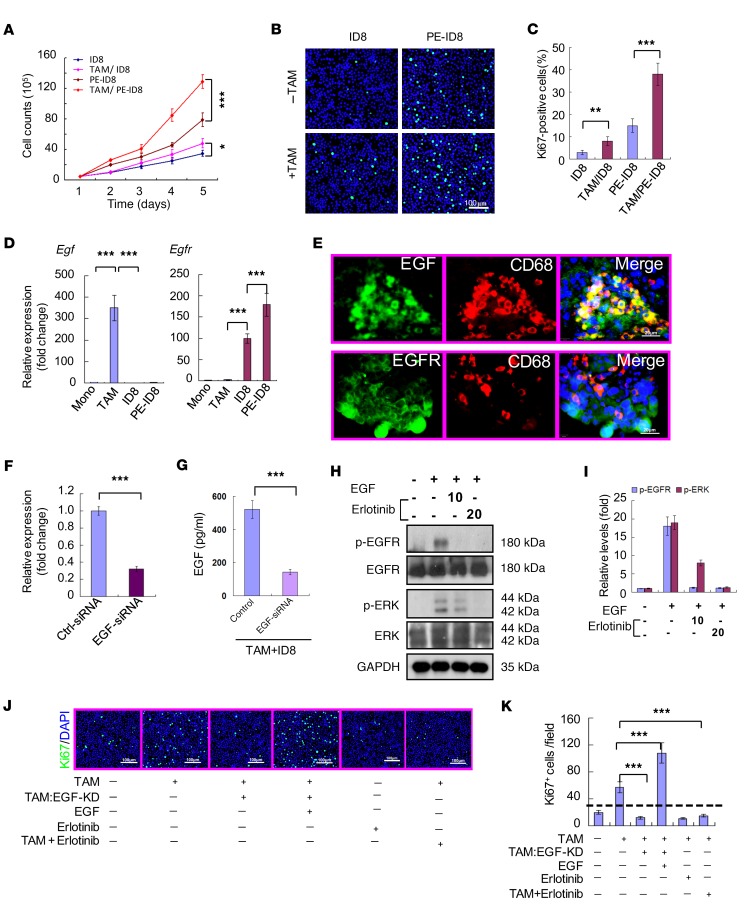
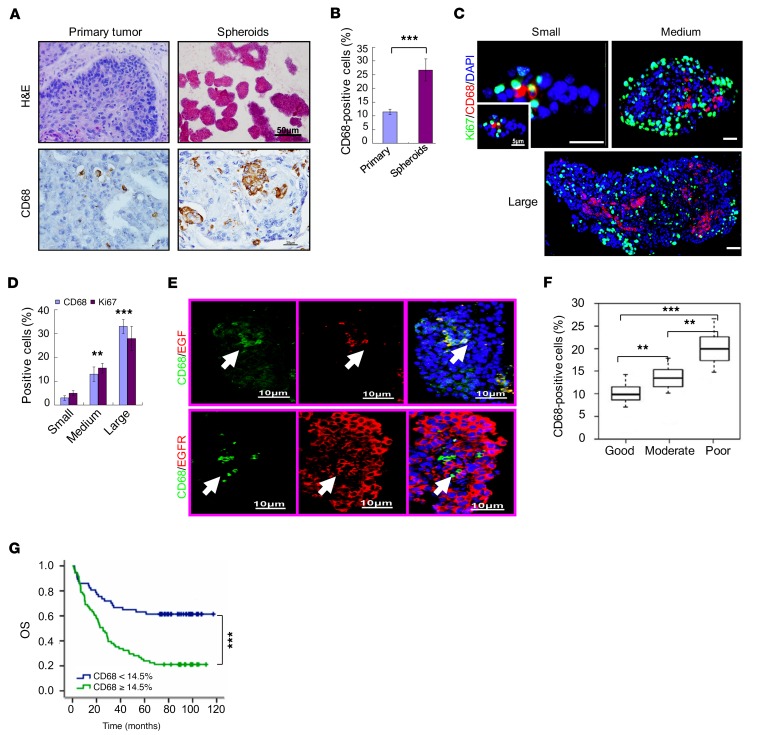
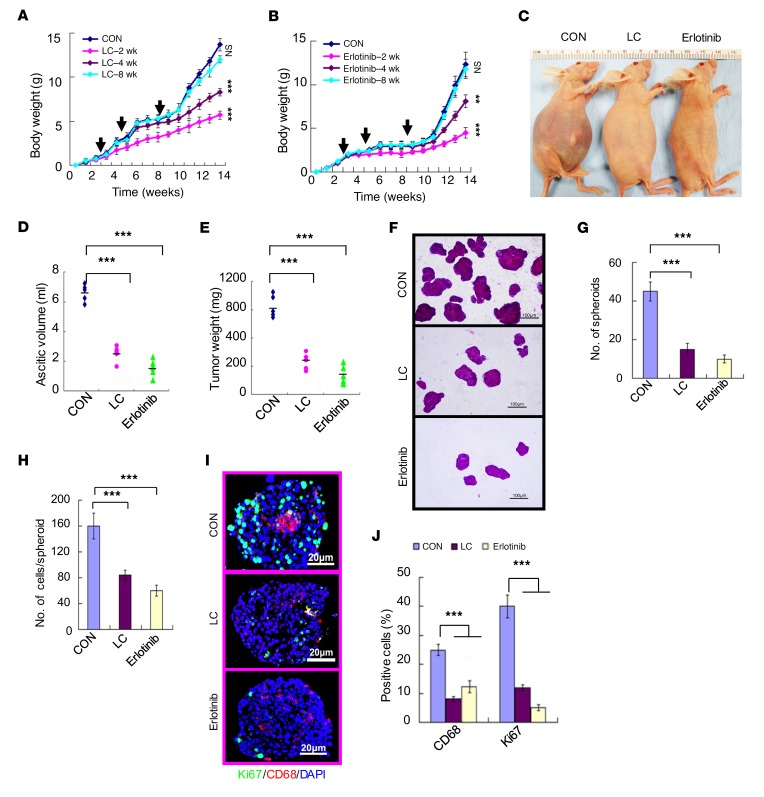
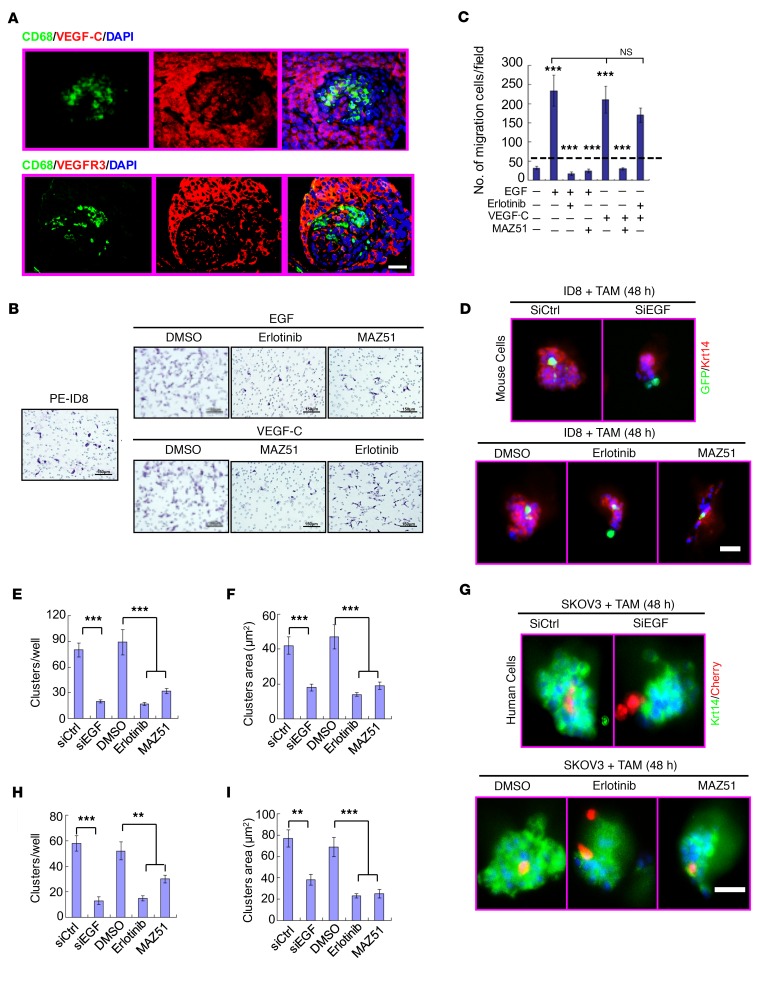
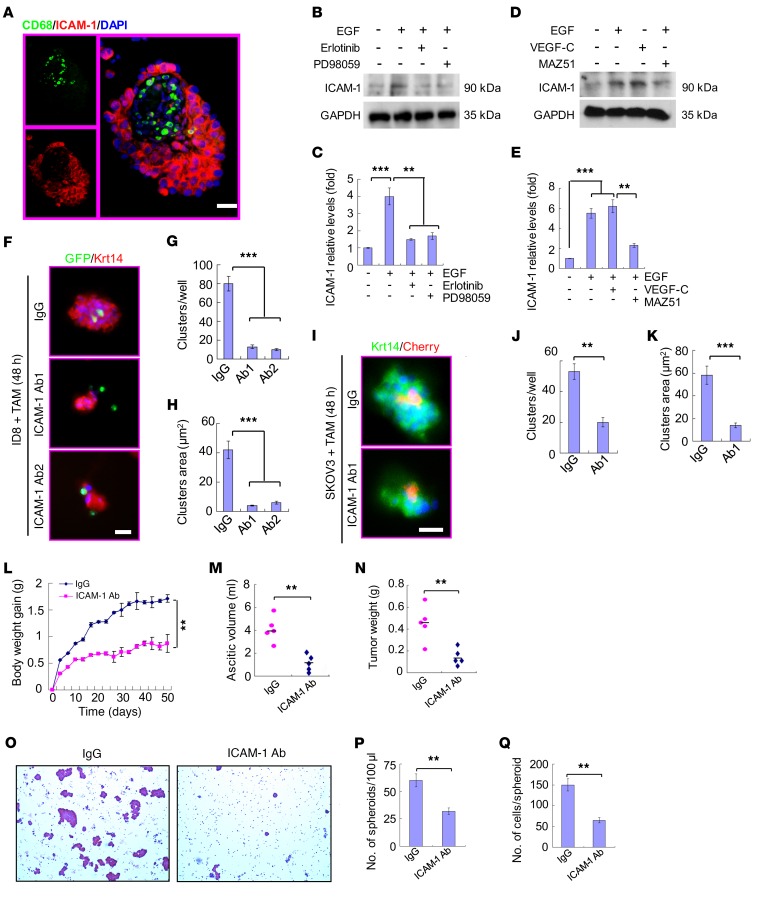
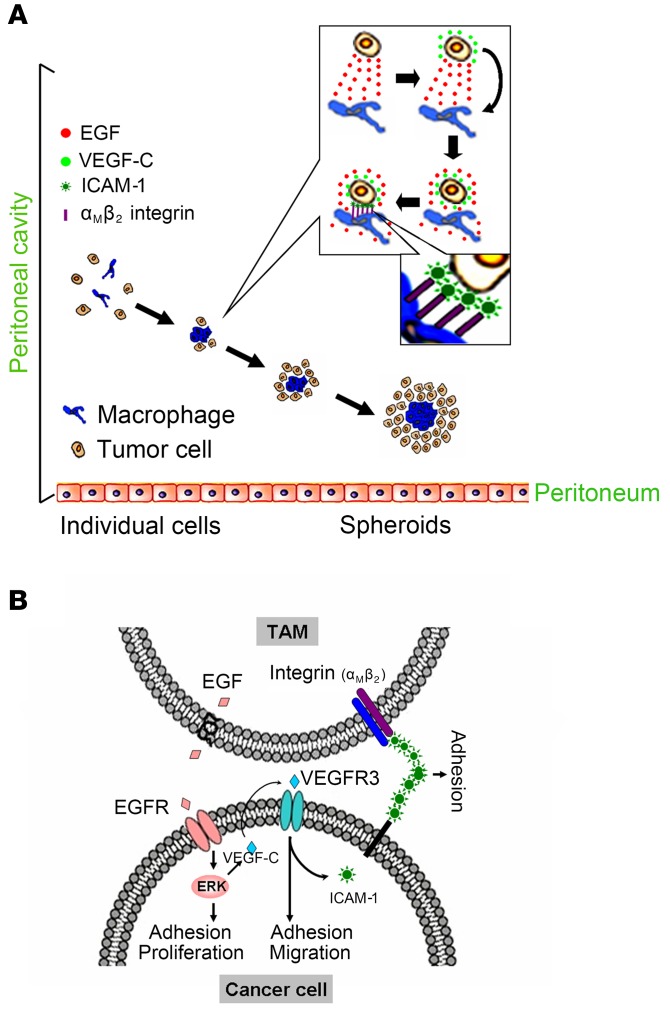
Tumor-associated macrophages (TAMs) can influence ovarian cancer growth, migration, and metastasis, but the detailed mechanisms underlying ovarian cancer metastasis remain unclear. Here, we have shown a strong correlation between TAM-associated spheroids and the clinical pathology of ovarian cancer. Further, we have determined that TAMs promote spheroid formation and tumor growth at early stages of transcoelomic metastasis in an established mouse model for epithelial ovarian cancer. M2 macrophage-like TAMs were localized in the center of spheroids and secreted EGF, which upregulated αMβ2 integrin on TAMs and ICAM-1 on tumor cells to promote association between tumor cells and TAM. Moreover, EGF secreted by TAMs activated EGFR on tumor cells, which in turn upregulated VEGF/VEGFR signaling in surrounding tumor cells to support tumor cell proliferation and migration. Pharmacological blockade of EGFR or antibody neutralization of ICAM-1 in TAMs blunted spheroid formation and ovarian cancer progression in mouse models. These findings suggest that EGF secreted from TAMs plays a critical role in promoting early transcoelomic metastasis of ovarian cancer. As transcoelomic metastasis is also associated with many other cancers, such as pancreatic and colon cancers, our findings uncover a mechanism for TAM-mediated spheroid formation and provide a potential target for the treatment of ovarian cancer and other transcoelomic metastatic cancers.


Figures

Figure 1
Figure 1. Macrophages are involved in spheroid formation in an orthotopic OC model.
ID8 OCs stably expressing mCherry fluorescence protein were implanted into 8-week-old tomatoLysM-Cre recipient mice. Cherry+ tumor cells and GFP+ cells infiltrated into the peritoneal cavity were detected at 2, 4, 6, and 8 weeks after tumor cell implantation. (A) Peritoneal cells were smeared on slides and were observed under a fluorescence microscope. Representative images are shown. n = 5 mice for each time point. (B) The total number of GFP+ cells was quantified. Inset shows cell counting from days 0–20. n = 5 mice for each time point. (C) The total number of Cherry+ tumor cells was quantified. Inset shows cell counting from days 0–20. n = 5 mice for each time point. (DG) Macrophage and spheroid formation. Representative fluorescence images from weeks 3 to 6 are shown in D. Total number of spheroids (spheroids/100 μl ascites) (E) and size of spheroids (number of cells/spheroid) (F) were quantified. n = 5 mice for each time point. Initiation of spheroid formation at week 3 is indicated. (G) Spheroids collected at week 8 were subjected to immunostaining with APC-conjugated (647 nm) anti-CD68 and DAPI, followed by confocal imaging. GFP+ and CD68+ macrophages, Cherry+ tumor cells, and DAPI for nuclear staining are shown. A merged image is shown on the right. All data are presented as mean ± SEM. n = 5. *P < 0.05; **P < 0.01; ***P < 0.001 (2-sided Student’s t test).
Figure 2
Figure 2. Accumulation of M2 subtype TAMs correlates with OC progression.
F4/80+ CD11b+ macrophages in the orthotopic OC model were harvested from individual cell populations or spheroids at the indicated times (1, 4, and 8 weeks). (A) M1 subtype–specific and M2 subtype–specific markers were determined by qRT-PCR. Peripheral blood monocytes were used as a control. All data are presented as mean ± SEM. n = 5. *P < 0.05; **P < 0.01; ***P < 0.001 (2-sided Student’s t test) comparing with gene expression in week 1 individual (indiv) cells. (B and C) FACS and statistical analysis of CD163 and CD206 expression in macrophages from week 1 and 8 individual cells. All data are presented as mean ± SEM. n = 5. *P < 0.05; **P < 0.01; ***P < 0.001 (2-sided Student’s t test).
Figure 3
Figure 3. TAMs are essential for peritoneal spheroid formation and tumor growth of OC.
An orthotopic mouse OC model was established by injecting mouse ID8 cells i.p. into C57BL/6 female recipient mice. Mice were then either treated with liposome (ID8 group) or LC (ID8+LC group). Half of the recipient mice received ID8 cells plus TAMs isolated from spheroids of OC-bearing donor mice with liposome (ID8+TAM) or LC (ID8+TAM+LC). (AD) Effects of LC and TAM on tumor growth. (A) Mouse body weights were measured at indicated time points (days 0–60). (B and C) Ascitic fluid volumes and net tumor weights were measured at day 60. Data are presented as mean ± SEM. n = 10. (D) Mouse modality was monitored, and survival rates were quantified. n = 24 mice per group. Kaplan-Meier analyses using the log-rank test were performed. (EG) Effects of LC and TAM on spheroid formation. Spheroids from ascites were collected at week 8 and were examined by H&E staining (E). Total number (F) and size (G) of spheroids were quantified. Scale bars: 100 μm. (HJ) Effects of LC and TAM on tumor cell proliferation. Individual cells and spheroids collected at week 8 were subjected to immunostaining with anti-Ki67, anti-CD68, and DAPI, followed by confocal imaging. (H) Representative images showing CD68+ macrophages are surrounded by Ki67+ tumor cells in ID8 but not in ID8+LC group. Scale bars: 25 μm. Ki67+ (I) and CD68+ cells (J) in individual and spheroid populations were quantified. n = 5 mice and 10 spheroids from each mice. Data are presented as mean ± SEM. **P < 0.01; ***P < 0.001 (2-sided Student’s t test).
Figure 4
Figure 4. Reciprocal upregulation of Egf in TAMs and Egfr expression in tumor cells are critical for OC growth.
(AC) TAMs promote ID8 cell proliferation in vitro. Peritoneal spheroids were harvested from OC-bearing mice at 8 weeks after tumor implantation. TAMs and ID8 tumor cells (PE-ID8) were isolated, and PE-ID8 cells were cultured alone or cocultured with TAMs in a Transwell without direct contacts. Naive ID8 cells were used as controls. (A) Total cell number was counted at times indicated. (B) Cell proliferation was measured by Ki67 staining. Scale bar: 100 μm. (C) Ki67+ tumor cells were quantified. n = 9. (D) Reciprocal upregulation of EGF in TAMs and EGFR expression in PE-ID8 cells. Gene expression of Egf and Egfr in TAMs and PE-ID8 was determined by qRT-PCR. Peripheral blood monocytes and naive ID8 tumor cells were used as controls. Relative gene expression is presented as fold change in relation to monocytes as 1.0. n = 3. (E) Immunofluorescent staining of CD68 with EGF or EGFR in spheroids harvested from ascites of OC mice. Representative images of spheroids from n = 5 mice are shown. Scale bar: 20 μm. (F and G) KD of EGF by siRNAs. TAMs were transfected with control (ctrl) or EGF siRNAs for 48 hours. (F) Egf mRNA levels in TAMs detected by qRT-PCR. (G) EGF protein levels in supernatant of TAMs cocultured with ID8 cells were measured by ELISA. (H and I) ID8 cells were treated with EGF in the absence or presence of EGFR inhibitor (10 or 20 μM) for 12 hours. Phospho- and total EGFR and ERK1/2 were determined by Western blot with respective antibodies. Total EGFR, ERK1/2, and GAPDH were determined. Relative phosphorylation levels were quantified. (J and K) TAMs were pretransfected with control siRNA or EGF siRNA. PE-ID8 cells were cultured alone or cocultured with TAMs in a Transwell in the absence or presence of EGF (20 ng/ml) or EGFR inhibitor (20 μM) for 12 hours. Proliferating PE-ID8 cells were stained by Ki67. Representative images are shown (J) with quantification of Ki67+ cells (K). Scale bars: 100 μm. Three different replicates were performed for all experiments. Data are presented as mean ± SEM. *P < 0.05; **P < 0.01; ***P < 0.001 (2-sided Student’s t test).
Figure 5
Figure 5. Clinical relevance of spheroid formation between EGF+ TAMs and EGFR+ tumor cells in OC patients.
(A and B) Macrophages and spheroids in human OC. (A) H&E and CD68 IHC staining of primary tumors and spheroids isolated from OC patients. Scale bars: 50 μm (H&E); 25 μm (CD68). (B) Statistical analysis of CD68-positive cells in primary tumors and spheroids of OC patients. n = 128. Data are presented as mean ± SEM. ***P < 0.001 (2-sided Student’s t test). (C and D) Correlations between macrophages and cancer cell proliferation in spheroids. (C) Immunostainings of CD68 and Ki67 in small, medium, and large spheroids of human OC. DAPI is used for nucleus staining. Representative images are shown. Scale bars: 5 μm. (D) Quantifications of CD68- and Ki67-positive cells in spheroids. n = 30. Small spheroid (0–50 cells/spheroid); medium cell cluster (50–500 cells/spheroid); large spheroid (≥500 cells/spheroid). Data are presented as mean ± SEM. **P < 0.01; ***P < 0.001 (2-sided Student’s t test) comparing medium and large spheroids with small spheroids. (E) Immunofluorescent staining of spheroids harvested from ascites of OC patients. Costainings of CD68 with EGF or EGFR (E). Representative images of spheroids from n = 128 OC patients are shown. CD68+EGF+ TAMs in the center of spheroids are indicated by arrows. Scale bars: 10 μm. (F) Statistical analysis of CD68+ cells in OC spheroids with different histological differentiation (2-sided Student’s t test, AF). (G) Kaplan-Meier curves for OS in 128 OC patients with low (≤14.5%) or high (≥14.5%) percentage of CD68+ cells in OC spheroids (analyzed with log-rank test)
Figure 6
Figure 6. Inhibition of EGFR reduces spheroid formation, cell proliferation, and ovarian tumor growth in mouse models.
An orthotopic mouse model was established by injecting human SKOV3 OCs i.p. into female recipient nude mice. Mice were then either untreated (CON) or treated with erlotinib i.p. (100 mg/kg body weight/d). LC was used as a treatment control. (AE) Effects of erlotinib on SKOV3 tumor growth. (A and B) Mouse body weights were measured at indicated time points. Arrows indicate different starting times of treatment (2, 4, or 8 weeks after tumor cell implantation) with LC (A) or erlotinib (B). (C) Representative images of mouse bodies in control, LC-, and erlotinib-treated groups. (D and E) Ascitic fluid volumes and net tumor weights were measured at week 14. Data in AE are presented as mean ± SEM. n = 10 for each group. ***P < 0.001. (FH) Effects of erlotinib on SKOV3 spheroid formation. Spheroids from ascites were collected at week 14 and mounted on slides. Spheroids were examined by H&E staining (F). Scale bars: 100 μm. Total number (G) and size (H) of spheroids were quantified. (I and J) Effects of erlotinib on SKOV3 tumor cell proliferation. Spheroids collected at week 14 were subjected to immunostaining with anti-Ki67, anti-CD68, and DAPI, followed by confocal imaging. (I) Representative images of spheroids with Ki67+ tumor cells and CD68+ macrophages. (J) Ki67+ and CD68+ cells in spheroids were quantified. n = 5 mice and 10 spheroids from each mice. Data are presented as mean ± SEM. **P < 0.01;***P < 0.001 (2-sided Student’s t test).
Figure 7
Figure 7. EGF promotes EGFR+ tumor cell migration through an autocrine VEGF-C/VEGFR3 signaling.
(A) Immunofluorescent stainings of CD68 with VEGF-C or VEGFR3 in spheroids harvested from ascites of OC mice. Scale bar: 10 μm. Representative images of spheroids. n = 5 mice. (B and C) PE-ID8 cells were treated with EGF or VEGF-C (20 ng/ml) in the absence or presence of EGFR inhibitor erlotinib or VEGFR3 inhibitor MAZ51 (10 nM) for 12 hours during Transwell migration assay. (B) Representative images of hematoxylin staining. Scale bars: 150 μm. (C) Statistical analyses of migration cells. (DF) Mouse GFP+F4/80+CD206+ TAMs isolated from spheroids of OC-bearing tomatoLysM-Cre mice were pretransfected with control siRNA (siCtrl) or EGF-siRNA for 48 hours. TAMs were then cocultured with ID8 cells in a 3D coculture system in the presence of erlotinib or MAZ51 (20 nM). Representative pictures are shown for localization of GFP+ cells (TAMs) in the center of spheroids in control but not in siEGF cells. Number (per well) and size (area) of spheroids at 48 hours were quantified. Scale bars: 50 μm. (GI) Human CD14+ TAMs isolated from spheroids of OC patients were pretransfected with control siRNA or EGF-siRNA for 48 hours and applied to 3D coculture with human OC SKOV3 cells. Number and size of spheroids at 48 hours were quantified. Scale bar: 25 μm. Three different replicates were performed for all experiments. Data are presented as mean ± SEM. **P < 0.01; ***P < 0.001 (2-sided Student’s t test).
Figure 8
Figure 8. TAMs promote adhesion with EGFR+ tumor cells through integrin αMβ2 and ICAM-1 interaction.
(A) Immunofluorescent stainings of CD68 with ICAM-1 in spheroids harvested from ascites of OC mice. Representative images of spheroids from n = 5 mice are shown. Scale bar: 10 μm. (B and C) PE-ID8 cells were treated with EGF in the absence or presence of EGFR inhibitor erlotinib or ERK inhibitor PD98059 (10 nM) for 24 hours. ICAM-1 protein was determined by Western blot. Relative levels of ICAM-1 were quantified. (D and E) ID8 cells were treated with EGF or VEGF-C in the absence or presence of MAZ51 (VEGFR3 inhibitor) for 24 hours. ICAM-1 was determined by Western blot (D). Relative protein levels of ICAM-1 were quantified (E). (FK) Effects of ICAM-1 neutralization antibodies on spheroid formation. 3D cocultures of mouse TAM–ID8 (FH) and human TAM-SKOV3 (IK) were performed as in Figure 7 in the presence of anti-mouse ICAM-1 or anti-human ICAM-1, respectively. Number and size of spheroids were measured at 48 hours. Scale bars: 50 μm (F); 25 μm (I). Three independent experiments were performed. Data are presented as mean ± SEM. **P < 0.01; ***P < 0.001. (LQ) An orthotopic mouse model was established by injecting mouse ID8 OCs i.p. into C57BL/6 female recipient mice. Mice were then either treated with IgG or anti-mouse ICAM-1 antibody by i.p. injection. Mouse body weight gain was measured at indicated time points (days 0–50) (L). Ascetic volume (M) and tumor weight (N) were measured at day 50. (OQ) Spheroids were examined by H&E staining (O). Total number (P) and size (Q) of spheroids were quantified. Data are presented as mean ± SEM. n = 10. **P < 0.001 (2-sided Student’s t test).
Figure 9
Figure 9. A model for TAM–cancer cell interactions in spheroid formation.
(A) During early stages of OC transcoelomic metastasis and tumor growth, detached OC cells induce infiltration of macrophages into the peritoneal cavity. Interactions of macrophages with OC cells in the peritoneal environment form spheroids and skew macrophages into M2 subtype TAMs. TAMs located in the center of spheroids may provide initial matrix support for OC to avoid anoikis. Importantly, TAMs can secrete large amount of EGF and activate EGFR that is upregulated on tumor cells. The activated EGF/EGFR signaling can induce VEGF-C expression, which in turn activates VEGFR3 signaling and induces integrin/ICAM-1 expression in tumor cells to form a positive autocrine feedback loop, thus promoting tumor migration, adhesion, and spheroid formation. (B) Molecular interactions between TAMs and OC cells.

References

    1. Jemal A, Siegel R, Ward E, Hao Y, Xu J, Thun MJ. Cancer statistics, 2009. CA Cancer J Clin. 2009;59(4):225–249. doi: 10.3322/caac.20006. - DOI - PubMed
    1. Siegel R, Naishadham D, Jemal A. Cancer statistics, 2012. CA Cancer J Clin. 2012;62(1):10–29. doi: 10.3322/caac.20138. - DOI - PubMed
    1. Rossing MA, Wicklund KG, Cushing-Haugen KL, Weiss NS. Predictive value of symptoms for early detection of ovarian cancer. J Natl Cancer Inst. 2010;102(4):222–229. doi: 10.1093/jnci/djp500. - DOI - PMC - PubMed
    1. Yin M, et al. Over-expression of LAPTM4B is associated with poor prognosis and chemotherapy resistance in stages III and IV epithelial ovarian cancer. J Surg Oncol. 2011;104(1):29–36. doi: 10.1002/jso.21912. - DOI - PubMed
    1. Yin M, et al. LAPTM4B overexpression is a novel predictor of epithelial ovarian carcinoma metastasis. Int J Cancer. 2011;129(3):629–635. doi: 10.1002/ijc.25689. - DOI - PubMed

MeSH terms

Substances