. 2016 Nov 1;126(11):4187-4204.
doi: 10.1172/JCI78260. Epub 2016 Oct 10.

Matricellular protein SPARCL1 regulates tumor microenvironment-dependent endothelial cell heterogeneity in colorectal carcinoma

Matricellular protein SPARCL1 regulates tumor microenvironment-dependent endothelial cell heterogeneity in colorectal carcinoma

Elisabeth Naschberger et al. J Clin Invest. .

Abstract

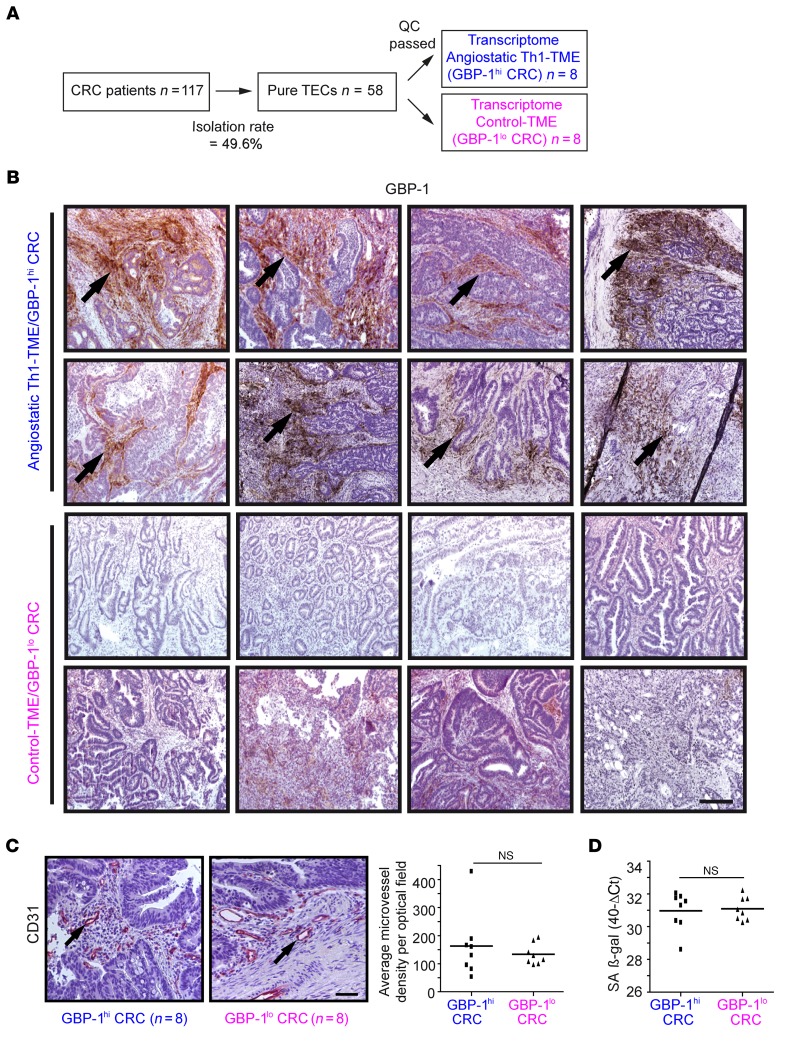
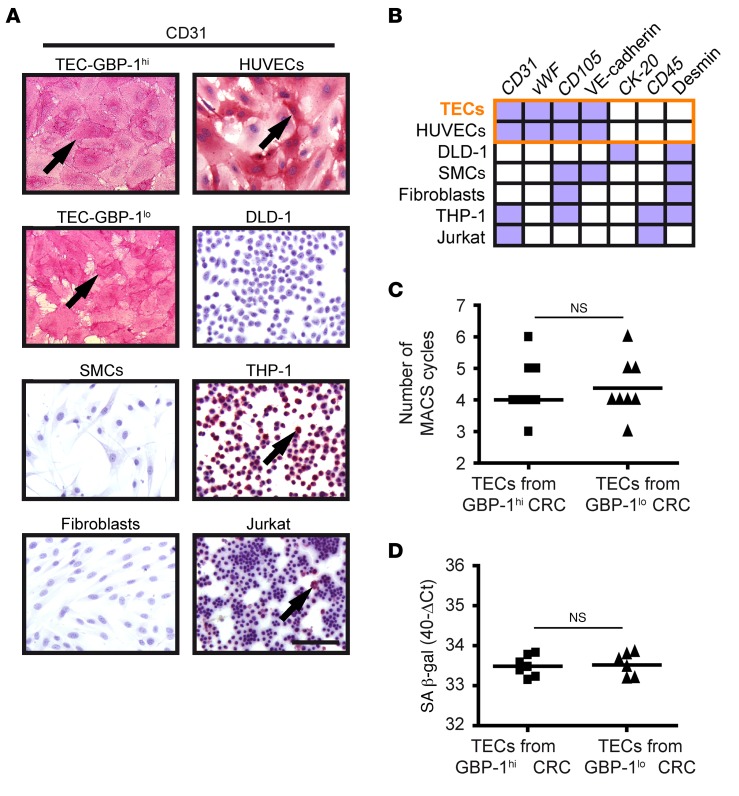
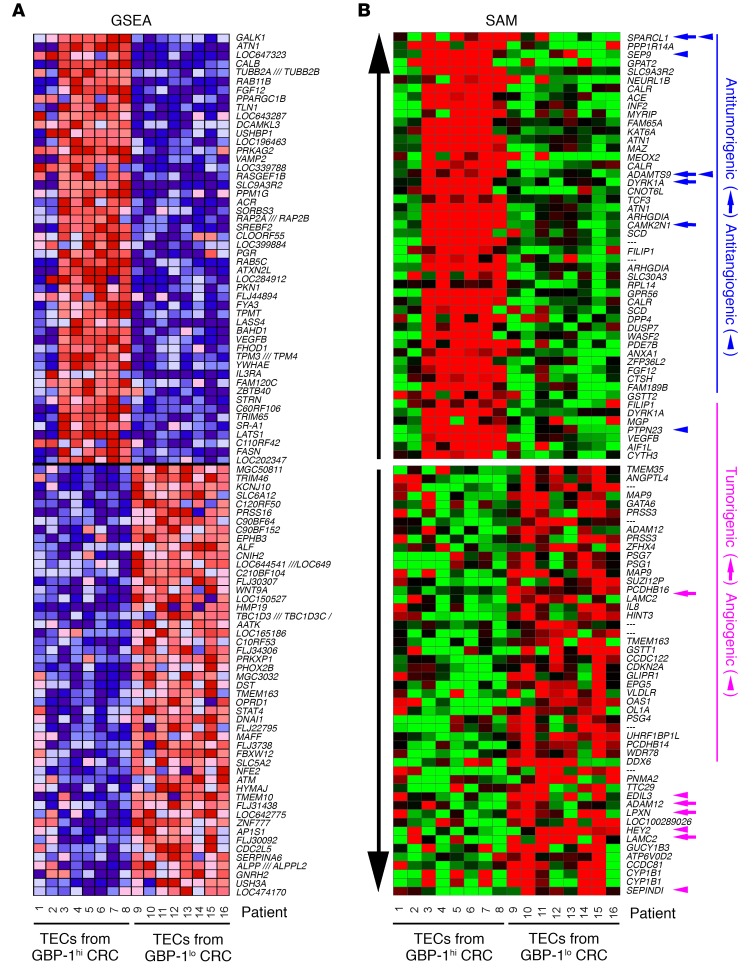
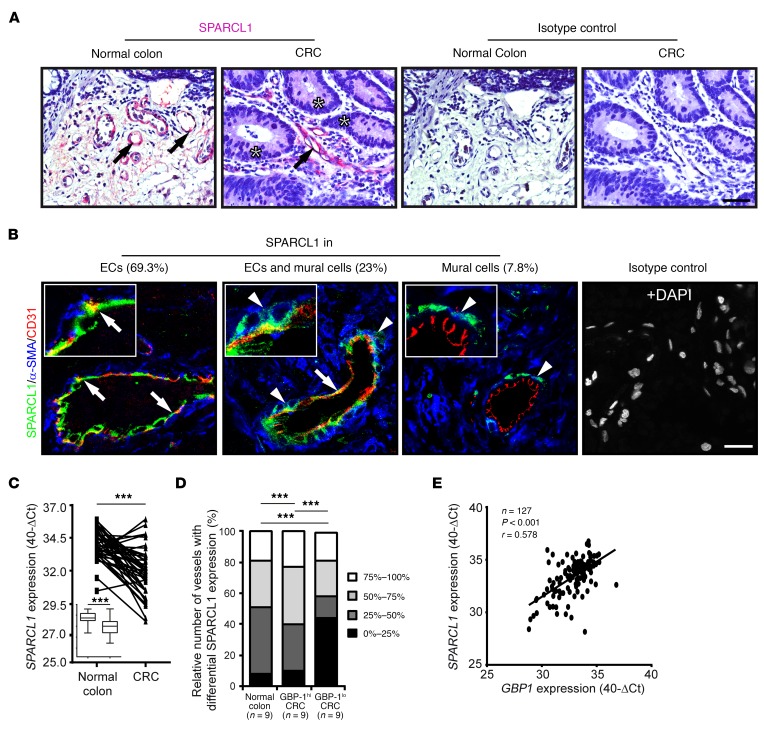
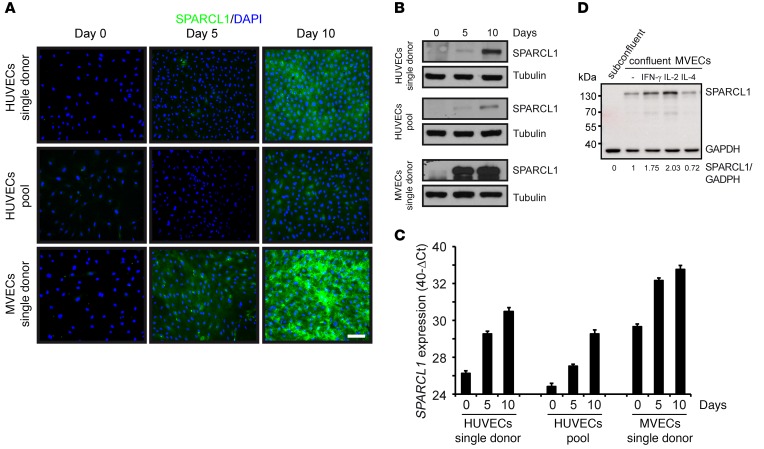
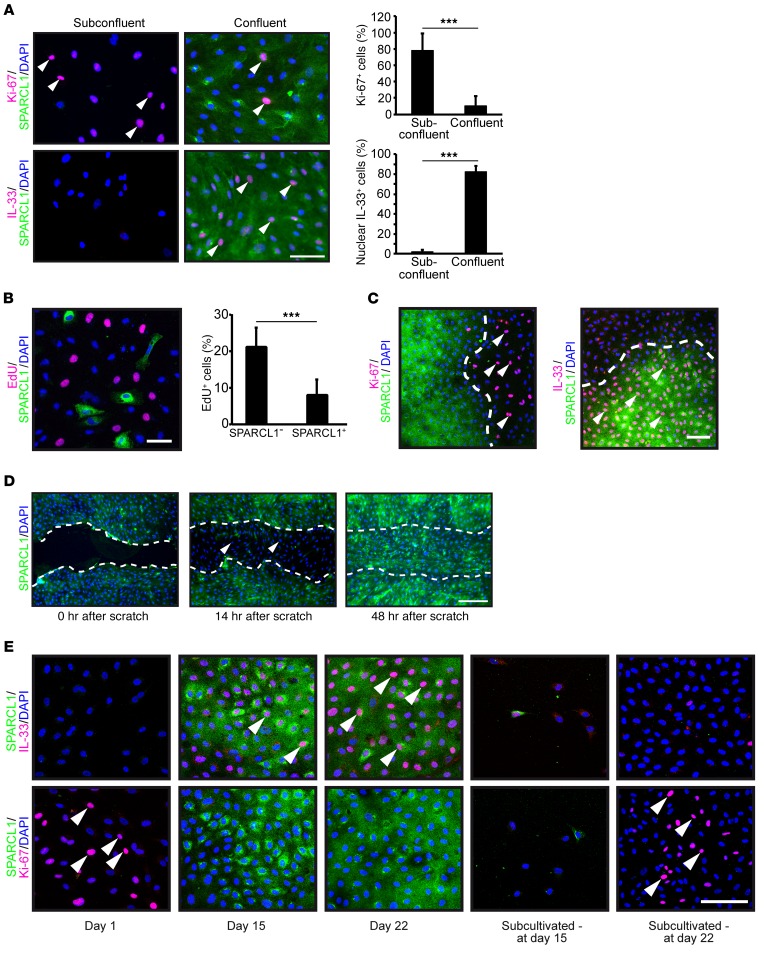
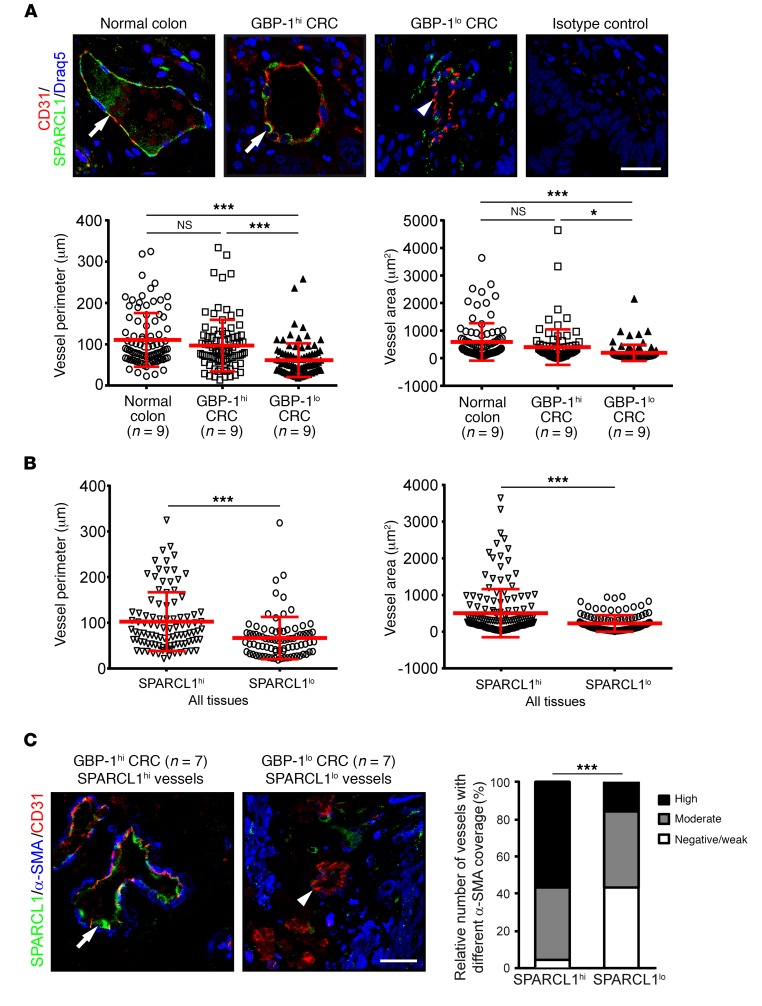
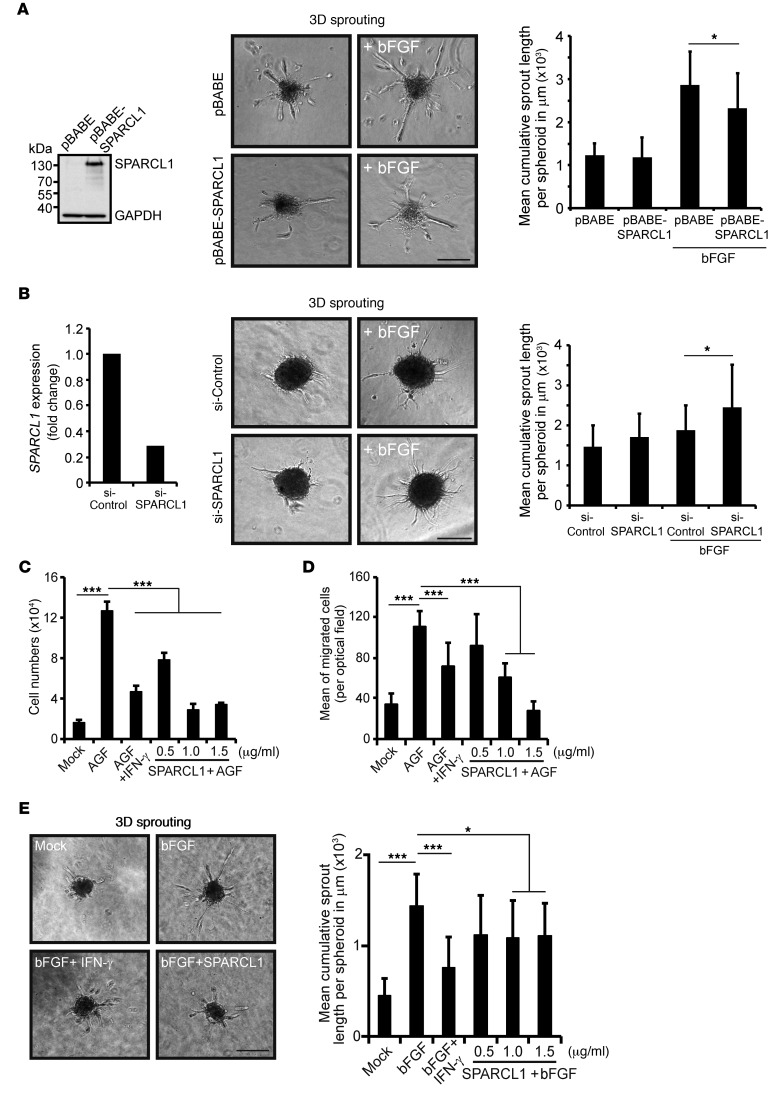
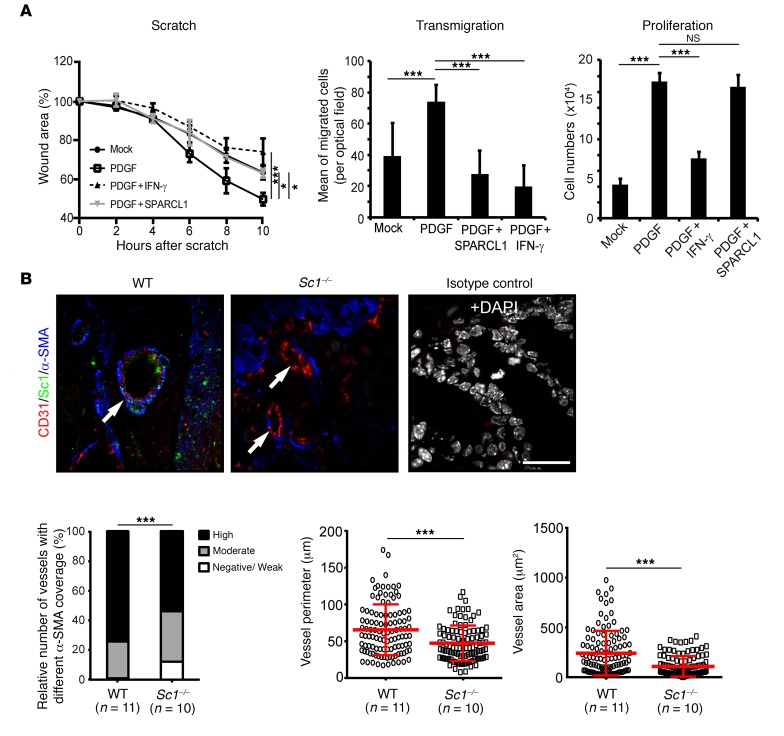
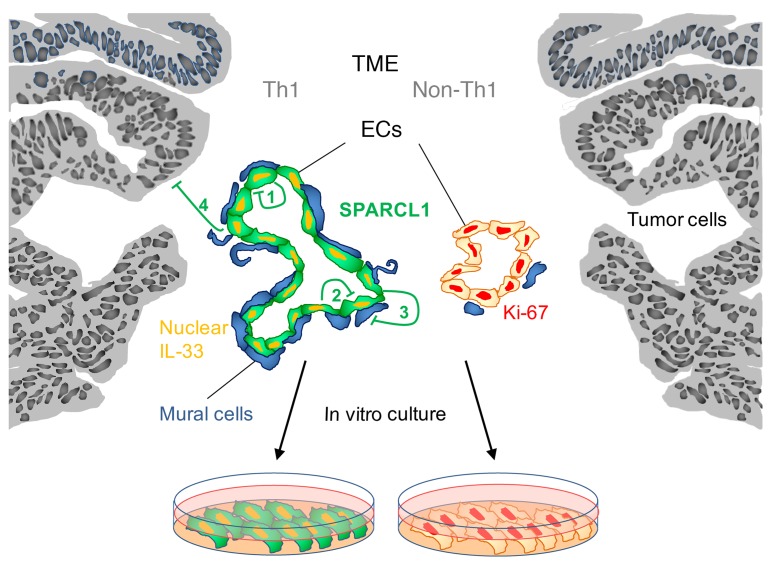
Different tumor microenvironments (TMEs) induce stromal cell plasticity that affects tumorigenesis. The impact of TME-dependent heterogeneity of tumor endothelial cells (TECs) on tumorigenesis is unclear. Here, we isolated pure TECs from human colorectal carcinomas (CRCs) that exhibited TMEs with either improved (Th1-TME CRCs) or worse clinical prognosis (control-TME CRCs). Transcriptome analyses identified markedly different gene clusters that reflected the tumorigenic and angiogenic activities of the respective TMEs. The gene encoding the matricellular protein SPARCL1 was most strongly upregulated in Th1-TME TECs. It was also highly expressed in ECs in healthy colon tissues and Th1-TME CRCs but low in control-TME CRCs. In vitro, SPARCL1 expression was induced in confluent, quiescent ECs and functionally contributed to EC quiescence by inhibiting proliferation, migration, and sprouting, whereas siRNA-mediated knockdown increased sprouting. In human CRC tissues and mouse models, vessels with SPARCL1 expression were larger and more densely covered by mural cells. SPARCL1 secretion from quiescent ECs inhibited mural cell migration, which likely led to stabilized mural cell coverage of mature vessels. Together, these findings demonstrate TME-dependent intertumoral TEC heterogeneity in CRC. They further indicate that TEC heterogeneity is regulated by SPARCL1, which promotes the cell quiescence and vessel homeostasis contributing to the favorable prognoses associated with Th1-TME CRCs.


Figures

Figure 1
Figure 1. Study groups were established according to isolated TECs from CRC tissues that had an angiostatic Th1-TME or a non-Th1 control-TME as well as comparable microvessel densities and senescence.
(A) In total, 58 pure TEC cultures were isolated from 117 patients using a CD31-based MACS protocol. The isolation success was 49.6%. After application of stringent quality criteria (QC) (see main text), 16 TEC cultures derived from CRC tissues with an angiostatic Th1-TME (n = 8, blue) and control-TME (n = 8, pink) were subjected to transcriptome analyses. (B) For the study, all tumors with angiostatic Th1-TME (GBP-1hi) and those with a non-Th1 control-TME (GBP-1lo) and less favorable prognosis were differentiated by GBP-1 expression (brown, arrows) using IHC. Scale bar: 250 μm. (C) Microvessel density was detected by CD31 staining (left panel) in tumors from B. For each tumor, the average number of microvessels per optical field was calculated and is shown (right panel). Scale bar: 50 μm. (D) RT-qPCR of SA β-gal expression in the tumors from B. The expression levels are given as 40-Ct values. (C and D) Statistical significance was determined by Student’s t test. Mean values are indicated by line; NS, not significant.
Figure 2
Figure 2. TECs isolated from CRC with an angiostatic Th1-TME and control-TME are pure and show an EC phenotype.
(A) The purity of TEC cultures was determined by CD31 immunocytochemical staining. CD31-positive control cells (pink, arrows) were primary ECs (HUVECs), monocytes (THP-1), and T cells (Jurkat); CD31-negative control cells were CRC cells (DLD-1), primary SMCs, and primary fibroblasts. Scale bar: 100 μm. (B) Expression of a panel of cell type–specific markers was analyzed in isolated TECs after CD31 staining (see A) and indicated high purity compared with control cells. All TECs showed expression of markers (purple boxes) identical to that of HUVECs (orange frame). CK-20, CD45, and desmin were continuously negative (white boxes), excluding contamination with CRC tumor cells, SMCs, fibroblasts, monocytes, and T cells. Detailed values are provided in Supplemental Table 2. (C) Dot plot shows the number of MACS cycles required to obtain pure TEC cultures. (D) Expression of SA β-gal was determined by RT-qPCR in the isolated TEC cultures. Expression levels are indicated as 40-ΔCt values. SA β-gal expression could not be determined in 3 TEC cultures due to consumption of the respective RNAs by transcriptome and purity analyses. (C and D) Statistical significance was determined by Student’s t test. Mean values are indicated by line; NS, not significant.
Figure 3
Figure 3. Pure TECs isolated from CRC with an angiostatic Th1-TME and control-TME maintain differential transcriptomes in culture.
(A) RNA was isolated from TECs derived from GBP-1hi and GBP-1lo CRC (see Figure 2) and analyzed by hybridization to HG-U133-Plus 2.0 gene chips (Affymetrix). Heatmap of the top 50 features for each phenotype (GBP-1hi versus GBP-1lo) as identified by GSEA. A detailed list of the identified features is provided in Supplemental Table 4 and the enriched gene sets in Supplemental Table 5. (B) Heatmap of the differentially regulated genes as identified by SAM. The top 50 up- and downregulated target genes regulated by more than 2-fold are depicted. A detailed list of the genes is provided in Supplemental Table 6. Gene functions according to the literature. Blue: antitumorigenic = arrows, antiangiogenic = arrowheads; pink: tumorigenic = arrows, angiogenic = arrowheads.
Figure 4
Figure 4. SPARCL1 is an EC-associated protein that is highly expressed in normal colon and progressively lost in more aggressive CRCs.
(A) SPARCL1 expression (pink, arrows) was determined by IHC in normal colon and CRC tissues. Tumor cells are labeled with asterisks. Isotype antibody staining of consecutive sections was used as a negative control. Scale bar: 50 μm. (B) Colocalization of SPARCL1, α-SMA, and CD31 was determined by immunofluorescence triple staining (SPARCL1, green; α-SMA, blue; CD31, red). A triple staining with the respective isotype antibodies is depicted as a control. All tissues were counterstained using DAPI (white), but this is depicted only for the isotype staining. Inserts are representative higher-magnification images of the 296 vessels counted, showing colocalizations of SPARCL1 and CD31 (arrows) and SPARCL1 and α-SMA (arrowheads) (n = 10 normal colon, n = 20 CRCs). Scale bar: 25 μm; original magnification, ×4.3 (inserts). (C) SPARCL1 expression was quantified by RT-qPCR in normal colon and corresponding CRC tissues (n = 42). 40-ΔCt values are shown at the individual patient level and in a box and whisker plot (insert). ***P < 0.001, by Student’s t test. Line corresponds to mean value. (D) SPARCL1 and CD31 expression was detected after immunofluorescence staining in normal colon, GBP-1hi CRC, and GBP-1lo CRC (n = 9 each). The relative content of SPARCL1-positive ECs per vessel was categorized and determined for 10 vessels per patient (n = 270 total vessels). The relative number of vessels with different SPARCL1 expression (%) is indicated by different gray tones. ***P < 0.001, by χ2 test. (E) SPARCL1 and GBP1 expression was quantified in CRC tissues (n = 127) by RT-qPCR. Expression is indicated in 40-ΔCt values. Pearson’s correlation (r = Pearson’s correlation coefficient) was performed in order to determine statistical significance. Line corresponds to linear regression.
Figure 5
Figure 5. SPARCL1 expression is induced by EC confluency and is further increased by Th1-associated cytokines.
Different cultures of HUVECs and MVECs were seeded with 30,000 cells/cm² and were grown for the indicated time periods. SPARCL1 expression was determined by (A) immunofluorescence staining (SPARCL1, green; DAPI, blue) (scale bar: 100 μm), (B) Western blot analysis (β-tubulin was used as a loading control), and (C) RT-qPCR (expression indicated as 40-ΔCt values). Error bars indicate SD. (D) MVECs expressing SPARCL1 after 5 days of confluence were treated with the recombinant human cytokines IFN-γ (100 U/ml), IL-2 (100 ng/ml), and IL-4 (20 ng/ml) for 24 hours in complete medium (n = 3). Subconfluent cells were used as a control. Protein extracts were analyzed by SPARCL1/GAPDH Western blotting, and signals were quantified by a digital chemiluminescence imager. The normalized signal intensities (SPARCL1/GAPDH) are indicated below the Western blot.
Figure 6
Figure 6. SPARCL1 is a marker of EC quiescence.
(A) MVECs were plated on chamber slides and grown to subconfluent and confluent states. Cells were costained by IHC for SPARCL1/Ki-67 or SPARCL1/IL-33 (SPARCL1, green; Ki-67/nuclear IL-33, pink, arrowheads; DAPI, blue). Scale bar: 75 μm. Graph depicts the relative numbers (percentages) of Ki-67– and nuclear IL-33–positive cells per optical field. Error bars indicate SD. (B) HUVECs were transiently transfected with a human SPARCL1 expression plasmid. Cells were incubated 24 hours after transfection for 2 hours with 10 μM EdU. Afterward, the Click-iT reaction was performed according to the manufacturer’s protocol, and SPARCL1 was stained (EdU, pink; SPARCL1, green; DAPI, blue). Scale bar: 50 μm. The relative amount of EdU-positive cells was determined in both SPARCL1-positive and SPARCL1-negative cells (n = 1,883). Error bars indicate SD. (C) HUVECs were plated on chamber slides and grown until confluence was reached in some areas. The cells were immunocytochemically stained for SPARCL1/Ki-67 or SPARCL1/IL-33, and confocal images of areas with inhomogenous confluence were acquired (SPARCL1, green; Ki-67/nuclear IL-33, pink, arrowheads; DAPI, blue). Scale bar: 100 μm. (D) Confluent cell layers of MVECs were scratched and immunocytochemically stained for SPARCL1 after 0, 14, and 48 hours (SPARCL1, green, DAPI, blue). The migration front is marked by a dashed white line, and cells migrating into the scratch that had lost SPARCL1 expression are labeled with arrowheads. Scale bar: 250 μm. (E) HUVECs were grown in parallel dishes for 1, 15, or 22 days. On day 15, cells from 1 dish were reseeded at a low density (subcultivated - at day 15) and grown for an additional 8 days (subcultivated - at day 22). The slides were immunofluorescently costained for SPARCL1/Ki-67 and SPARCL1/IL-33 expression (SPARCL1, green; Ki-67/nuclear IL-33, pink, arrowheads; DAPI, blue). Scale bar: 100 μm. (A and B) ***P < 0.001, by Student’s t test . (A, B, and D) One representative experiment of two independent experiments is depicted.
Figure 7
Figure 7. SPARCL1 expression is associated with mature vessels.
(A) Expression of SPARCL1 (green) and CD31 (red) was detected by immunofluorescence costaining in normal colon, and GBP-1hi and GBP-1lo CRC (n = 9 each). The combined isotype antibodies were used for the control staining. Tissues were counterstained with DRAQ5 (Cell Signaling Technology; blue). Colocalization is indicated by arrows. CD31 expression only is indicated by an arrowhead. Scale bar: 25 μm. Vessel perimeters and areas were quantitatively determined for all the stained vessels (n = 270; 10 vessels/patient) and are depicted as dot plots (red bars indicate the mean values and SD). (B) The vessel perimeters and areas as quantified in A in relation to vessels with high and low SPARCL1 expression for all tissues. (C) Immunofluorescence costaining of SPARCL1 (green), CD31 (red), and α-SMA (blue). Scale bar: 25 μm. α-SMA–positive mural cell coverage was categorized as negative/weak, moderate, or high for 296 vessels from 30 patients, and the relative size of each category is given for SPARCL1hi and SPARCL1lo vessels. The relative amount of coverage is depicted for vessels with SPARCL1 expression in ECs only (n = 205). The relative number of vessels with different alpha-SMA coverage (%) is indicated by different gray tones. (A and B) Representative experiment of 2 independent experiments is depicted. *P < 0.05 and ***P < 0.001, by ANOVA, with Levene and Games-Howell (unequal variance) tests (A), Student’s t test (B), and χ2 test (C).
Figure 8
Figure 8. SPARCL1 is an antiangiogenic protein.
(A) HUVECs were stably transduced by a retroviral SPARCL1-encoding vector (pBABE-SPARCL1) and the corresponding control vector (pBABE). Increased SPARCL1 expression in these cells was confirmed by Western blotting and immunocytochemistry (Supplemental Figure 6A). In agreement with earlier results, the cells showed significant inhibition of angiogenic growth factor–induced (AGF-induced) proliferation by SPARCL1 (AGF = combined bFGF/VEGF, 10 ng/ml each; positive control) (Supplemental Figure 6B). SPARCL1 overexpression significantly reduced bFGF-induced 3D sprouts from spheroids embedded in collagen/methocel matrices. (B) MVECs were transiently transfected with an siRNA (50 nM) specifically targeting SPARCL1 and with a control siRNA. Reduction of SPARCL1 RNA expression in cells transfected with the SPARCL1 siRNA was confirmed by RT-qPCR. In parallel, the same cells were used for spheroid formation, and 3D sprouting was assessed after 24 hours. (C) HUVECs were either untreated (mock) or treated with AGF (positive control), AGF and IFN-γ (100 U/ml, negative control), or AGF with increasing concentrations of recombinant SPARCL1. Cell numbers after 6 days are shown. (D) HUVECs were plated on Transwell inserts (8 μm) and treated as in C for 6 hours. Migrated cells at the lower membrane side were determined by counterstaining with DAPI (Supplemental Figure 7B), and the mean values of cells counted per optical field are shown. (E) Spheroids from HUVECs were embedded in a collagen/methocel gel and stimulated as described in C, except that bFGF was used alone instead of AGF for 24 hours in duplicate experiments. The sprout lengths of 20 spheroids per stimulation were quantitatively determined and are indicated as the mean cumulative sprout length per spheroid. All experiments were performed 3 times in triplicate, except the spheroid assays, which were performed in duplicate, with 10 spheroids quantified per group. *P < 0.05 and ***P < 0.001, by Student’s t test (A and B) or ANOVA, with Levene and Bonferroni’s (equal variance) or Games-Howell (unequal variance) test (CE). (A, B, and E) Scale bars: 250 μm. (AE) Error bars indicate SD.
Figure 9
Figure 9. SPARCL1 regulates vessel maturation.
(A) Primary human SMCs were treated with recombinant human SPARCL1 (1.5 μg/ml) and migration (scratch and transmigration assays) as well as proliferation were analyzed. Human recombinant PDGF (PDGF-AA and PDGF-BB, 10 ng/ml each) was used as a positive control to activate SMC migration and proliferation. Human recombinant IFN-γ (100 U/ml) served as a negative control. PDGF-induced closure of the wound was significantly inhibited by SPARCL1 (left); PDGF-induced transmigration was significantly inhibited by SPARCL1 (middle); and PDGF-induced proliferation of SMCs was not inhibited by SPARCL1 (right). Representative experiments of 2 (right and left) and 3 (middle) independent experiments are depicted. Lines indicate SD. (B) Colon tissue of WT (n = 11) and Sc1–/– mice (n = 10) was immunostained for SC1 (green), CD31 (red), and α-SMA (blue). Vessels are indicated by arrows. α-SMA–positive mural cell coverage was categorized as negative/weak, moderate, or high for 210 vessels, and the relative number of vessels for each category is shown for WT and Sc1–/– vessels (left). Vessel perimeters and areas (n = 210) were quantitatively determined and are depicted by dot plots (red bars represent the mean values and SD). Scale bar: 25 μm. *P < 0.05 and ***P < 0.001, by ANOVA, with Levene and Bonferroni’s (equal variance) or Games-Howell (unequal variance) test (A), χ2 test B, bar graph), or Student’s t test (B, dot plots).
Figure 10
Figure 10. Role of SPARCL1 in CRC.
SPARCL1 is expressed in ECs of tumor vessels in CRC with an angiostatic Th1-TME (green). SPARCL1-positive vessels show increased mural cell coverage (left, blue) and increased vessel area and perimeter (left). Detection of nuclear IL-33 (orange) and low or absent proliferation indicates quiescence of SPARCL1-positive ECs. SPARCL1 expression is low in CRC tissues lacking an angiostatic Th1-TME (right). SPARCL1-negative vessels exhibit increased proliferation rates (Ki-67, red) and smaller vessel areas and perimeters (right). SPARCL1 regulates the Th1-associated phenotype of TECs. It is secreted from ECs and can inhibit EC proliferation and migration in an autocrine (1) or paracrine (2) manner. Moreover, SPARCL1 stabilizes mature vessels by inhibiting the activation of mural cells (3). EC-secreted SPARCL1 may also exert inhibitory effects on epithelial tumor cells in CRC (4). Differential SPARCL1 expression in vivo is maintained in in vitro cultures of TECs from CRC tissues with different TMEs.

Comment in

  • Colorectal cancer: CRC endothelial regulation.
    Thomas H. Thomas H. Nat Rev Gastroenterol Hepatol. 2016 Dec;13(12):682. doi: 10.1038/nrgastro.2016.180. Epub 2016 Oct 26. Nat Rev Gastroenterol Hepatol. 2016. PMID: 27780973 No abstract available.

References

    1. Vogelstein B, et al. Genetic alterations during colorectal-tumor development. N Engl J Med. 1988;319(9):525–532. doi: 10.1056/NEJM198809013190901. - DOI - PubMed
    1. O’Brien CA, Pollett A, Gallinger S, Dick JE. A human colon cancer cell capable of initiating tumour growth in immunodeficient mice. Nature. 2007;445(7123):106–110. doi: 10.1038/nature05372. - DOI - PubMed
    1. Schwitalla S, et al. Intestinal tumorigenesis initiated by dedifferentiation and acquisition of stem-cell-like properties. Cell. 2013;152(1-2):25–38. doi: 10.1016/j.cell.2012.12.012. - DOI - PubMed
    1. Hanahan D, Weinberg RA. Hallmarks of cancer: the next generation. Cell. 2011;144(5):646–674. doi: 10.1016/j.cell.2011.02.013. - DOI - PubMed
    1. Folkman J. Tumor angiogenesis: therapeutic implications. N Engl J Med. 1971;285(21):1182–1186. doi: 10.1056/NEJM197111182852108. - DOI - PubMed

Publication types

MeSH terms