. 2016 Oct 10:7:13041.
doi: 10.1038/ncomms13041.

Tissue-specific and convergent metabolic transformation of cancer correlates with metastatic potential and patient survival

Affiliations

Tissue-specific and convergent metabolic transformation of cancer correlates with metastatic potential and patient survival

Edoardo Gaude et al. Nat Commun. .

Abstract

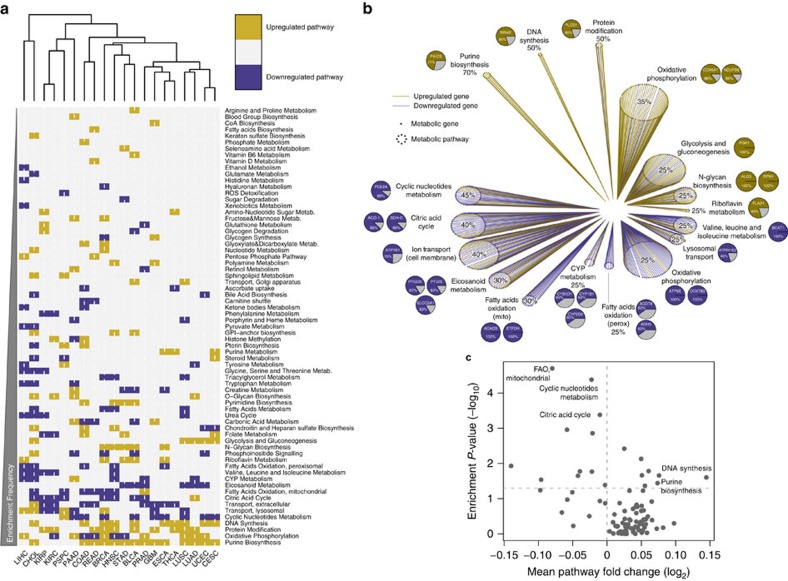
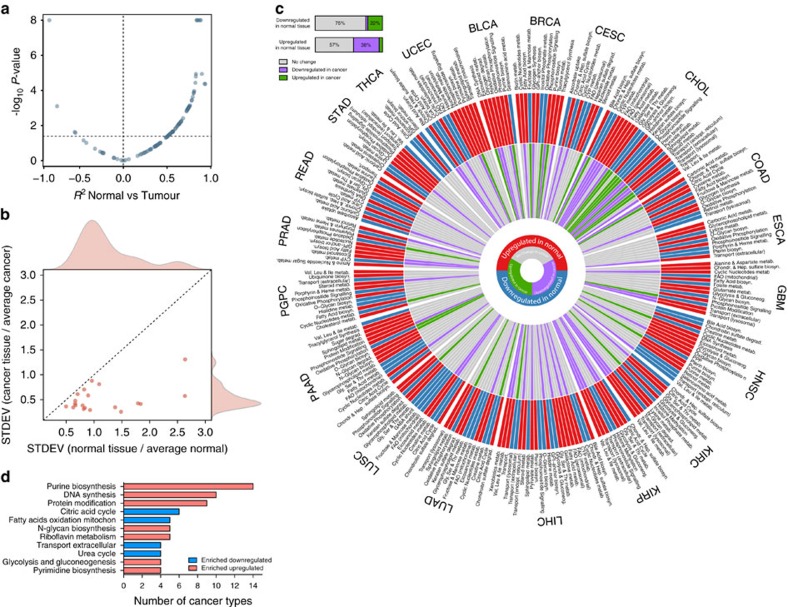
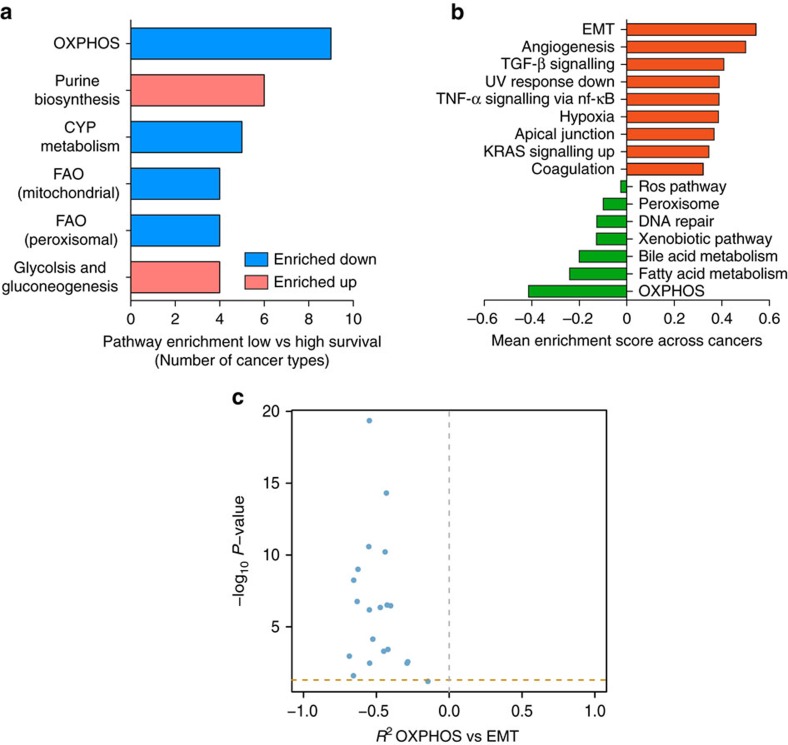
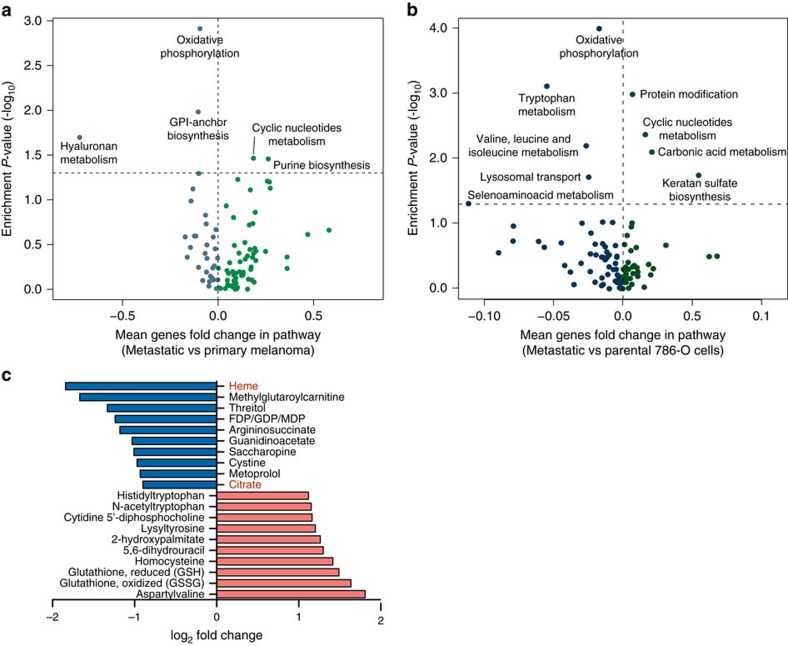
Cancer cells undergo a multifaceted rewiring of cellular metabolism to support their biosynthetic needs. Although the major determinants of this metabolic transformation have been elucidated, their broad biological implications and clinical relevance are unclear. Here we systematically analyse the expression of metabolic genes across 20 different cancer types and investigate their impact on clinical outcome. We find that cancers undergo a tissue-specific metabolic rewiring, which converges towards a common metabolic landscape. Of note, downregulation of mitochondrial genes is associated with the worst clinical outcome across all cancer types and correlates with the expression of epithelial-to-mesenchymal transition gene signature, a feature of invasive and metastatic cancers. Consistently, suppression of mitochondrial genes is identified as a key metabolic signature of metastatic melanoma and renal cancer, and metastatic cell lines. This comprehensive analysis reveals unexpected facets of cancer metabolism, with important implications for cancer patients' stratification, prognosis and therapy.


Figures

Figure 1
Figure 1. Rewiring of metabolic gene expression in cancer tissues compared to normal.
(a) Heatmap representation and hierarchical clustering of enriched upregulated (gold) and enriched downregulated (blue) metabolic pathways in cancers compared to normal tissues. (b) Gene expression effect plot of metabolic pathways enriched in more than 25% of cancers. Circles indicate metabolic pathways and dots in each circle represent individual metabolic genes. Gold and blue lines indicate upregulated and downregulated genes in cancers compared to normal tissues, respectively. Pie charts represent the most frequently up- or downregulated genes in the corresponding pathway; percentage values indicate frequency of up- or downregulation. (c) Volcano plot representation of mean fold change expression of genes in each pathway (x axis) vs enrichment P-values (y axis) in breast cancer vs normal samples (data obtained from Terunuma et al.8). Significantly enriched metabolic pathways in common with Fig. 1b are indicated.
Figure 2
Figure 2. The metabolic landscape of cancer is tissue-specific but convergent.
(a) Scatter plot representation of correlation coefficient (Spearman, x axis) and correlation P-value (−log10, y axis) of metabolic pathways in normal tissue compared to cancer. Horizontal dashed line indicates FDR of 5% (−log10). (b) Scatter plot representation of the variance of metabolic pathways among normal (x axis) and cancer (y axis) tissues. (c) Tissue-specific metabolic signatures in normal and cancer tissues are represented in a polar histogram. The external circle displays metabolic pathways found enriched upregulated (red) or downregulated (blue) in normal tissues, compared to average. The internal circle shows the enrichment of individual metabolic pathways in cancer compared to normal. Grey bars indicate no change in cancer compared to normal. The horizontal histogram indicates the proportion of metabolic pathways altered in cancer compared to pathways downregulated or upregulated in normal tissues. (d) Metabolic pathways enriched in cancer tissue compared to normal, independent of tissue of origin. Metabolic pathways enriched in >20% of cancer types are shown.
Figure 3
Figure 3. Downregulation of OXPHOS genes is associated with poor clinical outcome and EMT gene signature.
(a) Frequency of metabolic pathways found enriched upregulated (red) or downregulated (blue) between low and high survival patients in at least 25% of cancer types. (b) Top 10 enriched upregulated and downregulated cancer hallmarks between low and high survival patients across cancer types that showed OXPHOS downregulation (9 cancers). Mean enrichment scores of low vs high survival patients across the nine cancer types considered are shown. (c) Volcano plot showing correlation coefficient (Spearman, x axis) and correlation P-values (Spearman, −log10, y axis) of mean expression of OXPHOS genes compared to mean expression of genes involved in EMT. Horizontal dashed line indicates FDR=5%.
Figure 4
Figure 4. Suppression of OXPHOS is a key metabolic feature of Skin Cutaneous Melanoma.
(a-b) Volcano plot representation of mean fold change of genes in each pathway (x axis) vs enrichment P-values (y axis) of metastatic vs primary cancer samples (a) and of metastatic vs parental 786-O cell lines (b). (c) Fold changes in metabolite levels of metastatic vs non-metastatic ccRCC patients. Metabolites were ranked according to log2 fold change. Top 10 downregulated and top 10 upregulated metabolites are shown. Data were obtained from Hakimi et al.

References

    1. Vogelstein B. et al.. Cancer genome landscapes. Science 339, 1546–1558 (2013). - PMC - PubMed
    1. Hanahan D. & Weinberg R. A. Hallmarks of cancer: the next generation. Cell 144, 646–674 (2011). - PubMed
    1. Warburg O. Uber den Stoffwechsel der Carcinomzelle. Naturwissenschaften 12, 1131–1137 (1924).
    1. Hu J. et al.. Heterogeneity of tumor-induced gene expression changes in the human metabolic network. Nat. Biotechnol. 31, 522–529 (2013). - PMC - PubMed
    1. Jain M. et al.. Metabolite profiling identifies a key role for glycine in rapid cancer cell proliferation. Science 336, 1040–1044 (2012). - PMC - PubMed

Publication types