Comparative Study
. 2016 Oct 10:6:34908.
doi: 10.1038/srep34908.

Genomics-assisted characterization of a breeding collection of Apios americana, an edible tuberous legume

Affiliations
Comparative Study

Genomics-assisted characterization of a breeding collection of Apios americana, an edible tuberous legume

Vikas Belamkar et al. Sci Rep. .

Abstract

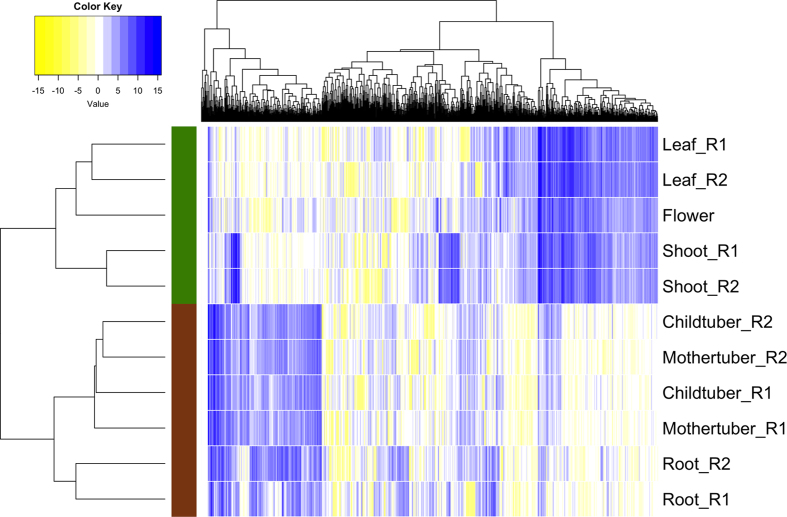
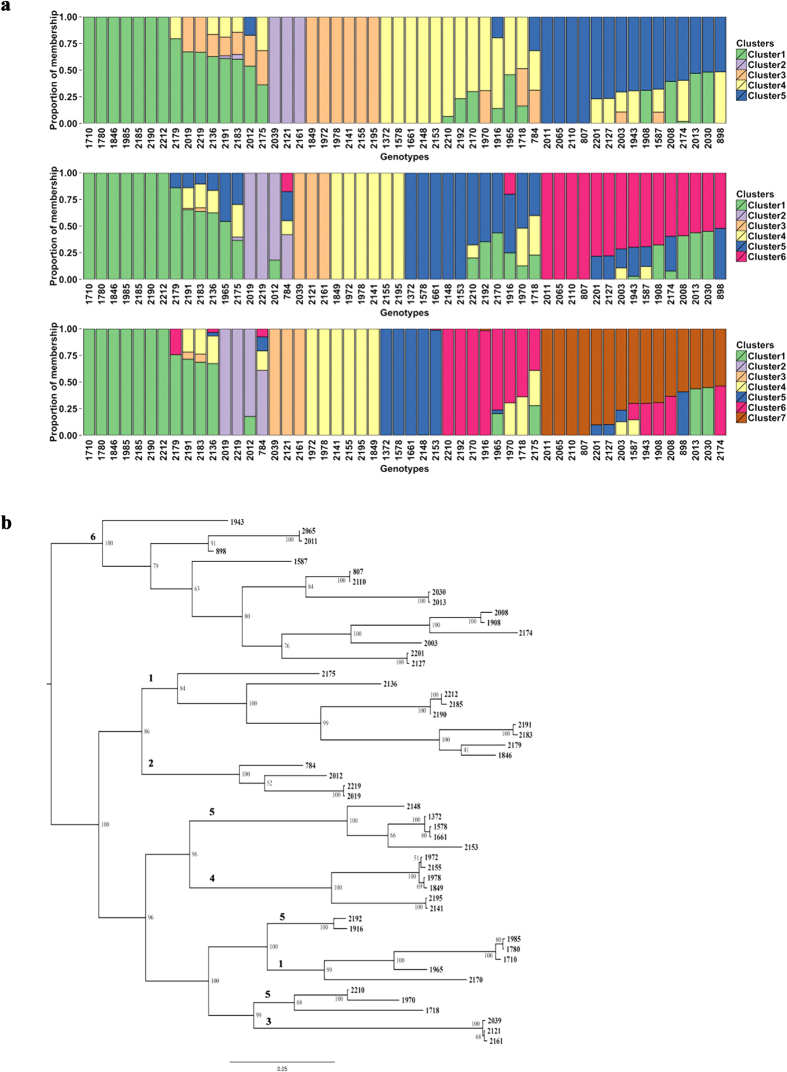
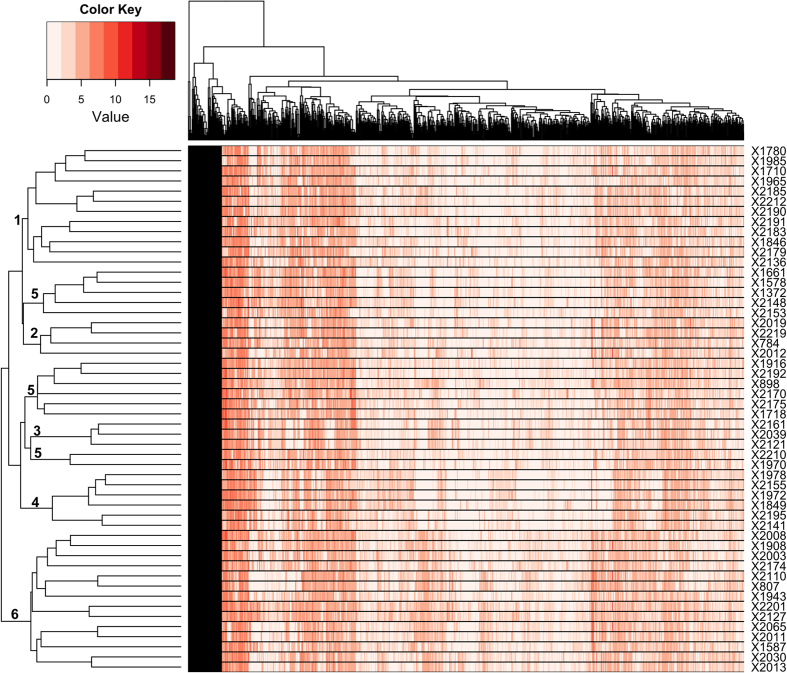
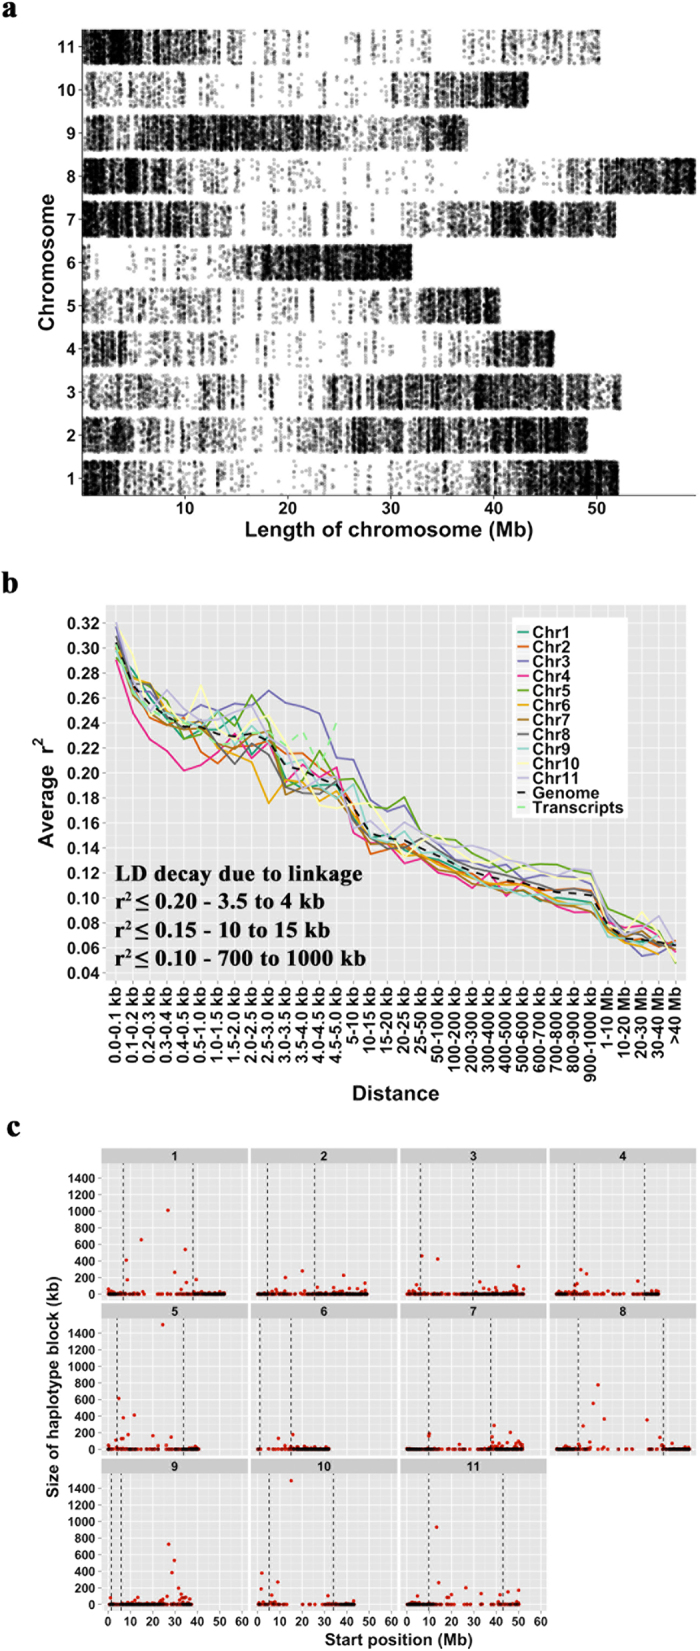
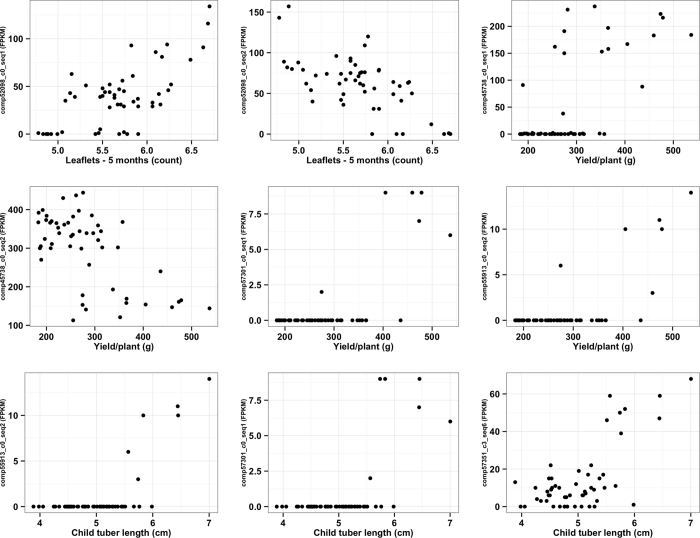
For species with potential as new crops, rapid improvement may be facilitated by new genomic methods. Apios (Apios americana Medik.), once a staple food source of Native American Indians, produces protein-rich tubers, tolerates a wide range of soils, and symbiotically fixes nitrogen. We report the first high-quality de novo transcriptome assembly, an expression atlas, and a set of 58,154 SNP and 39,609 gene expression markers (GEMs) for characterization of a breeding collection. Both SNPs and GEMs identify six genotypic clusters in the collection. Transcripts mapped to the Phaseolus vulgaris genome-another phaseoloid legume with the same chromosome number-provide provisional genetic locations for 46,852 SNPs. Linkage disequilibrium decays within 10 kb (based on the provisional genetic locations), consistent with outcrossing reproduction. SNPs and GEMs identify more than 21 marker-trait associations for at least 11 traits. This study demonstrates a holistic approach for mining plant collections to accelerate crop improvement.


Figures

Figure 1
Figure 1. Breeding strategy and pedigree of the Apios americana collection.
(a) Breeding strategy utilized by Dr. Blackmon and Mr. Reynolds during 1985–1994 at Louisiana State University Agricultural Experiment Station in Baton Rouge, LA, for developing elite genotypes used in this study. This information is based on an interpretation of the field books of Dr. Blackmon and Mr. Reynolds. (b) Partial maternal lineage information that was traced from the field books for 35 of the 53 genotypes. The genotypes that produced seeds were recorded as maternal parents, and the genotypes that were growing close to the maternal parent were recorded as likely paternal parents. Hence, there are usually multiple paternal parents listed for a genotype. The genotypes in bold are the ones that exist in the collection used in this study.
Figure 2
Figure 2. Heat map of the normalized RNA-Seq data showing expression of transcripts in six tissues of accession 2127.
The normalized RNA-Seq data is in log2 scale. One thousand transcripts with highest variances across the 11 samples were utilized to make the heat map. Letters R1 and R2 represent replicates 1 and 2 of the corresponding tissues. The aboveground and belowground tissues clustered separately and are highlighted in green and brown color respectively.
Figure 3
Figure 3. Population structure.
(a) Population structure using variational Bayesian framework–implemented in the program fastSTRUCTURE. The possible 5, 6 or 7 clusters (K = 5, 6 or 7) identified are shown. The Y-axis represents the proportion of membership of a genotype to the respective cluster, and the X-axis indicates genotypes in the collection. (b) Phylogeny built using maximum likelihood implemented in the package SNPhylo. Numbers 1 to 6 represent the clusters identified in Fig. 3a.
Figure 4
Figure 4. Population structure derived from gene expression markers (GEMs).
Phylogeny built using 1,000 GEMs (in log2 scale) that show highest variances across the 52 samples. A Euclidean distance matrix was utilized followed by hierarchical clustering with Ward’s linkage. Numbers 1 to 6 represent the clusters identified in Fig. 3a.
Figure 5
Figure 5. Genome-wide SNP distribution, linkage disequilibrium and haplotype blocks.
(a) Distribution of SNPs identified in the Apios collection along the 11 Phaseolus vulgaris chromosomes. Apios transcripts were mapped to the Phaseolus vulgaris genome assembly (version 1.0), and location information was retrieved for 46,852 of the 58,154 SNP markers. (b) Decay of linkage disequilibrium along each of the putative chromosomes, across the genome, and transcripts. (c) Distribution of haplotype blocks along each of the chromosomes. The black dashed genotypes represent pericentromeric start and end coordinates of each of the chromosomes obtained from the P. vulgaris genome.
Figure 6
Figure 6. Scatter plots of nine interesting marker-trait associations identified using gene expression markers (GEMs).
Linear regression analysis was performed with 39,609 GEMs as dependent variables, and each of the 20 phenotypic traits as independent variables. We identified 28 GEM-trait associations, nine of which are shown in this figure. The Y-axis of each plot represents FPKM normalized expression values of a transcript for 52 genotypes, and X-axis represents REML-based LS means for the phenotypic trait measured on these genotypes.

References

    1. Vega-Galvez A. et al.. Nutrition facts and functional potential of quinoa (Chenopodium quinoa willd.), an ancient Andean grain: a review. J Sci Food Agric 90, 2541–2547 (2010). - PubMed
    1. Peterson A., Jacobsen S.-E., Bonifacio A. & Murphy K. A Crossing Method for Quinoa. Sustainability 7, 3230–3243 (2015).
    1. Wu G., Morris C. F. & Murphy K. M. Evaluation of texture differences among varieties of cooked quinoa. J Food Sci 79, S2337–S2345 (2014). - PubMed
    1. Cox T. S., Van Tassel D. L., Cox C. M. & DeHaan L. R. Progress in breeding perennial grains. Crop and Pasture Science 61, 513–521 (2010).
    1. DeHaan L. R. Progress in developing Kernza wheatgrass as a perennial grain. Water, Food, Energy & Innovation for a Sustainable World, Annual Report of The Land Institute, https://landinstitute.org/sites/default/files/fy2014_annual_report.pdf (2014).

Publication types

LinkOut - more resources